
PowerPoint for Microsoft 365 PowerPoint 2021 PowerPoint 2019 PowerPoint 2016 PowerPoint 2013 PowerPoint 2010 More…Less
If you are using PowerPoint 2013 or a newer version, you can link data from a saved Excel worksheet to your PowerPoint presentation. That way, if data in the worksheet changes, you can easily update it in your PowerPoint presentation.
Link an entire Excel worksheet to PowerPoint
-
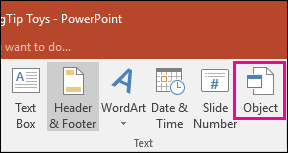
In PowerPoint, on the Insert tab, click or tap Object.

-
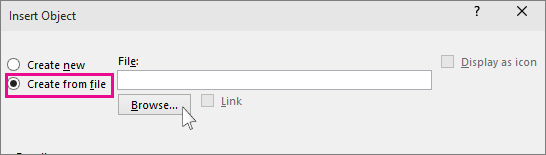
In the Insert Object dialog box, select Create from file.
-
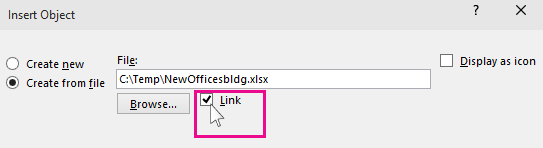
Click or tap Browse, and in the Browse box, find the Excel workbook with the data you want to insert and link to.
-
Before you close the Insert Object box, select Link, and click OK.
Important: The linked object in your presentation displays all the data from the active, top worksheet in the linked Excel workbook. When you save the Excel workbook, make sure the worksheet you want in your presentation is the one you see when you first open the workbook.
Link a section of data in Excel to PowerPoint
-
In Excel, open the saved workbook with the data you want to insert and link to.
-
Drag over the area of data you want to link to in PowerPoint, and on the Home tab, click or tap Copy.
-
In PowerPoint, click the slide where you want to paste the copied worksheet data.
-
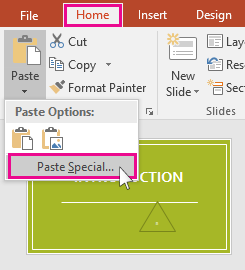
On the Home tab, click the arrow below Paste, and select Paste Special.
-
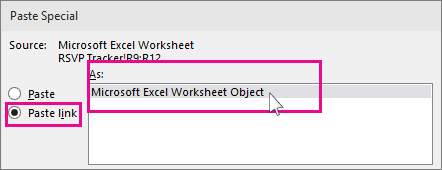
In the Paste Special box, click Paste link, and then, under As, select Microsoft Excel Worksheet Object.
Copy and paste (unlinked) Excel data in PowerPoint
In this case, the Excel data will not be linked to your PowerPoint presentation. You copy the data from an Excel worksheet and paste it into your presentation. The worksheet does not send automatic updates to PowerPoint.
-
In Excel, open the workbook with the data you want to copy.
-
Drag over the area of data you want to copy, and on the Home tab, click or tap Copy.
-
In PowerPoint, click the slide where you want to paste the copied worksheet data.
-
On the Home tab, in the Clipboard group, click the arrow below Paste.
-
Under Paste Options, pick one of the following. Move the mouse pointer over each Paste option to see a preview of what it would look like.
Use Destination Styles to copy the data as a PowerPoint table, using the format of the presentation
Keep Source Formatting to copy the Excel data as a PowerPoint table, using the format of the worksheet
Embed to copy the data as information that can be edited in Excel later
Picture to copy the data as a picture that can’t be edited in Excel
Keep Text Only to copy all the data as a single text box


See Also
Copy an Excel chart to another Office program
Insert a linked worksheet
To insert and link a saved Excel worksheet onto your PowerPoint slide, do the following:
Important: The linked object in your presentation displays all data from the active, top worksheet in the linked Excel workbook.
-
In PowerPoint 2010, on the Insert tab, in the Text group, click Object.
-
In the Insert Object dialog box, select Create from file.
-
Click Browse, and in the Browse dialog box, browse to and then select the Excel workbook that contains the information that you want to insert, and then click OK.
-
In the Insert Object dialog box, select Link and then click OK.
To edit a linked Excel worksheet, do one of the following:
-
To edit the data from within Excel, right-click the object on the slide, point to Linked Worksheet Object, and select Edit.
-
To update the data on the slide to match the data in the original Excel file, right-click the object on the slide, and click Update Link.
Insert a linked selection from a worksheet
To insert and link a selection of data from a saved Excel worksheet, do the following:
-
In Excel, open the workbook containing that data that you want to insert.
-
Select and copy the data that you want.
Keyboard shortcut You can press CTRL+C to copy the data.
-
In PowerPoint 2010, click the slide where you want to paste the copied worksheet data.
-
On the Home tab, in the Clipboard group, click the arrow below Paste, and select Paste Special.
-
In the Paste Special dialog box, under As, select a Microsoft Excel Worksheet Object.
-
Select the Paste link check box and click OK.
To edit a selection of cells from a linked Excel worksheet, do one of the following:
-
To edit the data from within Excel, right-click the object on the slide, point to Linked Worksheet Object, and select Edit.
-
To update the data on the slide to match the data in the original Excel file, right-click the object on the slide, and click Update Link.
Copy a selection of cells onto a slide
To paste a copy a selection of Excel data onto your PowerPoint slide, do the following:
Note: Data copied and pasted onto a PowerPoint slide does not automatically update when the data is changed in the Excel workbook. To link the data on the PowerPoint slide to the original Excel data source, see the «Insert a linked selection from a worksheet» section immediately above.
-
In Excel, open the workbook that contains the information that you want to copy.
-
Select and copy the data that you want.
Keyboard shortcut You can press CTRL+C to copy the data.
-
In PowerPoint 2010, click the slide where you want to paste the copied worksheet data.
-
On the Home tab, in the Clipboard group, click the arrow below Paste.
-
Under Paste Options, do one of the following:
-
Select Keep Source Formatting if you want to copy the data as a PowerPoint table, but want it keep the appearance of the original Excel worksheet.
-
Select Use Destination Styles if you want to copy the data as a PowerPoint table, but want it to assume the appearance of the PowerPoint presentation.
-
Select Embed if you want to copy the data as information that can be edited in PowerPoint.
-
Select Picture if you want to copy the data as an un-editable picture.
-
Select Keep Text Only if you want to copy all the data as a single text box.
-
See Also
Import content from other applications
Copy an Excel chart to another Office program
Need more help?

Try it!
In PowerPoint, you can embed tables and worksheets from Excel in your presentation slides.
-
In Excel, click and drag to highlight the cells you want to copy.
-
Right-click the copied cells and select Copy.
-
In your PowerPoint presentation, right-click and select the Paste Options you want:
-
Use Destination Styles – Choose to edit your copied cells like a PowerPoint table, but with PowerPoint’s color scheme and fonts.
-
Keep Source Formatting – Choose to keep your table editable in PowerPoint while maintaining the same source formatting from Excel.
-
Embed – Choose to keep a copy of your table in PowerPoint in case you want to edit the data, which will open in Excel.
Note: If you’re working with a large Excel file, it’ll inflate your PowerPoint presentation to a big size. You may also unintentionally be giving more access to your Excel file than you intend to.
-
Picture – Choose to paste your table as a picture to get the same benefits as embedding except you can format your cells like a picture and add effects to it. You won’t be able to edit data once it’s been pasted though.
-
Keep Text Only – Choose to paste your table as straight text and to do all formatting in PowerPoint.
-
-
If you pasted as a picture, on the Picture Tools Format tab, select the quick picture style you want to use. Adjust the table to your liking.
Want more?
Insert Excel data in PowerPoint
Copy an Excel chart to another Office program
Need more help?
Want more options?
Explore subscription benefits, browse training courses, learn how to secure your device, and more.
Communities help you ask and answer questions, give feedback, and hear from experts with rich knowledge.
What happens when we want to combine each app’s strengths? When you’re ready to take your data and charts from Excel to PowerPoint, you have options. There are different ways to paste and link your data between these apps.
In this tutorial, you’ll learn how to embed or link an Excel file in PowerPoint. Soon, you’ll know how to embed Excel graphs and charts inside of a PowerPoint presentation. Embedding Excel into PowerPoint is a top skill in 2023, and you’ll find yourself doing it every day.
We also have a useful complement to this tutorial. Quickly grab it before you read on. Download our FREE eBook: The Complete Guide to Making Great Presentations, which will help you write, design, and deliver the perfect presentation.


How to Embed Excel Files & Link Data into PowerPoint (Quick Video)
In this quick three minute screencast below, I’ll show you how to work back and forth between Excel and PowerPoint. You’ll learn to embed Excel files in PowerPoint, link your data between the two apps, and can keep your data up to date.
Read on to learn more about different methods for working with data between Excel and PowerPoint.
In this video, we used the now-discontinued Marketofy PowerPoint Template from GraphicRiver. When you need an embedded Excel in PPT, turn to the vast Envato Elements library for thousands of custom PowerPoint options. You’ll find template designs for all topics.
How to Embed Excel Charts in PowerPoint
Imagine that we’ve built a great-looking Excel chart. It features plenty of data and a stylish design aesthetic. But Excel isn’t the best tool for sharing with an audience. It’s best to embed Excel in PowerPoint to present with.
Remember: Excel and PowerPoint are both part of the Microsoft Office suite of productivity apps. They work well together. You can finish styling the chart in PowerPoint.
But you might not be done making style changes. Fortunately, you’re in luck.


Throughout this tutorial, you’ll see the SIMPLECO PowerPoint template featured. It’s a robust premium design from Envato Elements. Download it today to follow along.
The tips in this section were written using Windows and Office 365. If you’ve got a different operating system or a different version of the apps, your steps may be slightly different.
Start Embedding Excel Into PowerPoint
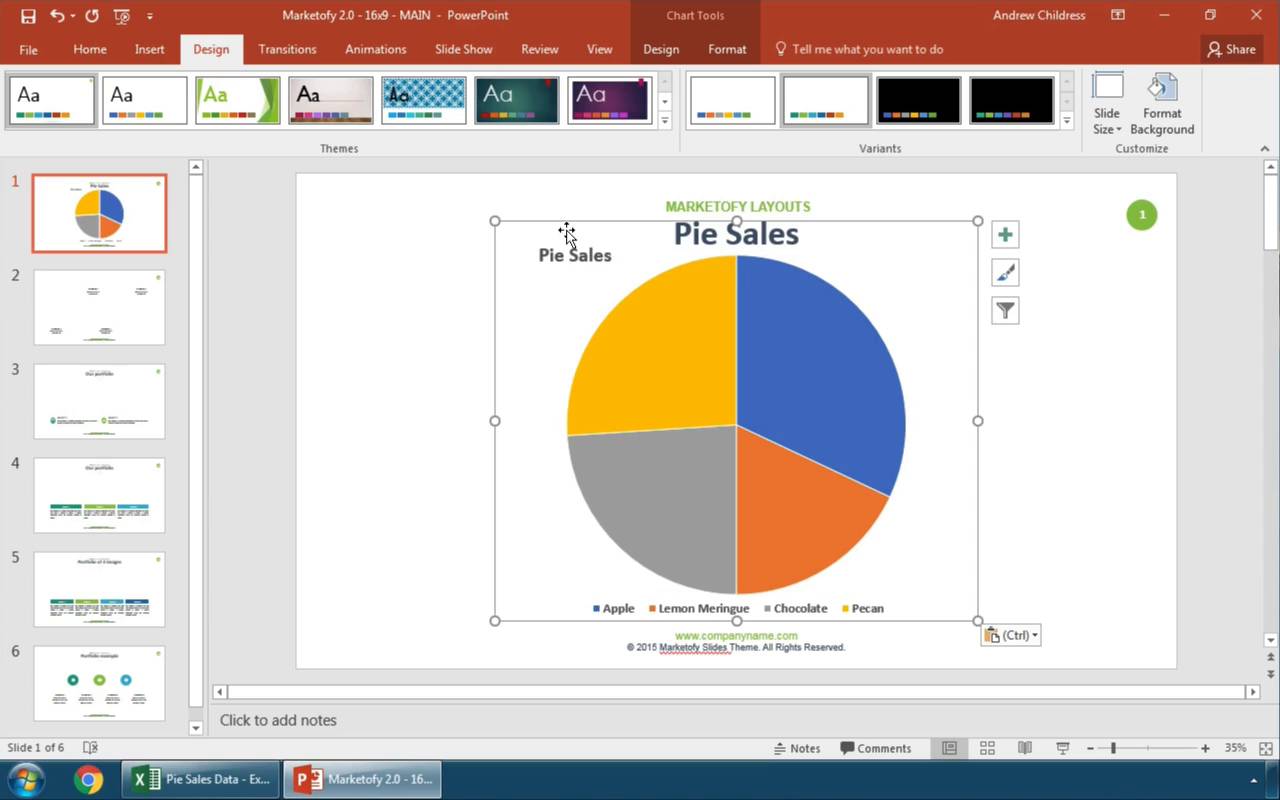
Now, let’s get started with the simplest way to make a PowerPoint embedded Excel. The first step is to click on your chart inside of Excel and make sure it’s selected. Then, you can press copy, either by pressing Ctrl + C on your keyboard or pressing the Copy button on Excel’s ribbon.


Now, let’s switch over to the SIMPLECO template, which is open in PowerPoint. Find some space on one of your slides. Then, press either Ctrl + V on your keyboard, or press the Paste button on PowerPoint’s ribbon. Below, you can see that the data and amounts match when you paste.


Notice that it brought over the same data from our Excel workbook, but it reformatted the style to match the PPT presentation. These are the default options to take charts from Excel to PowerPoint.
This is the most basic way to place an Excel chart inside your PowerPoint file. But as always, there’s more power hidden behind the scenes in PowerPoint.
Excel to PowerPoint Paste Options Explained
Maybe you want to paste your chart as a picture that the viewer can’t edit. Or maybe you want to link your Excel chart to PowerPoint so that they update data and stay synced.
When you’re taking charts from Excel to PowerPoint, you really have two choices to make:
- How do you want to handle the data — should it be linked to an Excel workbook, or embedded right inside the PowerPoint file?
- Should the style of the chart stay the same, or should it match the rest of your presentation?
These options are all available when you Right-click inside PowerPoint with a chart on your clipboard.


There are actually five ways that you can take data from Excel to PowerPoint, and each of them handles your data a bit differently. For your reference, here are the descriptions of each of the paste options in PowerPoint:
- Use Destination Theme and Embed Workbook
- Keep Source Formatting and Embed Workbook
- Use Destination Theme and Link Data
- Keep Source Formatting and Link Data
- Paste as picture
I think of the major categories as embedding, linking, and pasting as a picture. Let’s learn about each of those categories.
1. Embed Excel Workbook in PowerPoint
The first two icons (1 and 2) allow you to embed data inside the PowerPoint file. This means that PowerPoint stores the data behind the scenes inside the PowerPoint file.
Once you paste the file in and embed the workbook, the data is separated from the Excel file and stored inside the PowerPoint file.
If Excel’s data updates, the PowerPoint chart won’t update automatically.


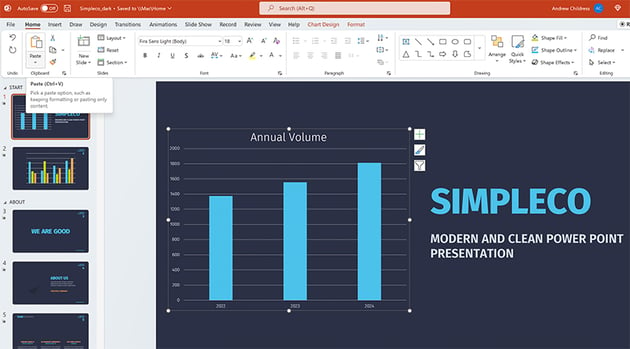
To update the data inside of an embedded Excel file, you can right-click the chart and choose Edit Data from the menu. This opens an embedded Excel spreadsheet inside the PowerPoint file where you can edit the data in the chart.


Embedding data has many advantages. The charts in your presentation work whether or not you’ve got access to the original Excel file. Embedding does increase the size of your PowerPoint file.
The major downside to embedding data is that it doesn’t stay synced to the Excel file that you’re doing analysis and data review inside of. If you’re going back and forth between the two apps, linking might be a better choice.
2. Link Excel Data to PowerPoint
Linking data (icons 3 and 4) keeps your PowerPoint and Excel file in sync. If you change the data for the chart in Excel, you can update the pasted chart in PowerPoint to use the latest data.
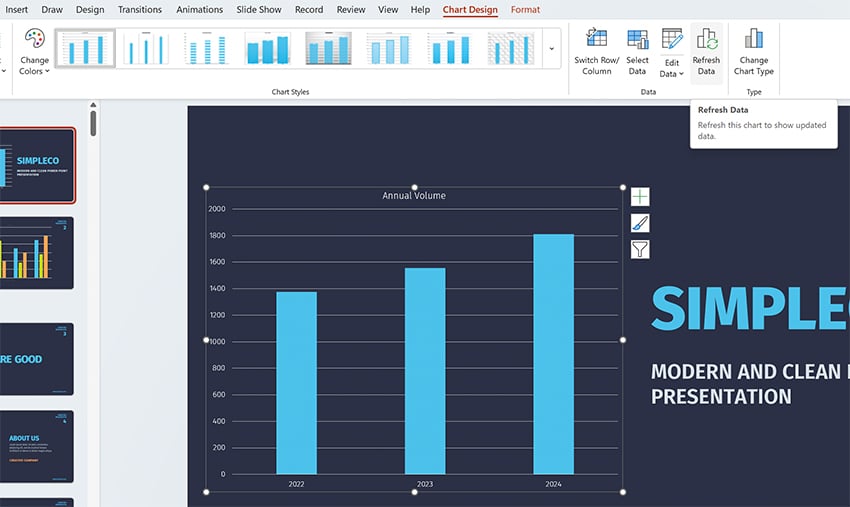
When PowerPoint and Excel are both open at the same time, this happens automatically for linked data. Make a change in Excel, and the linked PowerPoint chart updates in real time.
If you’re working in Excel and PowerPoint at different times, you’ll want to update your data. Make sure to hit Refresh Data on the Chart Design tab on PowerPoint’s ribbon.


Linking is great to keep the data connected so that you don’t have to keep rebuilding your charts as you move from Excel to PowerPoint.
But linking your data directly to Excel isn’t always the right choice. The downside to using the linked option is two-fold:
- If you send your PowerPoint file to someone and they don’t have access to the Excel file, refreshing data won’t work.
- If others are changing the linked Excel file behind the scenes without your knowledge, you run the risk of updating your presentation with incorrect data.
If you’re still a bit fuzzy about choosing between embedding and linking data from Excel to PowerPoint, check out the official Microsoft help page to see a comparison of the two.
3. Paste Excel Chart as Picture in PowerPoint
The final option to place a chart in PowerPoint is to simply paste the chart you built in Excel as a flattened, non-editable picture.
When you paste a chart as a picture, the styles will appear the same as the Excel version of the chart and no longer be editable within PowerPoint.


This feature is handy when you want to ensure that the data isn’t changed or altered by the recipient. But pasting as a picture causes you to lose any ability to edit or change the chart.
Excel to PowerPoint Paste Formatting Options
Whether you choose to embed or link your data, you can choose how to handle the style of your charts when you move from Excel to PowerPoint. Both «embed» and «link» options have two choices for how to handle styling.
Let’s look at the difference between «Use Destination Theme» and «Keep Source Formatting.» These options don’t change the way we work with data—both options embed your data in the PowerPoint file—but they do change the appearance of the charts.
- Keep Source Formatting. Uses the same chart style used in Excel.
- Use Destination Theme. Matches the style of your chart to the PowerPoint theme.
In the screenshot below, you can see examples of each option. Using Keep Source Formatting kept the chart exactly the same as it appeared in Excel. Use Destination Theme helps your charts blend in with the rest of the presentation.


Once a chart is placed in the PowerPoint file, you can edit and restyle the presentation. Think of this paste option as the starting point.
We’ve learned about embedding Excel into PowerPoint. As you can see, linking the two apps is a seamless process. It helps you keep data and charts up to date to share with your audience. But sharing data can still seem daunting. What are some good rules of thumb? What do you need to do to succeed?
Read on for five of my favorite tips for effectively sharing data in PowerPoint. Embrace these ideas to succeed in 2023:
1. Opt for Colorful Styling
Bland, flat styles never inspired anyone. The trick is to use bright, colorful styles. You’ll enjoy several benefits when you do this. First, you’ll have shareable charts that are creative and engaging. You won’t bore your audience.


Plus, the creative use of color helps add contrast. For example, if you’re sharing charts, you can make each data series a different color. This makes your PowerPoint embedded Excel much easier to read and understand.
2. Animate to Control the Pace and Flow
Data is best shared as part of a narrative flow. In other words, you don’t always want your audience to see it all at once. That’s especially true if you’re providing details along the way. Data without context is “information overload” and can quickly become confusing.
Using animations in PowerPoint is a great way to control the pace and flow of your data slides. You can present Excel-based data in a certain order, rather than all at once.
Learn how with our full tutorial on PowerPoint’s Animation pane, the control center for slide animation:
3. Use Unconventional Charts and Infographics
Often, basic Excel charts and graphs work well for sharing your data. But sometimes, it pays to be creative. Unique infographics and charts help you share information in new and creative ways.


Even PowerPoint’s built-in chart features are robust enough to craft new designs. Next time you’re linking data to Excel, try out a funnel, waterfall, or sunburst chart. These are tailor-made for custom data sharing. You can use them all when you’re embedding Excel into PowerPoint.
4. Expand Beyond Numerical Data
When you think of data, it’s easy to think of numbers. And of course, that’s likely the most common type of data. But you can use charts and graphics to share data that isn’t numerical. Remember: these are tools to share ideas.
For example, you can use a chart to introduce your team and explain your organization’s structure. It’s a good way to illustrate an idea that may be hard to explain with words alone. And of course, you can embed this right from Excel using PPT tables and more.
For a detailed look at org charts in PPT, view our tutorial now:
5. Be Specific with Design
Premium PowerPoint themes from Envato Elements are available for any subject. Many are well-suited for any topic with a few quick edits. But others are specific and intentional with their themes.


For example, you’ll find many PPT templates geared toward a specific industry. This extends to their layouts, themes, and your ability to embed data. Why not choose a custom, themed template for your next project? These templates look amazing, and they deliver design inspiration on every slide.
Keep Learning More About Excel and PowerPoint
Keep in mind that there are different ways to manage your data based upon the paste option you use. On Envato Tuts+, we have a wealth of resources that help you master both apps!
Dig into more helpful Excel and PowerPoint tutorials on Envato Tuts+:
Make Great Presentations (Free eBook Download)


We have the perfect compliment to this tutorial, which will walk you through the complete presentation process. Learn how to write your presentation, design it like a pro, and prepare it to present powerfully.
Download our Book: The Complete Guide to Making Great Presentations. It’s available for free with a subscription to the Tuts+ Business Newsletter.
Now You Know How to Embed Excel in PowerPoint
Keeping your PowerPoint graphs linked to Excel data is handy. Embedded data gives you the flexibility to edit your data right inside the presentation. It comes down to how you want (or don’t want) to keep your data synced between Excel and PowerPoint.
With linked data, you don’t have to recreate and reformat your charts each time the original data changes. This embedded Excel in PPT approach ensures you won’t forget to make an update. Go practice it now with a presentation of your own!
Editor’s Note: This tutorial was first published in July of 2017. It’s been comprehensively updated for accuracy by Andrew Childress.
Электронная таблица Excel часто используется вместе с презентациями PowerPoint для создания отчетов о бюджете, бизнес-планов, сведений об инвентаризации, финансовых отчетов, отчетов о состоянии проекта и т. Д. Электронная таблица Microsoft Excel, вероятно, является один из лучших инструментов, используемых для учета и планирования бизнеса. Мы часто используем таблицы Excel для анализа данных, планирования событий, планирования аудитов, составления диаграмм, расчета бюджета, планирования расходов и т. Д. Чтобы представить эти аналитические отчеты, созданные в Excel, мы в основном используем Microsoft PowerPoint для профессиональной презентации.
Как листы Excel, так и слайды PowerPoint используются бок о бок, и мы часто копируем таблицы и диаграммы из Excel и вставляем их в слайд PowerPoint для создания презентации в виде слайд-шоу. Но мы обычно постоянно обновляем таблицы Excel новыми данными, и в таких случаях неудобно менять все таблицы в слайдах PowerPoint. Этого препятствия для обновления изменений, внесенных в лист Excel, в слайд Powerpoint можно избежать, связав данные Excel с PowerPoint.
Содержание
- Конвертировать Excel в PowerPoint
- Скопируйте и вставьте данные Excel в PowerPoint
- Связать лист Excel с PowerPoint
- Связать раздел данных в Excel с PowerPoint
Конвертировать Excel в PowerPoint
К счастью, Microsoft позволяет использовать технику связывания и встраивания объектов, также известную как OLE, для связывания данных из электронной таблицы Excel со слайдами PowerPoint, которые автоматически обновляют презентации Powerpoint при внесении изменений в таблицу Excel. В этом случае лист Excel является исходным файлом, а информация из объекта Excel связана с PowerPoint. При этом любые изменения в исходном файле отражаются непосредственно в связанных объектах в PowerPoint. В этой статье мы расскажем, как скопировать данные из листа Excel и поместить их в презентацию PowerPoint со встроенными элементами управления.
Скопируйте и вставьте данные Excel в PowerPoint
Вы можете скопировать таблицы данных из электронной таблицы Excel и вставить их в презентацию PowerPoint. Однако данные в PowerPoint не обновляются автоматически при изменении или обновлении данных электронной таблицы.
Откройте файл Excel , который вы хотите скопировать, и выделите все данные в файле, который вы хотите скопировать, перетащив область нужных вам данных.
Перейдите на вкладку Главная и нажмите Копировать.

Теперь откройте Microsoft PowerPoint и откройте слайд-презентацию, куда вы хотите вставить данные электронной таблицы.
Нажмите правой кнопкой мыши на слайде и выберите вариант Вставить в раскрывающемся меню.
Вы можете изменить параметры презентации, нажав на значок буфера обмена.
После этого нажмите Сохранить , чтобы применить изменения.
Связать лист Excel с PowerPoint
При связывании электронной таблицы Excel с PowerPoint все содержимое файла в качестве объекта будет вставлено в презентацию PowerPoint.
Откройте Microsoft PowerPoint и перейдите на вкладку Вставить .
Нажмите Объект в разделе «Текст».

Появится диалоговое окно Вставить объект . Нажмите на переключатель с параметром Создать из файла .

Нажмите кнопку Обзор и выберите электронную таблицу Excel, данные которой вы хотите связать с Powerpoint.
Установите флажок Ссылка и нажмите ОК.

Измените размер снимка электронной таблицы на слайде и дважды щелкните ее, чтобы открыть файл в Microsoft Excel.
Связать раздел данных в Excel с PowerPoint
Запустите Microsoft Excel и откройте электронную таблицу, которую вы хотите связать с PowerPoint.
Выберите данные, которые вы хотите вставить в слайд PowerPoint, перетаскивая область данных.
Перейдите на вкладку «Главная» и нажмите «Копировать».
Запустите PowerPoint и откройте слайд PowerPoint, куда вы хотите вставить данные.
Перейдите на вкладку «Главная» и нажмите стрелку рядом с параметром «Вставить».

Выберите Специальная вставка.
В диалоговом окне Специальная вставка нажмите переключатель с параметром Вставить ссылку и в разделе Вставить ссылку Как , выберите Объект Microsoft Excel Worksheet и нажмите Ok.

Стоит отметить, что описанная выше методика OLE не будет работать, если исходный файл Excel будет переименован или если вы переместите исходный файл из исходного местоположения, поскольку ссылка не сможет найти файл.
Это все.
Skip to content
![]()
After finishing calculations in Excel, you want to present your results. In many cases, a PowerPoint presentation is the best way to show your tables and charts. There are many ways to export a table or a chart to PowerPoint. They all have advantages and disadvantages. In the following we will take a look at three strategies, compare them and provide a recommendation for you.
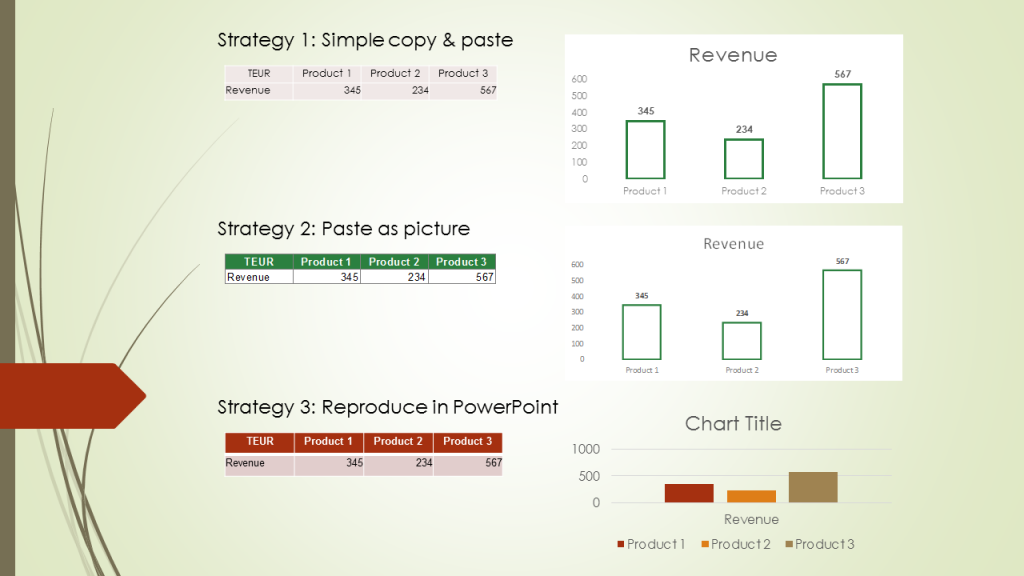
Strategy 1: Simple copy-and-paste (not recommended)
Method
The easiest way is to just copy your table or chart in Excel and paste it to PowerPoint. Follow these steps:
- Select the item (table or chart) you want to copy and press Ctrl + C on the keyboard.
- Open your PowerPoint slide.
- Paste it by pressing Ctrl + V on the keyboard.
That’s it. Sounds simple, right? But let’s take a closer look at the advantages and disadvantages.
Advantages:
- It’s the fastest of the three strategies.
Disadvantages:
- Please be careful with this methods: If you copy and paste charts, the complete Excel workbook is embedded into your PowerPoint slide. That means, all your data and calculations are available for anyone who has the PowerPoint presentation. You should make sure that there is no confidential content in your workbook.
- If you copy and paste a table range, the formatting will be lost: Neither will PowerPoint adapt the it to the standard formatting of tables in your slide master nor will it use the formatting from your Excel file.
- Newer versions of Excel will establish links to your file. You could press “Refresh Data” on the “Design” ribbon within the “Chart Tools” group in order to refresh it. But the links easily break once you rename the file, create new versions or send it by e-mail.
Strategy 2: Export from Excel to PowerPoint as images (recommended)
Method
If you choose to copy a table or a chart as a picture, there are two major advantages: It’s not linked to the data (well, in most cases that’s an advantage…) and the format is fixed. The format can’t be changed any more. Unfortunately the images often look ‘pixelated’. So, how to do export the charts and tables and keep a high quality?
- Select the table or chart and copy it in Excel.
- Switch to PowerPoint.
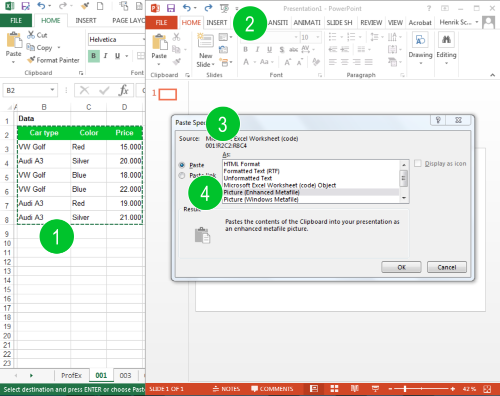
- Insert it by pressing Ctrl + Alt + V (Paste Special).
- Now it’s crucial for the best quality to select “Picture (Enhanced Metafile)”.
Advantages:
- You can keep your Excel layout. Previously formatted charts and tables in Excel will look (more or less) exactly the same in PowerPoint.
- No linking: The data is not linked to Excel. That might be a disadvantage as well, but because the linking is usually very “unstable” and breaks easily, we count it as a disadvantage here.
- “What you see is what you get”: There are no hidden data or sheets embedded in your PowerPoint presentation.
- It’s usually faster than reproducing the charts and tables in PowerPoint (see Strategy 3 below).
Disadvantages:
- You always need the corresponding Excel file to update your data.
- The results might look slightly less beautiful compared to if you reproduce the charts and tables in PowerPoint (as in Strategy 3 below).
Strategy 3: Reproduce charts and tables in PowerPoint (recommended)
If you are going to reproduce the charts and tables from your Excel workbook in PowerPoint, you have to differentiate between tables/cell ranges and charts.
Tables
Please follow these steps for inserting a table using the built-in table format in Excel:
- Go to the “Insert” ribbon.
- Click on “Table” and define the size of the table.
- Now switch to Excel and copy the desired range of cells you’d like to export to PowerPoint by pressing Ctrl + C on the keyboard.
- Switch back to PowerPoint, select the new (still blank) table and press Ctrl + V on the keyboard.
Charts
Reproducing charts in PowerPoint works similar to creating charts in Excel:
- Go to the “Insert” ribbon.
- Click on “Charts” and select your desired chart type.
- Switch to Excel and copy the range of cells as the input data for your chart by pressing Ctrl + C on the keyboard.
- Go back to PowerPoint, select the small Excel window which opened when you inserted the chart in step 2 above. Paste the data into this window.
- That’s it. Now you can proceed with the fine-tuning of your chart.
Advantages:
- The results usually look the best and colors and layout is usually most consistent.
- There is no hidden data as if you embed the whole Excel file within your PowerPoint presentation (like in Strategy 1 above).
- Changing sizes (especially if the aspect ratio is affected) is simple.
- You don’t necessarily need the Excel file in order to update the charts and tables.
Disadvantages:
- Takes more time than Strategy 2 above.
Conclusion
- In most cases don’t simply copy and paste your Excel work into PowerPoint.
- If you are in a hurry: Choose Strategy 2.
- If you got some time, you could consider using Strategy 3.
In comparison with a simple table and chart:

Henrik Schiffner is a freelance business consultant and software developer. He lives and works in Hamburg, Germany. Besides being an Excel enthusiast he loves photography and sports.
We use cookies on our website to give you the most relevant experience by remembering your preferences and repeat visits. By clicking “Accept”, you consent to the use of ALL the cookies.
.