
Power Query умеет подключаться не только к web страничкам, но и к API, не требующим авторизации. Если API позволяет анонимным пользователям забирать данные, Power Query подойдёт идеально.
Подключимся к API застройщика, чтобы отслеживать актуальную стоимость квартиры. Находим нужную квартиру на сайте застройщика: https://beta.pik.ru/flat/801472.
«https://api.pik.ru/v1/flat?id=» — URL адрес, по которому застройщик предоставляет информацию, а «801472» – идентификатор квартиры.
Информация на сайте показана красиво, но разбросана по разным вкладкам.
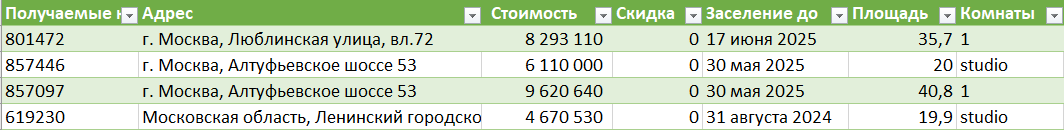
Мы же хотим получить лаконичную табличку в Excel:
| Адрес |
| Стоимость |
| Скидка |
| Заселение до |
| Площадь |
| Комнаты |
| Этаж |
| Ссылка |
GET-запрос к API ПИК на Power Query
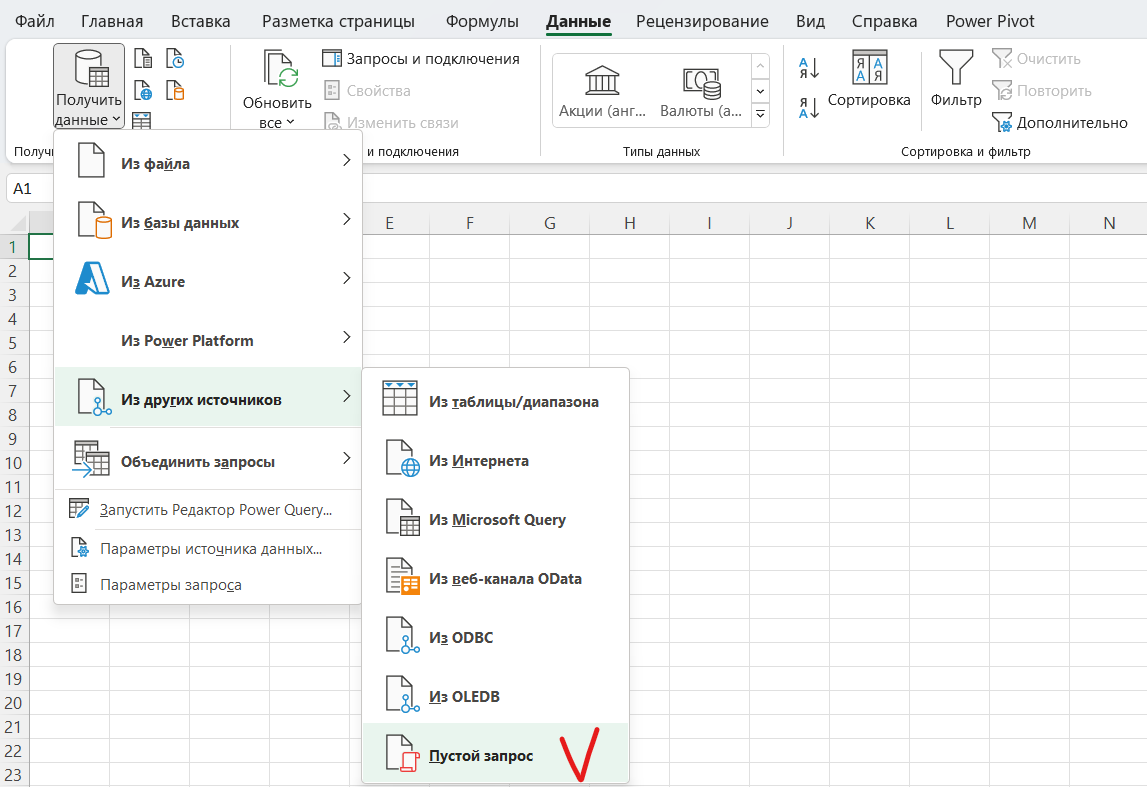
Для разнообразия воспользуюсь Power Query в Excel. Создаем пустой запрос:
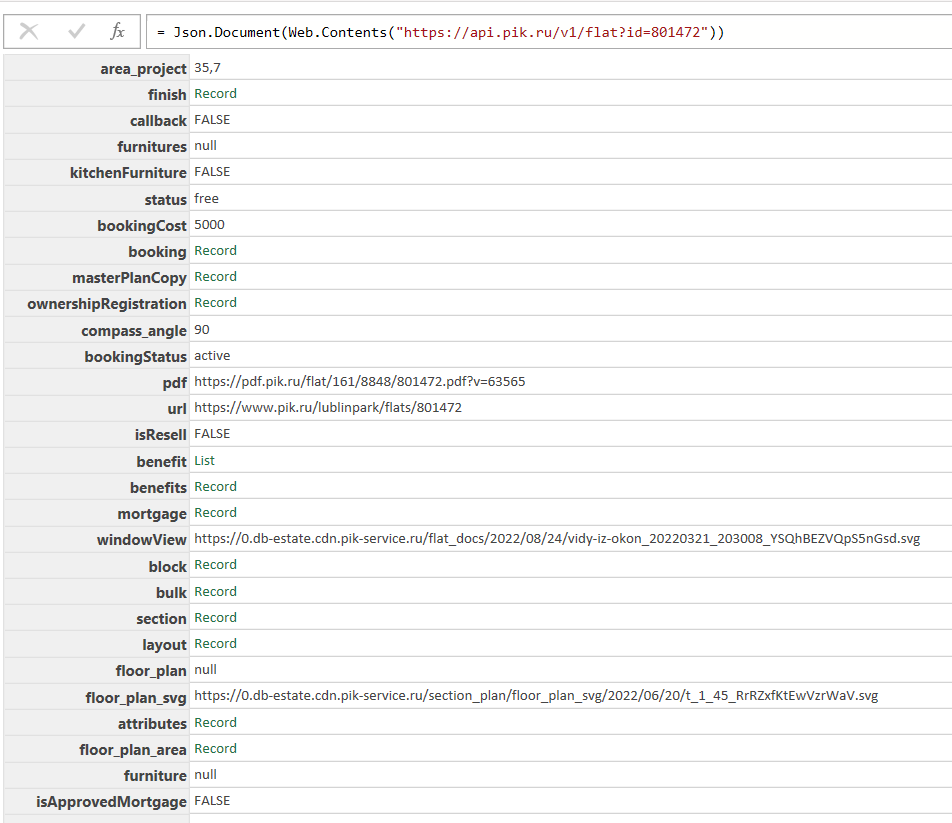
В строке формул пишем:
Json.Document(Web.Contents("https://api.pik.ru/v1/flat?id=801472"))В результате получаем строку с вложенными составными элементами, которые также могут содержать вложенные элементы:
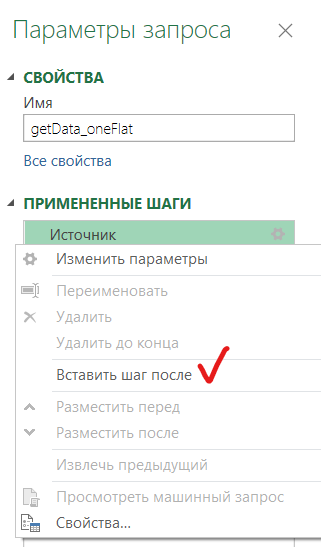
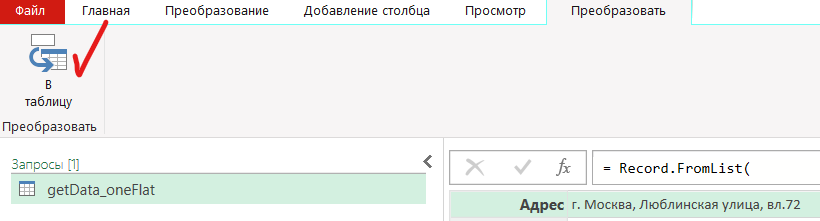
Называем запрос «getData_oneFlat» и вставляем пустой шаг после шага Источник (чтобы открыть меню — щелкаем правой кнопкой мышки на шаг Источник):
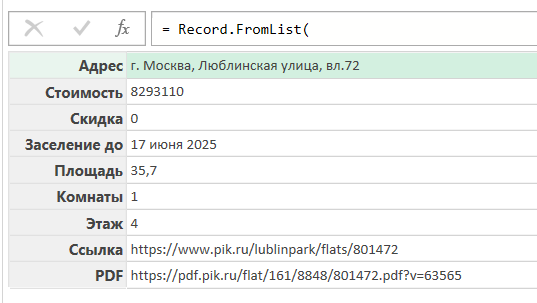
С помощью функции Record.FromList формируем строку с нужными данными, используя шаг Источник. В строке формул пишем:
Record.FromList(
{Источник[block][address], Источник[price], Источник[discount], Источник[bulk][date_till], Источник[area], Источник[rooms], Источник[floor], Источник[url], Источник[pdf]},
type [ Адрес = text, Стоимость = number, Скидка = number, Заселение до = text, Площадь = number, Комнаты = number, Этаж = number, Ссылка = text, PDF = text])
Давайте разбираться как работает функция Record.FromList:
- Первый аргумент функции отвечает за содержимое полей – это список:
{Источник[block][address], Источник[price]} - Источник[price] – возвращает содержимое поля price
- Источник[block][address] – возвращает содержимое поля address из Record вложенной в поле block
- Второй аргумент отвечает за названия и тип полей – это строка:
type [Адрес = text, Стоимость = number]
Результат — строка нужных нам значений:
Преобразуем строку в таблицу:
Выгрузим результат на лист Excel и посмотрим что получилось:
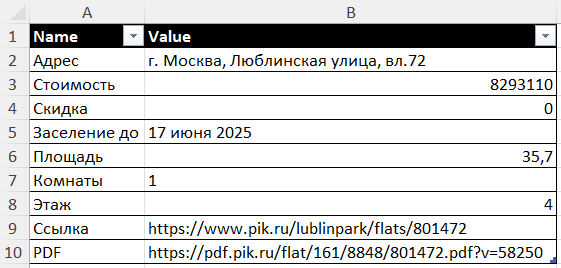
Такой формат нас устроит, теперь мы видим всю информацию по квартире в удобной таблице.
Несколько GET-запросов с помощью функции
Теперь попробуем забрать сразу несколько квартир и разместить их в одной табличке.
Для этого убираем последний шаг и создаём функцию getData от параметра flat (номер квартиры), заменяя сам номер на «flat»:
(flat as text)=>
let
   Источник = Json.Document(Web.Contents("https://api.pik.ru/v1/flat?id="& flat )),
   create_table = Record.FromList(
{Источник[block][address],
Источник[price],
Источник[discount],
Источник[bulk][date_till],
Источник[area],
Источник[rooms],
Источник[floor],
Источник[url],
Источник[pdf]
},
type [
Адрес = text,
Стоимость = number,
Скидка = number,
Заселение до = text,
Площадь = number,
Комнаты = number,
Этаж = number,
Ссылка = text,
PDF = text
])
in
   create_table
Теперь наша функция будет получать данные по той квартире, которую мы укажем в параметре.
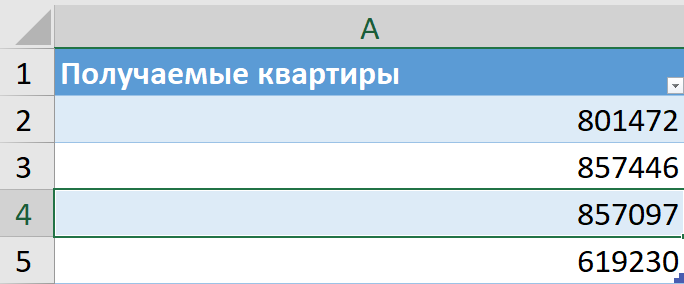
Составляем на листе Excel список интересных нам квартир:
Загружаем список квартир в Power Query, выставляем столбцу текстовый тип. Затем добавляем новый столбец с вызовом нашей функции от каждой квартиры в списке, получается такой код:
let
   Источник = Excel.CurrentWorkbook(){[Name="Таблица2"]}[Content],
   #"Измененный тип" = Table.TransformColumnTypes(Источник,{{"Получаемые квартиры", type text}}),
   #"Вызвана настраиваемая функция" = Table.AddColumn(#"Измененный тип", "getData", each getData([Получаемые квартиры]))
in
   #"Вызвана настраиваемая функция"
Таблица в Power Query выглядит так:
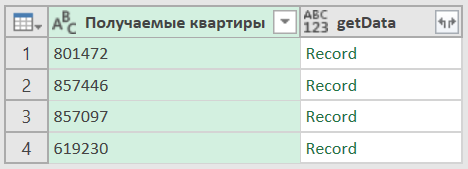
Нажимаем на стрелочки справа от «getData» и разворачиваем нужные столбцы, а затем выгружаем всё на лист Excel. Теперь у нас есть табличка со стоимостью, скидками, площадью и датами заселения для всех интересных нам объектов:
Заключение
Пример вызова API сайта компании ПИК показывает как Power Query может быть полезен в бытовых задачах. Используйте PQ если вам нужно быть в курсе изменений данных, будь то стоимость квартиры или цена товара в интернет-магазине.
Если компания предоставляет данные по открытому API, вы всегда можете использовать магию Power Query и вывести эти данные себе в Excel-файл. Можно сравнить несколько товаров/категорий или вообще написать алгоритм, который будет отображать только самые интересные товары.
The instructions provided in this article are sufficient for creating an automated integration. But please note that we are not responsible for the outcome if you use the instructions incorrectly, specify incorrect settings, or if there are changes in the app’s API. If you need help with the setup, we can offer this premium integration at an additional fee.
An API is a ‘bridge‘ through which one app obtains/sends information from/to another app. This means that you can load miscellaneous data from your source app to your Excel workbook using the REST API. Moreover, you can even schedule data loads via the API to Excel sheet without any VBA coding! Read our guide to learn how you can do this.
How to use API in Excel – options you have
Basically, you have three options to link API to Excel:
- Power Query: You can query data from APIs using Excel’s built-in tool.
- Coupler.io: This third-party importer will let you automate data exports via APIs to Excel on a custom schedule.
- VBA: This is a code-based option that is suitable for tech-savvy Excel users.
Let’s check out each option in action so that you can make the best choice for your needs. For this, we asked Richard, a cryptocurrency enthusiast, to help us.
Richard wants to analyze the growth tendency of the top crypto coins. To do this, he needs to load data from CryptoCompare using their JSON API.

For testing, Richard will use the following API URL that will load data about the price for five cryptocoins: Bitcoin, Ethereum, Terra, Binance Coin, and Tether.
https://min-api.cryptocompare.com/data/pricemulti?fsyms=BTC,ETH,LUNA,BNB,USDT&tsyms=USD,EUR&api_key={enter-api-key}
Note: This API requires authorization, so Richard has already generated a free API key.
So, let’s start with the option that allows you to schedule exports via API to Excel.
How to regularly pull API data into Excel
For scheduled exports of data from API to Microsoft Excel, Richard will use Coupler.io. It’s a solution that allows you to connect to multiple sources and load data from them to Excel, Google Sheets, or BigQuery. You can export data on demand and automate import on a custom schedule, such as every day or every hour.
For Richard’s case, we’ll use the JSON integration with Excel. Let’s see how it works.
Excel API example with Coupler.io
Sign up to Coupler.io with your Microsoft account. Click Add new importer – this is a boilerplate to set up your connection to API. Choose JSON as a source application and Microsoft Excel as the destination application. Then complete the following steps to load data from API to Excel sheet.
Source
- Insert the API URL to the JSON URL field. Click Continue.
https://min-api.cryptocompare.com/data/pricemulti
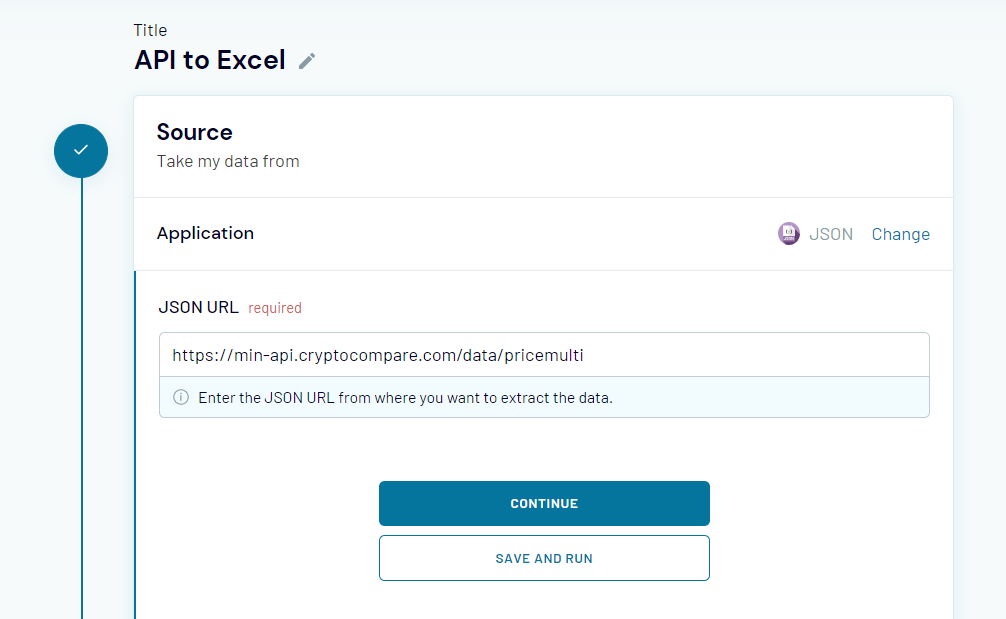
Note: You’ve noticed that this API URL differs from the one mentioned in the beginning. It lacks attached query strings because Coupler.io provides separate fields to specify request headers and URL query parameters. So, Richard will use those to demonstrate how they work.

- Request headers – here, you can apply specific headers to your request, such as Authorization, as Richard did.
authorization: Apikey {enter-api-key}
- URL query parameters – this field is for query parameters for your requests to the API. In Richard’s case, he specified the following strings:
fsyms: BTC,ETH,LUNA,BNB,USDT
tsyms: USD,EUR
Other fields, Request body, Columns, and Path are optional. You can learn more about them in the Coupler.io Help Center.
Note: You can find information about the parameters used in those fields in the API documentation of your application. Pay attention to the information about API authentication and details of API endpoints – these are usually located in separate sections.
Now you’re ready to Jump to the Destination Settings.
Destination
- Select a workbook on OneDrive and a worksheet where the data will be loaded. You can select an existing Excel worksheet or create a new one. Click Continue.

Note: Optionally, you can change the first cell for your imported data range, change the import mode, and add a column that contains the date and time of the last update.
Clicking on Save and Run loads the data from API to Excel right away. But Richard needs to automate this export on a recurring basis, so he needs to complete another step.
How to get data from API in Excel recurrently
You can configure the schedule for your JSON importer during the initial setup or at any other time. For this, you need to toggle on the Automatic data refresh and configure the frequency:
- Interval – from every month to every 15 minutes.
- Days of week – select the days you want to have the importer run.
- Time preferences – select the time when you want to have your data importer from the API.
- Schedule time zone – do not forget to specify the time zone for your dataflow.

That’s it! Let’s check out the results of the records pulled from API to Excel sheet?

The imported data does not look very neat. Nevertheless, you can create a separate sheet where the data will be transformed to the format you want and link Excel sheets. Therefore, every time Coupler.io refreshes your data, it will be automatically refreshed on the linked sheet.
Connect API to Excel with Power Query
Power Query is a data transformation engine within Excel. As well, it allows you to query data from different sources including REST APIs. Here is what you need to do to link API to Excel.
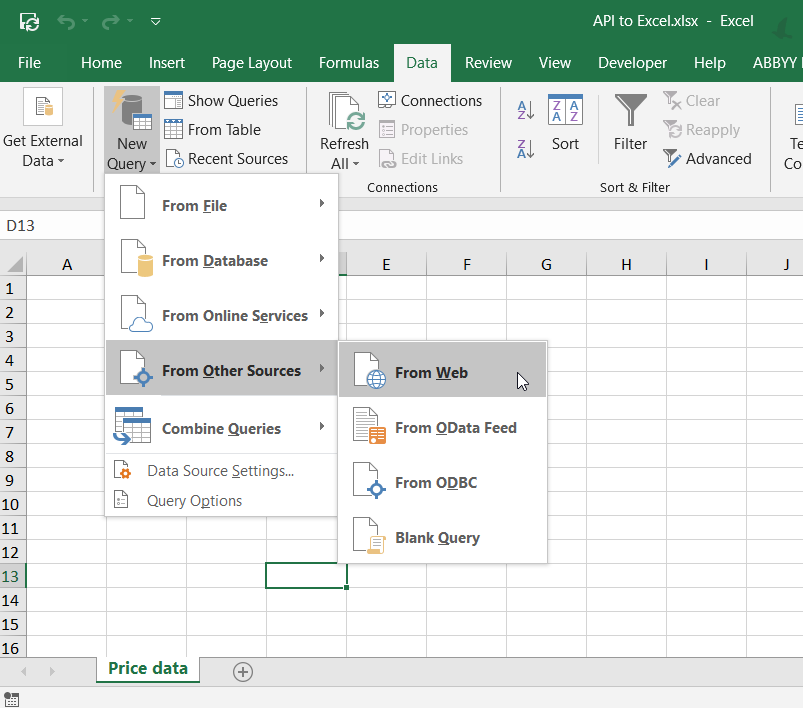
- In your Excel workbook, go to Data => New Query => From Other Sources => From Web.
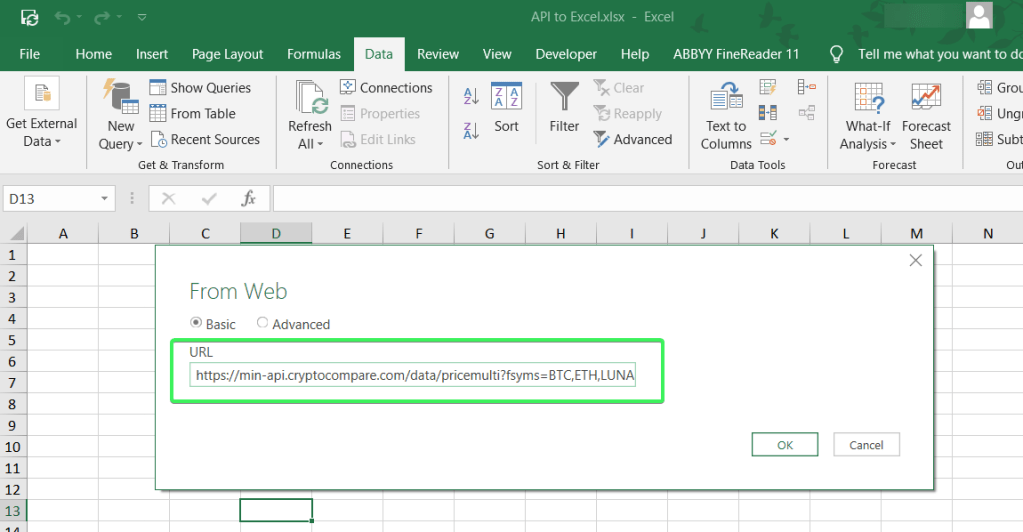
- Insert the API URL and click OK.
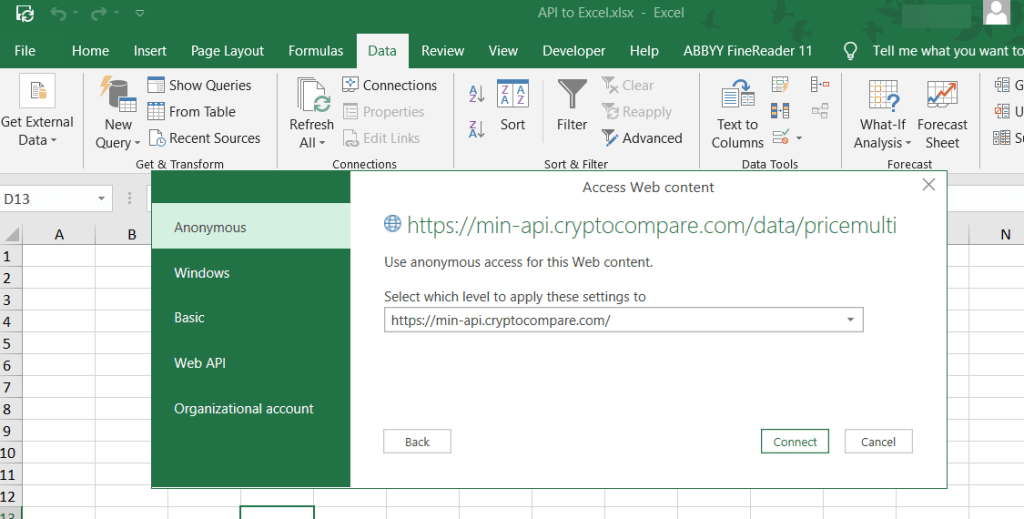
- Choose the web content access. For this example, we can go with Anonymous. Click Connect.
- The Power Query editor will open where you can preview the data loaded from API. Go to the Convert tab and click Into Table.

- This will convert the data from API to a table, and you’ll be able to transform it before loading it to the Excel workbook, for example, transposing rows to columns or vice versa.
- You see that values in the Value column are hidden. The reason is that you need to select which columns to display. For this, click on the Expand button and select the columns. Click OK.

- Now you see two columns: Value.USD and Value.EUR. When all the necessary transformations are done, click Close & Load.

There you go!

You can also check out the details of your connection.

Can you link API to Excel on a schedule with PowerQuery?
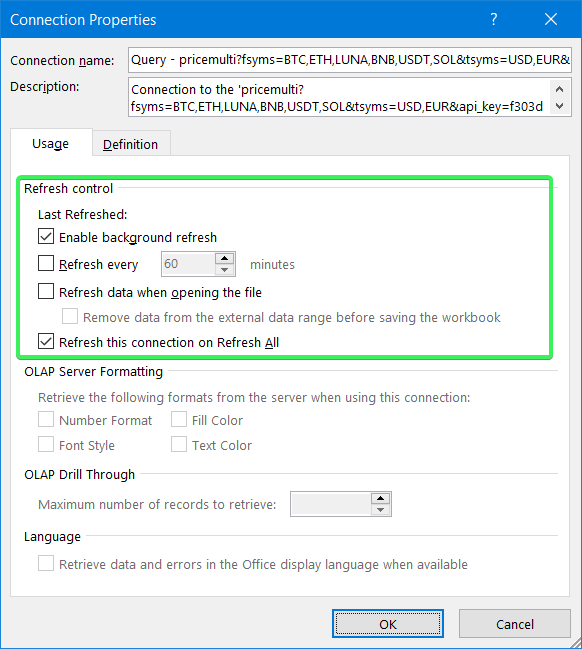
You can refresh data from the API on demand or set up a frequency for the automatic refresh. For this, go to Data => Connections => Properties… and configure the Refresh control.
The Power Query setup looks somewhat intricate because the main purpose of this tool is to transform data. So, it’s better to use Power Query in combination with Coupler.io – your data will go to Excel on a schedule where you can transform it with Power Query as you wish.
How to connect API to Excel using VBA
The answer is very simple – you need to learn VBA and implement your coding knowledge. 🙂 The benefit of a code-based solution is that you can make it custom. This is achievable if you’re proficient in coding and specifically VBA. Alternatively, you can find some templates on GitHub or somewhere else and tweak them. But it is unlikely that you will find a code sample that will cover all your needs.
Which way to connect API to Excel sheet is the best one?
The built-in PowerQuery functionality seems to be the actionable option to link API to Excel. It allows you to grab data and transform it on the go. However, the main drawback of PowerQuery is that it’s only available for the Excel desktop app. If this is not an issue for you, you can go with it.
The no-code way is the choice of many, including Richard. For his needs with low data volume and infrequent data refresh, he can use the Coupler.io Personal plan. In addition to the option of connecting API to Excel sheet, you can benefit from many ready-to-use integrations, as well as other destination apps – Google Sheets and BigQuery. You can try out Coupler.io for free with a 14-day trial.
Who’s going to choose the VBA script to connect API to Excel? This is the way for tech-savvy Excel experts who prefer to create custom functions and integrations for their liking. If you are one of those, then it’s probably your way as well.
-

A content manager at Coupler.io whose key responsibility is to ensure that the readers love our content on the blog. With 5 years of experience as a wordsmith in SaaS, I know how to make texts resonate with readers’ queries✍🏼

Back to Blog
Focus on your business
goals while we take care of your data!
Try Coupler.io
This tutorial is for you if you’re an Excel user who would like to learn how to extend your spreadsheets with data from APIs. You might be one of the people who spend most of their workdays in Excel and do calculations and visualizations but still work manually to import or even just copy and paste data from external sources.
If data is available from an API, however, there are various ways in which can consume it directly from Excel, saving you time and preventing errors.
That is, unfortunately, just as long you are using a Windows PC. The integrations presented in this article do not work in Excel for Mac or the web-based version of the Office apps.
BASF provides the Periodic Table of Elements API, which enables you to query the periodic table and retrieve all kinds of information about chemical elements.
We assume you came here from the Introduction to APIs. If not, please check out that document to learn the basics of APIs before continuing.
The Periodic Table of Elements API follows the CRUD/RESTful paradigm but implements only a subset. Specifically, the periodic table is read-only and allows HTTP GET requests exclusively. It is also limited to one resource called «element».
The base URL for the API is https://dev.api.basf.com/chemical/. Every endpoint starts with this URL.
For the elements, there are two endpoints. The first is a collection endpoint that allows you to either retrieve the full periodic table or request a subset of elements through filter parameters. It is called a collection endpoint because it always returns a collection data structure containing multiple items. The second is an individual resource endpoint that allows you to retrieve a single element.
Both endpoints return JSON-formatted responses.
All BASF APIs require authentication. The Periodic Table of Elements API uses an app-only context with an API key. If you haven’t done so, please read the introduction, terminology, and app-only context sections of the Authentication and Authorization guide. You can skip the part on the app and user context and OAuth as it is not required for this API.
To use authentication, you need to create an account and an application. The process gives you a Client ID, which you can then use as your API key. If you do not have an API key, follow the steps outlined in the Get Started guide. Make sure you select the API product BASF Periodic Table while creating your app.
In Excel for Windows, there are three options for getting external data from an API, which we’ll investigate throughout this article.
The first option is the built-in WEBSERVICE() function. Retrieving data from a URL is a single step. However, extracting the information is rather cumbersome as Excel doesn’t understand JSON responses and you have to use string processing functions. Also, as the function only supports the URL as a parameter, this works only with APIs that allow you to provide authentication information as part of the URL. The BASF Periodic Table of Elements API fits the criteria, as it uses a query string for authentication. For other APIs that require custom headers, though, you’re out of luck.
The second option is using VBA, Visual Basic for Applications, to write a Macro in Basic code to consume an API and fill the sheet programmatically. It is the most powerful and flexible option and should work with all kinds of APIs, but it requires you to have some basic programming knowledge.
The third option is the Power Query builder that allows you to gather and combine data from different sources, including APIs. If you have already used the Power Query builder, for example, to access a database directly, this is the sensible way to do it. It’s also a good choice if you do not want to work with code and the WEBSERVICE() option is too limited.
We’ll use an individual resource endpoint with the WEBSERVICE() function as well as the VBA macro, and we’ll demonstrate the collection endpoint with the Power Query builder.
Before we introduce the WEBSERVICE() function, let’s look at functions in Excel in general. They allow you to fill a table cell with computed data. To enter a function into a cell, you start with the equals sign (=), followed by the function name, a left parenthesis [(], your arguments (if needed), and a right parenthesis [)] to end. If there is more than one argument, you separate them with semicolons (;). A common function that you may have used is SUM(), which adds the data from a number of other cells and returns the result. It takes a range of cells as its argument.
The WEBSERVICE() function also takes one argument, a URL. Then, Excel issues an HTTP GET request to fetch whatever is available at that URL, and puts it into the cell as its result. If we want to do an API requests, since the function only allows a single argument, we have to encode the full API request into the URL. As mentioned before, this rules out APIs that require other HTTP methods (such as POST) or custom headers, e.g., for authorization. With the Periodic Table API, however, we put the API key in the URL and only need the GET method.
Open a new Excel workbook, and enter the following line into a cell, replacing the string APIKEY with the previously generated key:
=WEBSERVICE("https://dev.api.basf.com/chemical/elements/He?x-api-key=APIKEY")
Once you hit Enter or click on another cell, you should see a JSON structure describing the Helium element appear in your cell.

As mentioned before, every API endpoint starts with the base URL. For the Periodic Table API, that is https://dev.api.basf.com/chemical/. Then, the path to a resource or collection endpoint follows. In our example, we retrieved a single element, hence, we used a resource endpoint. Typically, the path to a resource starts with the pluralized resource name, followed by a slash (/) and finally an identifier. If you look at the URL above, you can identify elements/He as this path. The question mark (?) separates the parameter section, and you can see the x-api-key parameter that authenticates the request.
We can separate the base URL and the API key from the URL and build the URL dynamically through string concatenation. That is useful if you have multiple requests in the same Excel sheet and, let’s say, you want to share this sheet with another person who then provides a different API key. The other person then only has to enter their API key in one designated cell instead of modifying your API requests.
As next step, we’ll create a sheet that allows users to modify the base URL and API key in one place. We’ll also apply string processing functions to parse a single field from the JSON response. You can follow along these steps. If something is unclear or doesn’t work for you, you can compare your sheet with the screenshots as well as the full Excel workbook that we’ll provide as download further below.
Here we go:
- Type «Base URL» in A1 and the base URL https://dev.api.basf.com/chemical/ in B1.
- Type «API Key» in A2 and paste your API key from the developer portal in B2.
- Type «Element» as a header in A4 and some elements below it. As an example, we’ll put «H» in A5 and «N» in A6.
- Type «API URL» as a header in B4. To build the URL, concatenate the following elements: a reference to the field containing the base URL, «elements/», a reference to the field containing the element name, «?x-api-key=», and a reference to the field containing the API key. You need to use absolute references to base URL and API key and a relative reference to the element name. Your function call should look like this: =CONCAT($B$1;»elements/»;A5;»?x-api-key=»;$B$2)
- Type «API Response» as a header in C4. Make the webservice call using the URL you built in the previous step by typing =WEBSERVICE(B5) in C5. You should see a JSON API response appear in the cell.
- Type «Atomic Mass» as a header in D4. As there is no JSON parser in Excel, we copy a substring from the API response between the atomic_mass field and the subsequent field, covalent_radius. The whole function looks like this: =MID(C5;SEARCH(«atomic_mass»;C5)+13;SEARCH(«covalent_radius»;C5)-SEARCH(«atomic_mass»;C5)-16) You should now see only the atomic mass as a number in the cell.
- Select the cells B5 to D5, grab the right bottom corner, and drag them down to the B6 to D6. You should see the API URL, API response and atomic mass for the second element appear.
- To get the atomic mass for more elements, add a new element symbol in column A and copy or drag down the three other columns.
Please note that Excel function names are localized along with the Excel user interface. If your Excel installation is in German, replace the names based on this list:
- CONCAT – TEXTKETTE
- MID – TEIL
- SEARCH – SUCHEN

You can get a working Excel workbook in the PeriodicTableWebservice.xlsx file (TODO: add download).
Visual Basic for Applications, or VBA for short, is a powerful programming language that you can use to automate Microsoft Office applications, including Excel. VBA is closely related to, but not fully compatible with, other versions of the Basic language (such as Visual Basic .NET).
If you not worked with VBA before but have programming skills in a different language, you have to learn a new syntax, but should be able to understand the structure of the macro we build in this section.
Our goal is to retrieve various attributes of specific chemical elements (but not the entire periodic table). The sheet layout uses one row per element. The user should enter the element names into the first column of the sheet (A). Then, upon running the macro, it should go through the list of rows and fill the other columns with details. For example, the atomic mass in the second column (B) and the covalent radius in the third column (C).
Open Excel with a new, empty sheet. Then, press the combination Alt and F11 on your keyboard to launch the Visual Basic editor.
On the left side of the editor, you can see the project structure. There’s an entry for your sheet. Double-click on this entry to open the code view where you can enter Basic code that is specific to that sheet.

We start by creating two global string variables, one for the base URL and the API key. It helps us separate them from the code itself so we can swap them if necessary.
Dim baseUrl, apiKey As String
It’s not possible to assign a value to these variables yet. We’ll do that later.
As mentioned under the objective above, we need to retrieve specific elements that the user enters into the sheet, not the full periodic table. For this purpose, we use the API endpoint for specific elements and have to make multiple requests. Hence it is useful to develop an abstraction and put the logic for the API request into a function.
In VBA, you can define functions with the Function keyword. They have parameters with types and a return type. Here is the definition of our getElement() function:
Function getElement(id As String) As Object
Next, we create a script control. That is actually a workaround because there is no native JSON parser available and we don’t want to install a third-party module. The script control can execute JScript, which is a version of JavaScript, and thus understand JSON.
Dim scriptControl As Object
Set scriptControl = CreateObject("MSScriptControl.ScriptControl")
scriptControl.Language = "JScript"
Then, we can make an HTTP request to the API endpoint. VBA makes HTTP requests through the XMLHTTP object. While building the request, we use string concatenation to build the API URL and include the base URL and API key from the variables we defined earlier.
With CreateObject("MSXML2.XMLHTTP")
    .Open "GET", baseUrl + "elements/" + id + "?x-api-key=" + apiKey, False
    .send
Once we have a response, we can parse it with the script control and assign the result to the function name, which is VBA’s way of specifying the returned value for a function:
    Set getElement = scriptControl.Eval("(" + .responsetext + ")")
    .abort
After that, all is left is closing the With-block and the function. The VBA editor might have already generated this code for you automatically.
End With
End Function
Macros are public VBA subroutines. Let’s call ours getPeriodicElementData():
Public Sub getPeriodicElementData()
Inside the subroutine, we first assign some values to our global variables. Add these lines and replace APIKEY with your API key from the developer portal:
baseUrl = [https://dev.api.basf.com/chemical/](https://dev.api.basf.com/chemical/)
apiKey = "APIKEY"
Then, as we want to go through our sheet row by row to get element data, we set up a counter variable:
Dim row As Integer
row = 1
Our algorithm goes through all rows until it stops at an empty row. We can achieve this with a Do-Until-loop:
Do Until IsEmpty(Cells(row, 1))
Inside the loop, we call our getElement() function we created in the previous section. By using a With-block, we can access the attributes of the elements directly and write them in the cells. Our sample code reads two attributes, atomic mass and covalent radius, which go in the row of the current element and the second or third column respectively.
    With getElement(Cells(row, 1))
        Cells(row, 2) = .atomic_mass
        Cells(row, 3) = .covalent_radius
    End With
If you want, you can extend this code with more properties from the element object and put them in additional columns. Tip: Use the WEBSERVICE() function to get the full JSON structure so you can see the available properties.
Afterwards, make sure to increase the row variable, otherwise you have an infinite loop:
row = row + 1
Finally, we close the loop and the subroutine. The VBA editor might have already generated this code for you automatically.
Loop
End Sub
Before we can run the macro, we should add a couple of element symbols in the first column (A) so that the macro has something to do. As an example, use the elements H, S and O. Use one row for each, so that H is in the first, S in the second and O in the third row.
During development, you can run your macro directly from the VBA editor, using either the play button in the toolbar, the Run menu, or the F5 key on your keyboard.

The macro should run and automatically fill the other columns for your three rows.
To re-run your macro later when you’ve closed the VBA editor, follow these steps:
- Open the View ribbon.
- Click on Macros.
- Select the macro and click Run to execute.

The Power Query builder provides access to a variety of data sources. It even enables the combination of data from multiple sources. In this tutorial, though, we’ll just show you the basics to make an API call and display the results in your Excel sheet. We use the collection endpoint to retrieve the complete periodic table.
To get started, go to the Data ribbon, click the Get Data button, choose From Other Sources, and From Web.

In the popup window, enter the URL for the API. You can configure advanced settings such as HTTP headers for your request, but the BASF Periodic Table API doesn’t need any. You have to provide the full URL to the collection endpoint and add the query parameter for authentication directly into the URL. In the following sample, replace APIKEY with the Client ID of your application
https://dev.api.basf.com/chemical/elements?x-api-key=APIKEY
Once you confirm with OK, the Power Query Builder opens and shows the API response. At first, you just see the container element items. Right-click on it and select Drill Down.

Note the list of applied steps on the right side of the window. It shows you everything you did in the query builder and you can undo any step by clicking the X next to it.
Now you see a list of records and you can click on each to see the different attributes of each element. The next step is converting this list into a table and you do this by clicking the To Table button.

A popup with additional options may appear which you can simply confirm with OK. After that, you see the list as a table but it still has just one column that we need to expand into multiple columns so you can see each attribute of the element in its own column. To do so, click the expand icon (<>) in the column header.

In the popup, select the fields that you like or keep all fields intact. You can uncheck «Use original column name as prefix» as the prefix doesn’t provide any value when you’re just working with one data source.
Once you see the data you want in the query builder, your final step is transferring the table into the Excel sheet. You do this with the Close&Load button.

You’re done! Your excel sheet contains the periodic table of elements now.

Congratulations on making it through the tutorial! We hope it deepened your understanding of APIs and how to consume them with Excel. Feel free to contact developer@basf.com with feedback and questions.
Содержание
- Получение и обработка данных с помощью пользовательских функций
- Функции, которые возвращают данные из внешних источников
- Пример получения данных
- Пример XHR
- Создание функции потоковой передачи
- Отмена функции
- Использование параметра вызова
- Получение данных через WebSockets
- Пример WebSockets
- API calls from Excel
- How to make API calls from Excel and transform JSON response to a table.
- API Call from Visual Basic script
- API Call from “New Query”, in “Data” tab
- Connect API to Excel On A Schedule With No Code
- How to use API in Excel – options you have
- How to regularly pull API data into Excel
- Excel API example with Coupler.io
- Source
- Destination
- How to get data from API in Excel recurrently
- Connect API to Excel with Power Query
- Can you link API to Excel on a schedule with PowerQuery?
- How to connect API to Excel using VBA
- Which way to connect API to Excel sheet is the best one?
Получение и обработка данных с помощью пользовательских функций
Одним из способов, которыми пользовательские функции расширяют возможности Excel, является получение данных из расположений, отличных от книги, таких как веб-сайт или сервер (через WebSocket). Вы можете запрашивать внешние данные через API, например Fetch или с помощью XmlHttpRequest (XHR), стандартного веб-API, который отправляет HTTP-запросы для взаимодействия с серверами.
Обратите внимание, что настраиваемые функции доступны в Excel на следующих платформах.
- Office для Windows
- Подписка на Microsoft 365
- Розничный бессрочный Office 2016 и более поздних версий
- Office для Mac
- Office в Интернете
В настоящее время пользовательские функции Excel не поддерживаются в следующих приложениях:
- Office для iPad
- корпоративные бессрочные версии Office 2019 или более ранних версий
- Розничная версия Office 2013 с бессрочным сроком 2013
Функции, которые возвращают данные из внешних источников
Если пользовательская функция извлекает данные из внешнего источника, например, сайта, она должна:
- Возвращает JavaScript Promise в Excel.
- Promise Разрешите с окончательным значением с помощью функции обратного вызова.
Пример получения данных
В следующем примере webRequest кода функция обращается к гипотетическому внешнему API, который отслеживает количество людей, которые в настоящее время находятся на Международной космической станции. Функция возвращает JavaScript Promise и использует fetch для запроса информации из гипотетического API. Полученные данные преобразуются в JSON, names а свойство преобразуется в строку, которая используется для разрешения обещания.
При разработке собственных функций может потребоваться выполнение действия, если веб-запрос не завершается своевременно. Также можно рассмотреть совмещение нескольких запросов API.
При использовании метода fetch не создаются вложенные обратные вызовы, что в некоторых случаях может быть предпочтительнее, чем использование метода XHR.
Пример XHR
В следующем примере кода функция вызывает API GitHub для обнаружения количества звезд, getStarCount предоставленных репозиторию конкретного пользователя. Это асинхронная функция, которая возвращает JavaScript Promise . При получении данных из веб-вызова выполняется разрешение обещания, которое возвращает данные в ячейку.
Создание функции потоковой передачи
Пользовательские функции потоковой передачи позволяют выводить данные в ячейки, которые повторно обновляются, не требуя от пользователя явно что-либо обновлять. Такие функции (например, функция из руководства по пользовательским функциям) могут быть полезны для проверки данных, обновляемых в реальном времени, из веб-службы.
Чтобы объявить функцию потоковой передачи, можно использовать один из следующих двух параметров.
- Тег @streaming .
- Параметр CustomFunctions.StreamingInvocation вызова.
Следующий пример кода — это пользовательская функция, которая добавляет число к результату каждую секунду. Обратите внимание на указанные ниже аспекты этого кода.
- Excel отображает каждое новое значение автоматически с помощью метода setResult .
- Второй параметр ввода, invocation , не отображается для конечных пользователей в Excel, когда они выбирают функцию в меню «Автозаполнение».
- Обратный onCanceled вызов определяет функцию, которая выполняется при отмене функции.
- Потоковая передача не обязательно связана с выполнением веб-запроса. В этом случае функция не выполняет веб-запрос, но по-прежнему получает данные через заданные интервалы, поэтому для нее требуется использовать параметр потоковой передачи invocation .
Пример возврата динамического массива разлива из функции потоковой передачи см. в разделе Возврат нескольких результатов из пользовательской функции: примеры кода.
Отмена функции
Excel отменяет выполнение функции в следующих ситуациях.
- Когда пользователь редактирует или удаляет ячейку, ссылающуюся на функцию.
- Когда изменяется один из аргументов (входных параметров) функции. В этом случае после отмены выполняется новый вызов функции.
- Когда пользователь вручную вызывает пересчет. В этом случае после отмены выполняется новый вызов функции.
Также можно настроить стандартное значение потоковой передачи, чтобы обрабатывать случаи выполнения запроса, когда вы находитесь в автономном режиме.
Существует также категория функций, называемых отменяемыми функциями @cancelable , которые используют тег JSDoc. Отменяемые функции позволяют завершать веб-запрос в середине запроса.
Функция потоковой передачи @cancelable не может использовать тег, но функции потоковой передачи могут включать функцию обратного onCanceled вызова. Только асинхронные пользовательские функции, возвращающие одно значение, могут использовать @cancelable тег JSDoc. Дополнительные сведения о теге см. в @cancelable этой Autogenerate JSON metadata: @cancelable статье.
Использование параметра вызова
Параметр invocation является по умолчанию последним в любой пользовательской функции. Параметр invocation предоставляет контекст ячейки (например, ее адрес и содержимое) и позволяет использовать setResult метод и onCanceled событие, чтобы определить, что функция делает при потоковой передаче ( setResult ) или отмене ( onCanceled ).
При использовании TypeScript требуется обработчик вызовов типа CustomFunctions.StreamingInvocation или CancelableInvocation .
Получение данных через WebSockets
В пределах пользовательской функции можно использовать WebSockets для обмена данными через постоянное соединение с сервером. С помощью WebSocket пользовательская функция может открыть соединение с сервером, а затем автоматически получать сообщения от сервера при возникновении определенных событий без необходимости явного опроса данных на сервере.
Пример WebSockets
Следующий примера кода устанавливает соединение WebSocket, а затем заносит в журнал каждое входящее сообщение от сервера.
Источник
API calls from Excel
How to make API calls from Excel and transform JSON response to a table.
Nobody can deny that Microsoft Excel is still a powerful tool even if you know Python, SQL, Javascript… It provides a super-friendly interface, has many functionalities and is a very popular software.
On the other hand, being able to make API calls and process the response provides a new world of endless possibilities. Nowadays many companies give access to their data via certain endpoints.
Why not put these 2 tools together? In this article we’ll explain how to do it.
There are 2 main ways in Excel to do it:
- Via Visual Basic script
- Via making a “query” from the data menu
API Call from Visual Basic script
The first thing is enable the “developer” menu. This can be done in File → Options → Customize Ribbon:
Once this is done we have to open the VBA editor.
In order to process the JSON response of the API call, we need to add the JsonConverter module, which can be found in the following url: https://github.com/VBA-tools/VBA-JSON/releases, then import JsonConverter.bas into the project. In the VBA Editor, go to File → Import.
Then we also need to import 2 references into the project from the “Tools” menu.
- Microsoft XML, v6.0
- Microsoft Scripting Runtime
Next we have to create a new module to write the code that will make the api call. Here I present 2 examples:
- Get the people from the Star Wars API (https://swapi.dev/).
If you want to save the excel file, remember to use the “xlsm” extension, which allows macros.
API Call from “New Query”, in “Data” tab
Excel 2016 has a built-in feature that allows to make API calls. Previous versions can also make it, but installing the PowerQuery plugin. To make an API call we must go to the “Data” tab and click on “New Query” → “From Other Sources” → “From Web”.
Then we click on “Advanced”. Here we put the url, and if credentials are needed, they can be entered as a header.
Источник
Connect API to Excel On A Schedule With No Code
The instructions provided in this article are sufficient for creating an automated integration. But please note that we are not responsible for the outcome if you use the instructions incorrectly, specify incorrect settings, or if there are changes in the app’s API. If you need help with the setup, we can offer this premium integration at an additional fee.
An API is a ‘bridge‘ through which one app obtains/sends information from/to another app. This means that you can load miscellaneous data from your source app to your Excel workbook using the REST API. Moreover, you can even schedule data loads via the API to Excel sheet without any VBA coding! Read our guide to learn how you can do this.
How to use API in Excel – options you have
Basically, you have three options to link API to Excel:
- Power Query: You can query data from APIs using Excel’s built-in tool.
- Coupler.io: This third-party importer will let you automate data exports via APIs to Excel on a custom schedule.
- VBA: This is a code-based option that is suitable for tech-savvy Excel users.
Let’s check out each option in action so that you can make the best choice for your needs. For this, we asked Richard, a cryptocurrency enthusiast, to help us.
Richard wants to analyze the growth tendency of the top crypto coins. To do this, he needs to load data from CryptoCompare using their JSON API.
For testing, Richard will use the following API URL that will load data about the price for five cryptocoins: Bitcoin, Ethereum, Terra, Binance Coin, and Tether.
Note: This API requires authorization, so Richard has already generated a free API key.
So, let’s start with the option that allows you to schedule exports via API to Excel.
How to regularly pull API data into Excel
For scheduled exports of data from API to Microsoft Excel, Richard will use Coupler.io. It’s a solution that allows you to connect to multiple sources and load data from them to Excel, Google Sheets, or BigQuery. You can export data on demand and automate import on a custom schedule, such as every day or every hour.
For Richard’s case, we’ll use the JSON integration with Excel. Let’s see how it works.
Excel API example with Coupler.io
Sign up to Coupler.io with your Microsoft account. Click Add new importer – this is a boilerplate to set up your connection to API. Choose JSON as a source application and Microsoft Excel as the destination application. Then complete the following steps to load data from API to Excel sheet.
Source
- Insert the API URL to the JSON URL field. Click Continue.
Note: You’ve noticed that this API URL differs from the one mentioned in the beginning. It lacks attached query strings because Coupler.io provides separate fields to specify request headers and URL query parameters. So, Richard will use those to demonstrate how they work.
Other fields, Request body, Columns, and Path are optional. You can learn more about them in the Coupler.io Help Center.
Note: You can find information about the parameters used in those fields in the API documentation of your application. Pay attention to the information about API authentication and details of API endpoints – these are usually located in separate sections.
Now you’re ready to Jump to the Destination Settings.
Destination
- Select a workbook on OneDrive and a worksheet where the data will be loaded. You can select an existing Excel worksheet or create a new one. Click Continue.
Note: Optionally, you can change the first cell for your imported data range, change the import mode, and add a column that contains the date and time of the last update.
Clicking on Save and Run loads the data from API to Excel right away. But Richard needs to automate this export on a recurring basis, so he needs to complete another step.
How to get data from API in Excel recurrently
You can configure the schedule for your JSON importer during the initial setup or at any other time. For this, you need to toggle on the Automatic data refresh and configure the frequency:
- Interval – from every month to every 15 minutes.
- Days of week – select the days you want to have the importer run.
- Time preferences – select the time when you want to have your data importer from the API.
- Schedule time zone – do not forget to specify the time zone for your dataflow.
That’s it! Let’s check out the results of the records pulled from API to Excel sheet?
The imported data does not look very neat. Nevertheless, you can create a separate sheet where the data will be transformed to the format you want and link Excel sheets. Therefore, every time Coupler.io refreshes your data, it will be automatically refreshed on the linked sheet.
Connect API to Excel with Power Query
Power Query is a data transformation engine within Excel. As well, it allows you to query data from different sources including REST APIs. Here is what you need to do to link API to Excel.
- In your Excel workbook, go to Data =>New Query =>From Other Sources =>From Web.
- Insert the API URL and click OK.
- Choose the web content access. For this example, we can go with Anonymous. Click Connect.
- The Power Query editor will open where you can preview the data loaded from API. Go to the Convert tab and click Into Table.
- This will convert the data from API to a table, and you’ll be able to transform it before loading it to the Excel workbook, for example, transposing rows to columns or vice versa.
- You see that values in the Value column are hidden. The reason is that you need to select which columns to display. For this, click on the Expand button and select the columns. Click OK.
- Now you see two columns: Value.USD and Value.EUR. When all the necessary transformations are done, click Close & Load.
You can also check out the details of your connection.
Can you link API to Excel on a schedule with PowerQuery?
You can refresh data from the API on demand or set up a frequency for the automatic refresh. For this, go to Data => Connections => Properties… and configure the Refresh control.
The Power Query setup looks somewhat intricate because the main purpose of this tool is to transform data. So, it’s better to use Power Query in combination with Coupler.io – your data will go to Excel on a schedule where you can transform it with Power Query as you wish.
How to connect API to Excel using VBA
The answer is very simple – you need to learn VBA and implement your coding knowledge. 🙂 The benefit of a code-based solution is that you can make it custom. This is achievable if you’re proficient in coding and specifically VBA. Alternatively, you can find some templates on GitHub or somewhere else and tweak them. But it is unlikely that you will find a code sample that will cover all your needs.
Which way to connect API to Excel sheet is the best one?
The built-in PowerQuery functionality seems to be the actionable option to link API to Excel. It allows you to grab data and transform it on the go. However, the main drawback of PowerQuery is that it’s only available for the Excel desktop app. If this is not an issue for you, you can go with it.
The no-code way is the choice of many, including Richard. For his needs with low data volume and infrequent data refresh, he can use the Coupler.io Personal plan. In addition to the option of connecting API to Excel sheet, you can benefit from many ready-to-use integrations, as well as other destination apps – Google Sheets and BigQuery. You can try out Coupler.io for free with a 14-day trial.
Who’s going to choose the VBA script to connect API to Excel? This is the way for tech-savvy Excel experts who prefer to create custom functions and integrations for their liking. If you are one of those, then it’s probably your way as well.
Источник
In this post I’ll show you how to hack into tons of top secret government data using Excel.
Ok, by “top secret“, I actually mean a database API made publicly available.
And by “hack into“, I actually mean use Excel’s From Web Power Query functionality to access the API.
Governments have a lot of data covering agriculture to renewable energy, and the cool thing is anyone can access it and they provide it all for free with an API. Data is always a valuable resource to have at hand when you’re trying to learn Excel too, so learning how to fish for your own data is definitely worthwhile.
Video Tutorial
Get Your API Key
This API requires an API Key. This is just like a password that allows you to use the API.
The key is free, but you do have to sign up for it. Go here https://api.data.gov/signup/ and fill in your details and press the Signup button.
After signing up, you should receive an email fairly shortly. Take note of the API key it contains as we will be using it later to access the API.
There are tons of different API’s you can explore on your own once you have your key and know how to use it. You can find them all from this page here https://api.data.gov/.
Alternative Fuel Station API
In this post we’ll be exploring this API https://developer.nrel.gov/docs/transportation/alt-fuel-stations-v1/nearest/ which return a list of the nearest alternative fuel station from a given location.
https://developer.nrel.gov/api/alt-fuel-stations/v1/nearest.json?api_key=XXXXXXXXX&location=Denver+CO
Let’s try out our example web request from the email with our API key. Copy this URL from the email and paste it into the address bar of any browser (I’m using Chrome) then press enter.
Notice the &location=Denver+CO at the end of the URL. This means the API will return a list of stations near Denver Colorado. In fact, you can pass many other parameters to the API by appending them to the URL in a similar fashion. All the possible parameters are nicely documented on the government website. We’ll try some of these out later.
After submitting this request URL it will return a whole bunch of data. The output might not be that readable to you if you’ve never seen JSON before.
JSON Data Output
The output of this API is in a JSON format. JSON stands for JavaScript Object Notation and it’s a syntax for storing and exchanging hierarchical data.
[
    {
        "Name": "Joe Smith",
        "Address": {
            "Street Number": 123,
            "Street Name": "Fake Street",
            "Post Code": "H0H 0H0"
        },
        "Email": {
            "Work": "Joe@myworkemail.com,
            "Personal": "Joe@mypersonalemail.com"
        }
    }
]
Above is a simple example of a JSON data object for a person’s contact information. This object is actually an array of 3 objects (name, address and email). The address and email objects themselves are also arrays of objects. The address contains a street name, number and postal code and the email contains a work and personal email.
The cool thing is Power Query has JSON parsing functionality built in. We can easily turn something like this into a more familiar and readable table in just a few clicks, so we won’t need to try and decipher our API’s output on our own.
Creating an API URL
Just for fun, I’m going to get a bit fancy with some of the parameters available in the API to find 5 electric fuel stations that are currently open to the public and nearest to Toronto, Ontario in Canada. For this, I’ll use the following parameters and values.
- location=Toronto+ON This means station is located near Toronto Ontario.
- status=E This means the station is open and carries alternative fuel.
- access=public This means the station is open to the public.
- fuel_type=ELEC This means the station provides electric fuel.
- country=CA This means the station is in Canada.
- limit=5 This parameter will limit the results to the 5 nearest.
https://developer.nrel.gov/api/alt-fuel-stations/v1/nearest.json?api_key=XXXXXXXXX&location=Toronto+ON&status=E&access=public&fuel_type=ELEC&country=CA&limit=5
Combining all these parameters into the proper API request URL format results in the above URL. Now we’re ready to use this in Excel.
Calling the API from Excel
Now that we’ve seen the API in use from the browser and have created a fancier URL to call, let’s use a From Web power query to call it in Excel.
Go to the Data tab in the ribbon and select From Web under the Get & Transform Data section.
This can also be found under Get Data in the From Other Sources menu.
We only need to use the Basic query so you can pop your URL into the field and press the OK button. We can go with the default settings in the next pop up so just press the Connect button.
When the query editor opens, we can see that Excel has recognized the output as JSON and applied the JSON.Document parsing to the result.
We see the meta data from the results of the API, this is the data about the resulting data such as the total number of records matching our query parameters (even though we’ve limited the results to 5 of these).
Notice the fuel_station contains a List. Left click on this list to expand and show the items in the list.
When you expand the list it will show 5 records since we limited the query to 5 results. We want to turn this list of records into a proper table. Right click on the list and select the To Table option from the menu. You can also select To Table from the Transform tab of the editor.
Select None under the Select or enter delimiter option and press the OK button.
Now that we have converted our output to a table, we can expand the records. Left click on the column heading filter toggle.
Select the columns you want to appear in the final output. You can also uncheck the column heading prefix option if desired. Then press the OK button.
Awesome! We now have our data from the API in a familiar table format. Just Close & Load the query from the Home tab of the editor and we’re good to go!
About the Author
John is a Microsoft MVP and qualified actuary with over 15 years of experience. He has worked in a variety of industries, including insurance, ad tech, and most recently Power Platform consulting. He is a keen problem solver and has a passion for using technology to make businesses more efficient.