What is a pivot table and how to create it in Pandas? Pandas pivot_table() function is used to make a spreadsheet-style pivot table from a given DataFrame. Using a pivot table we can analyze the data very quickly and it can give more flexibility to make an excel sheet form of a given DataFrame. It can be aggregated in a numeric column as a cross-tabulation against two categorical columns.
In this article, I will explain how to create pivot tables in pandas and understand their syntax and parameters with examples. Creating a pivot table is a process of grouping, summarising, aggregating, and calculating statistics about the specified data in a DataFrame.
1. Quick Examples of Pandas Pivot Table
If you are in hurry below are some quick examples of pandas pivot table.
# Below are quick examples.
# Example 1 : # Create a pivot table using index
p_table = pd.pivot_table(df, index=['Gender'])

# Example 2 : Create a pivot table using multiple index
p_table = pd.pivot_table(df, index=['Gender', 'Category'])

# Example 3 : Create pivot table using multiple aggfunc
p_table = pd.pivot_table(df, index=['Gender'], aggfunc= {'Fee': 'mean', 'Discount': 'sum'})

# Example 4 : Create table using value parameter
p_table = pd.pivot_table(df, index = ['Gender'], values = ['Discount'], aggfunc = 'mean' )

# Example 5 : Create table using column parameter
p_table = pd.pivot_table(df, index= ['Gender'], columns = ['Fee'], values=['Discount'], aggfunc = 'mean' )

# Example 6 : Fill the NaN value using fill_value
p_table = pd.pivot_table(df, index= ['Gender'], columns = ['Fee'], values=['Discount'], aggfunc = 'mean', fill_value = 0 )
2. Syntax of Pandas Pivot Table
Following is the syntax of the Pandas.pivot_table().
# Syntax of Pandas pivot table.
pandas.pivot_table(data, values=None, index=None, columns=None, aggfunc=’mean’, fill_value=None, margins=False, dropna=True, margins_name=’All’, observed=False)

# Another Syntax
DataFrame.pivot(index=None, columns=None, values=None)
2.1 Parameters of the pivot Table
Data: DataFrame, whose dataset is turned into pivot table.values: This is an optional parm. Column to aggregate.index :column, Grouper, array, or list of the previous. Index is the feature that provides you to group the data. The index feature appears as an index in the resultant table.columns :column, Grouper, array, or list of the previous. Column, it is used for aggregating the values according to specific features.observed bool, (default False) :This parameter is only applicable for categorical features. If it is set to ‘True’ then the table will show values only for categorical groups.aggfunc: It is an aggregation function and we can set this param with a list of functions, dict, default is numpy.mean. If it is set to a list of functions, the resulting pivot table forms a hierarchical column and this list of functions will be a top-level column. If it is set to dictionary the key is a column to aggregate and the value is a function or list of functions.fill_value: It is scalar or None. Value to replace missing values with (in the resulting pivot table, after aggregation).dropna :Do not include columns whose entries are all NaN.
2.2 Return Value
It returns a DataFrame as an Excel-style pivot table.
3. Create Pandas DataFrame
Python pandas is widely used for data science/data analysis and machine learning applications. It is built on top of another popular package named Numpy, which provides scientific computing in Python. pandas DataFrame is a 2-dimensional labeled data structure with rows and columns (columns of potentially different types like integers, strings, float, None, Python objects e.t.c). You can think of it as an excel spreadsheet or SQL table.
Pandas create DataFrame from Python dictionary in which keys are 'Courses', 'Fee', and 'Discount‘, and values are taken as a list of corresponding key values. Let’s create,
import pandas as pd
# Create a DataFrame
df = pd.DataFrame({'Student Names' : ['Jenny', 'Singh', 'Charles', 'Richard', 'Veena'],
                   'Category' : ['Online', 'Offline', 'Offline', 'Offline', 'Online'],
                   'Gender' : ['Female', 'Male', 'Male', 'Male', 'Female'],
                  'Courses': ['Java', 'Spark', 'PySpark','Hadoop','C'],
                   'Fee': [15000, 17000, 27000, 29000, 12000],
                   'Discount': [1100, 800, 1000, 1600, 600]})
print(df)
Yields below output.
# Output
  Student Names  Category  Gender  Courses    Fee  Discount
0         Jenny   Online  Female     Java  15000      1100
1         Singh  Offline    Male    Spark  17000       800
2       Charles  Offline    Male  PySpark  27000      1000
3       Richard  Offline    Male   Hadoop  29000      1600
4         Veena  Online  Female        C  12000       600
4. Create Pandas Pivot Table
4.1 Group the Data into Pivot Table using Index Param
Using the Pandas pivot_table() function we can reshape the DataFrame in the form of an Excel pivot table in the simplest way. To group the data in a pivot table we will need to pass a DataFrame into this function and the column you wanted to group as an index. In the below example, I am using 'Gender' column as an index.
# Create a pivot table using index
p_table = pd.pivot_table(df, index=['Gender'])
print(p_table)
Yields below output. Note that by default pivot_table() groups on specified columns and performs the aggregation on all numeric columns. In our example DataFrame, we have Discount and Fee are numeric columns.
# Output
          Discount           Fee
Gender
Female   850.000000  13500.000000
Male    1133.333333  24333.333333
Here, we have made a basic pivot table in pandas.
5. Create Pivot Table Using Multiple Index
Using the list of features as an index to group the data. This will give more comfort to finding data in the resultant table.
# Create a pivot table using multiple index
p_table = pd.pivot_table(df, index=['Gender', 'Category'])
print(p_table)
Yields below output
# Output
                   Discount           Fee
Gender Category
Female Online     850.000000  13500.000000
Male   Offline   1133.333333  24333.333333
6. Use Multiple Aggregation functions
Aggregate function aggfunc param takes np.mean() function as a default function for grouping the data. The values in the pivot table are the result of the summarization that aggfunc applies to the feature data.
We can use different aggregate functions, as I mentioned above if it is set to the dictionary, where the keys are aggregated to columns and values are functions or lists of functions. For example,
Here, I have taken np.mean() and np.sum() as a aggfunc functions.
# Create pivot table using multiple aggfunc
p_table = pd.pivot_table(df, index=['Gender'], aggfunc= {'Fee': 'mean', 'Discount': 'sum'})
print(p_table)
Yields below output.
# Output
         Discount           Fee
Gender
Female      1700  13500.000000
Male        3400  24333.333333
7. Create Pandas Pivot Table with Values Parameter
The value parameter is used to specify an aggregated column. When not specify this parameter, the function will aggregate all the numerical columns of the dataset (as shown above). The below example selects the columns you wanted on the result.
# Create table using value parameter
p_table = pd.pivot_table(df, index = ['Gender'], values = ['Discount'], aggfunc = 'mean' )
print(p_table)
Yields below output.
# Output
            Discount
Gender
Female   850.000000
Male    1133.333333
8. Create Pandas Pivot Table Using Column Param
As we can see from the above we have used multiple features as indexes, but using features as the column is given a better understanding of the resultant table than using features as an index.
# Create table using column parameter
p_table = pd.pivot_table(df, index= ['Gender'], columns = ['Fee'], values=['Discount'], aggfunc = 'mean' )
print(p_table)
Yields below output.
# Output
          Discount
Fee       12000   15000  17000   27000   29000
Gender
Female    600.0  1100.0    NaN     NaN     NaN
Male        NaN     NaN  800.0  1000.0  1600.0
9. Fill the Missing Data in Pandas Pivot Table
Using the fill_value parameter we can fill the Nan values with the specific value provided by the user in a pivot table. It defines scalar or None.
# Fill the NaN value using fill_value
p_table = pd.pivot_table(df, index= ['Gender'], columns = ['Fee'], values=['Discount'], aggfunc = 'mean', fill_value = 0 )
print(p_table)
Yields below output.
# Output
       Discount
Fee       12000 15000 17000 27000 29000
Gender
Female      600  1100     0     0     0
Male          0     0   800  1000  1600
10. Conclusion
In this article, I have explained Pandas pivot_table() function and using this how to create a pivot table in the form of excel sheets with well-explained examples.
Related Articles
- How to Unpivot DataFrame in Pandas?
- Drop Rows From Pandas DataFrame Examples
- Drop Single & Multiple Columns From Pandas DataFrame
- Change the Order of Pandas DataFrame Columns
- Pandas groupby() and sum() With Examples
- Difference Between loc and iloc in Pandas DataFrame
- How to Create Pandas Pivot Table Count
- How to Create Pandas Pivot Multiple Columns
References
- https://pandas.pydata.org/docs/reference/api/pandas.pivot_table.html
Data Analysis forms a crucial part of gaining valuable insights from your customers. Multiple organizations are trying innovative ways to simplify the process of Data Analysis. Some are trying to completely automate this process whereas others are using multiple tools to set up the same. Another innovative technique used by companies to perform Data Analysis is linking their data source with a programming language and having it automate their Data Analysis. One such type of automation is Python Excel Automation.
Python is the most popularly used programming language today and has limitless applications across many fields. Its flexible and dynamic capabilities make it the ideal choice when it comes to deployment and maintenance. MS Excel is one of the popular Microsoft applications that operate in the form of a spreadsheet and is used to save and analyze numerical data. It was one of the first tools used by companies all around the world to analyze data to gain insights. It is also termed a traditional BI (Business Intelligence) tool. By setting up Python Excel Automation, you can transfer data automatically from various sources to multiple destinations seamlessly.
This article provides a step-by-step guide to help you set up Python Excel Automation. It also gives you an overview of Python and Excel to better understand these technologies individually. Read along to find out how you can set up Python Excel Automation for your organization.
Table of Contents
- Prerequisites
- Introduction to Python
- Introduction to MS Excel
- Steps to Set Up Python Excel Automation
- Step 1: Analyzing the Excel Dataset
- Step 2: Making Pivot Tables using Pandas
- Step 3: Designing the Reports using Openpyxl
- Step 4: Automating the Report with Python
- Step 5: Scheduling the Python Script
- Conclusion
Prerequisites
- Working knowledge of MS Excel.
- Strong Technical Foundation in Python.
- Knowledge of popular Python Libraries.
Introduction to Python
Python is a high-level programming language that uses an interpreter to process code. It was developed by Guido Von Rossum and was released in 1991. Its seamless code readability and dynamic nature make it an excellent choice when coding. It is used in a wide variety of fields including Machine Learning, Artificial Intelligence, Server-Side Scripting, Data Analytics, and Deep Learning. It was developed by Python Software Foundation and its stable release was on 3 May 2021.
Python is an Interactive, Interpreted, Object-Oriented programming language that incorporates multiple attributes like Exceptions, Modules, Dynamic Typing, Dynamic Binding, Classes, High-level Dynamic Data Types, etc. It can also be used to make system calls to almost all well-known Operating Systems.
Key Features of Python
Python houses a wide range of features that differentiates it from other programming languages. Some of those features are given below:
- It is free and open-source. You can download Python from their official website. It can be downloaded and installed easily. As Python is open-source, users that have a good technical background can make changes to the code as per business use cases and product requirements.
- Python is a beginner-friendly language and hence, most people with basic programming knowledge can easily learn the Python syntax and start coding on it.
- While using Python, developers do not need to have any information on the System Architecture or manage memory usage manually. The Python Interpreter handles this automatically.
- Python is highly robust and portable. This means that the Python code written on one computer can easily be transferred to another system and can run without any issues.
- Python also supports Object-Oriented Programming that allows users to write readable and reusable code.
With Python Excel Automation, you can use the portable and robust nature of Python in tandem with Excel to improve your Data Analysis efficiently.
Introduction to MS Excel
Microsoft Excel is a spreadsheet program developed by Microsoft for Windows, macOS, Android, and iOS. It was released in 1987 and has been used by multiple calculations, graphic tools, pivot tables, and a macro programming language like Visual Basic for Applications. MS Excel has gained popularity over these years because the data is easy to save and data can be added or removed without any discomfort.
Key Features of MS Excel
MS Excel has many unique features that make it a good choice over other spreadsheet software. Some of those features are given below:
- MS Excel allows you to create headers and footers in the spreadsheet document and allows users to protect their data by providing passwords for their data.
- It supports filtering where you can find the required data in your workbook and replace it with the value you need.
- MS Excel supports Data Sorting, thereby allowing you to sort your data in ascending or descending order.
- It supports multiple variations of formulae, so you can perform all types of calculations easily. It also supports multiple types of Data Visualization and charts.
- You can perform Formula Auditing to form relationships between cells and tables.
With Python Excel Automation, you can use the sorting and robust nature of MS Excel with a powerful programming language like Python to automate reporting seamlessly.
To learn more about MS Excel, click this link.
Hevo Data, a No-code Data Pipeline helps to load data from any data source such as Databases, SaaS applications, Cloud Storage, SDK,s, and Streaming Services and simplifies the ETL process. It supports MS Excel and Python, along with 150+ data sources (including 30+ free data sources), and is a 3-step process by just selecting the data source, providing valid credentials, and choosing the destination. Hevo not only loads the data onto the desired Data Warehouse/destination but also enriches the data and transforms it into an analysis-ready form without having to write a single line of code.
Its completely automated pipeline offers data to be delivered in real-time without any loss from source to destination. Its fault-tolerant and scalable architecture ensures that the data is handled in a secure, consistent manner with zero data loss and supports different forms of data. The solutions provided are consistent and work with different BI tools as well.
Check out why Hevo is the Best:
- Secure: Hevo has a fault-tolerant architecture that ensures that the data is handled in a secure, consistent manner with zero data loss.
- Schema Management: Hevo takes away the tedious task of schema management & automatically detects the schema of incoming data and maps it to the destination schema.
- Minimal Learning: Hevo, with its simple and interactive UI, is extremely simple for new customers to work on and perform operations.
- Hevo Is Built To Scale: As the number of sources and the volume of your data grows, Hevo scales horizontally, handling millions of records per minute with very little latency.
- Incremental Data Load: Hevo allows the transfer of data that has been modified in real-time. This ensures efficient utilization of bandwidth on both ends.
- Live Support: The Hevo team is available round the clock to extend exceptional support to its customers through chat, email, and support calls.
- Live Monitoring: Hevo allows you to monitor the data flow and check where your data is at a particular point in time.
Simplify your Python Data Analysis with Hevo today! Sign up here for a 14-day free trial!
Now that you have a good understanding of Python and MS Excel, it is now time to understand the steps to set up Python Excel Automation. You can follow the below steps to set Python Excel Automation up:
- Step 1: Analyzing the Excel Dataset
- Step 2: Making Pivot Tables using Pandas
- Step 3: Designing the Reports using Openpyxl
- Step 4: Automating the Report with Python
- Step 5: Scheduling the Python Script
Step 1: Analyzing the Excel Dataset
The first step in Python Excel Automation is to analyze the Dataset. The Dataset used in this tutorial is a Sales Dataset. This Dataset is also available on Kaggle. As this Dataset is in .csv format, you need to change it to .xslx format. The data will be used to create the below report after setting up our Python Excel Automation.
Step 2: Making Pivot Tables using Pandas
The next step in Python Excel Automation is to design Pivot Tables. Before doing that, you need to import the following libraries:
import pandas as pd
import openpyxl
from openpyxl import load_workbook
from openpyxl.styles import Font
from openpyxl.chart import BarChart, Reference
import string
Pandas is used to read the Excel file, create the Pivot table and export it to Excel. You can then use the Openpyxl library in Python to write Excel formulas, make charts and spreadsheets in Python.
To read your Excel file, make sure that the file is in the same place where your Python script is located and run the following code in Excel:
excel_file = pd.read_excel('supermarket_sales.xlsx')
excel_file[['Gender', 'Product line', 'Total']]
To create the pivot table, you need to access the excel_file data frame that you created previously. You can use the “.pivot_table()” to create the table. If you want to create a pivot table to show the total money split up for males and females you can run the below code:
report_table = excel_file.pivot_table(index='Gender',columns='Product line',values='Total',aggfunc='sum').round(0)Finally, to export the Pivot Table, we will use the “.to_excel()” method as shown below:
report_table.to_excel('report_2021.xlsx',sheet_name='Report',startrow=4)The Excel folder is now exported in the same location as your Python scripts.
Step 3: Designing the Reports using Openpyxl
The next step in Python Excel Automation is to design the reports. To make the report, you need to use the “load_workbook” method, that is imported from Openpyxl and save it using the “.save()” method. This is shown below:
wb = load_workbook('report_2021.xlsx')
sheet = wb['Report']
# cell references (original spreadsheet)
min_column = wb.active.min_column
max_column = wb.active.max_column
min_row = wb.active.min_row
max_row = wb.active.max_row
Python Excel Automation allows you to create Excel charts using Pivot Tables. To create an Excel chart using a Pivot Table, you need to use the Barchart Module and to identify the position of the data and category values, you can use the Reference Module. Both of these were imported before in Step 1. You can write Excel-based formulas in Python, the same way you write them in Excel. An example of this is shown below:
sheet['B7'] = '=SUM(B5:B6)'
sheet['B7'].style = 'Currency
Step 4: Automating the Report with Python
The next step in Python Excel Automation is to automate your report. You can write all the code into one function so that it will be easy to automate the report. That code is shown below:
import pandas as pd
import openpyxl
from openpyxl import load_workbook
from openpyxl.styles import Font
from openpyxl.chart import BarChart, Reference
import string

def automate_excel(file_name):
   """The file name should have the following structure: sales_month.xlsx"""
   # read excel file
   excel_file = pd.read_excel(file_name)
   # make pivot table
   report_table = excel_file.pivot_table(index='Gender', columns='Product line', values='Total', aggfunc='sum').round(0)
   # splitting the month and extension from the file name
   month_and_extension = file_name.split('_')[1]
   # send the report table to excel file
   report_table.to_excel(f'report_{month_and_extension}', sheet_name='Report', startrow=4)
   # loading workbook and selecting sheet
   wb = load_workbook(f'report_{month_and_extension}')
   sheet = wb['Report']
   # cell references (original spreadsheet)
   min_column = wb.active.min_column
   max_column = wb.active.max_column
   min_row = wb.active.min_row
   max_row = wb.active.max_row
   # adding a chart
   barchart = BarChart()
   data = Reference(sheet, min_col=min_column+1, max_col=max_column, min_row=min_row, max_row=max_row) #including headers
   categories = Reference(sheet, min_col=min_column, max_col=min_column, min_row=min_row+1, max_row=max_row) #not including headers
   barchart.add_data(data, titles_from_data=True)
   barchart.set_categories(categories)
   sheet.add_chart(barchart, "B12") #location chart
   barchart.title = 'Sales by Product line'
   barchart.style = 2 #choose the chart style
   # applying formulas
   # first create alphabet list as references for cells
   alphabet = list(string.ascii_uppercase)
   excel_alphabet = alphabet[0:max_column] #note: Python lists start on 0 -> A=0, B=1, C=2. #note2 the [a:b] takes b-a elements
   # sum in columns B-G
   for i in excel_alphabet:
       if i!='A':
           sheet[f'{i}{max_row+1}'] = f'=SUM({i}{min_row+1}:{i}{max_row})'
           sheet[f'{i}{max_row+1}'].style = 'Currency'
   sheet[f'{excel_alphabet[0]}{max_row+1}'] = 'Total'
   # getting month name
   month_name = month_and_extension.split('.')[0]
   # formatting the report
   sheet['A1'] = 'Sales Report'
   sheet['A2'] = month_name.title()
   sheet['A1'].font = Font('Arial', bold=True, size=20)
   sheet['A2'].font = Font('Arial', bold=True, size=10)
   wb.save(f'report_{month_and_extension}')
   return
Step 5: Scheduling the Python Script
The final step in Python Excel Automation is to run the Python script at different schedules as per data requirements. You just need to use the task scheduler or cron on Windows and Mac respectively.
That’s it! You have successfully set up Python Excel Automation in 5 easy steps!
Conclusion
This article gave you a step-by-step guide on setting up Python Excel Automation. It also gave you an overview of both Python and MS Excel along with their features. Overall, Python Excel Automation is an innovative process that you can use to create visual reports on Python just the same way as you would on Excel seamlessly. Organizations can leverage Python Excel Automation to leverage their business tasks according to their needs.
In case you want to integrate data from data sources like Python and MS Excel into your desired Database/destination and seamlessly visualize it in a BI tool of your choice, then Hevo Data is the right choice for you! It will help simplify the ETL and management process of both the data sources and destinations.
Want to take Hevo for a spin? Sign up here for a 14-day free trial and experience the feature-rich Hevo suite first hand.
Share your experience of setting up Python Excel Automation in the comments section below.
Время на прочтение
5 мин
Количество просмотров 63K
Excel — это чрезвычайно распространённый инструмент для анализа данных. С ним легко научиться работать, есть он практически на каждом компьютере, а тот, кто его освоил, может с его помощью решать довольно сложные задачи. Python часто считают инструментом, возможности которого практически безграничны, но который освоить сложнее, чем Excel. Автор материала, перевод которого мы сегодня публикуем, хочет рассказать о решении с помощью Python трёх задач, которые обычно решают в Excel. Эта статья представляет собой нечто вроде введения в Python для тех, кто хорошо знает Excel.

Загрузка данных
Начнём с импорта Python-библиотеки pandas и с загрузки в датафреймы данных, которые хранятся на листах sales и states книги Excel. Такие же имена мы дадим и соответствующим датафреймам.
import pandas as pd
sales = pd.read_excel('https://github.com/datagy/mediumdata/raw/master/pythonexcel.xlsx', sheet_name = 'sales')
states = pd.read_excel('https://github.com/datagy/mediumdata/raw/master/pythonexcel.xlsx', sheet_name = 'states')
Теперь воспользуемся методом .head() датафрейма sales для того чтобы вывести элементы, находящиеся в начале датафрейма:
print(sales.head())
Сравним то, что будет выведено, с тем, что можно видеть в Excel.
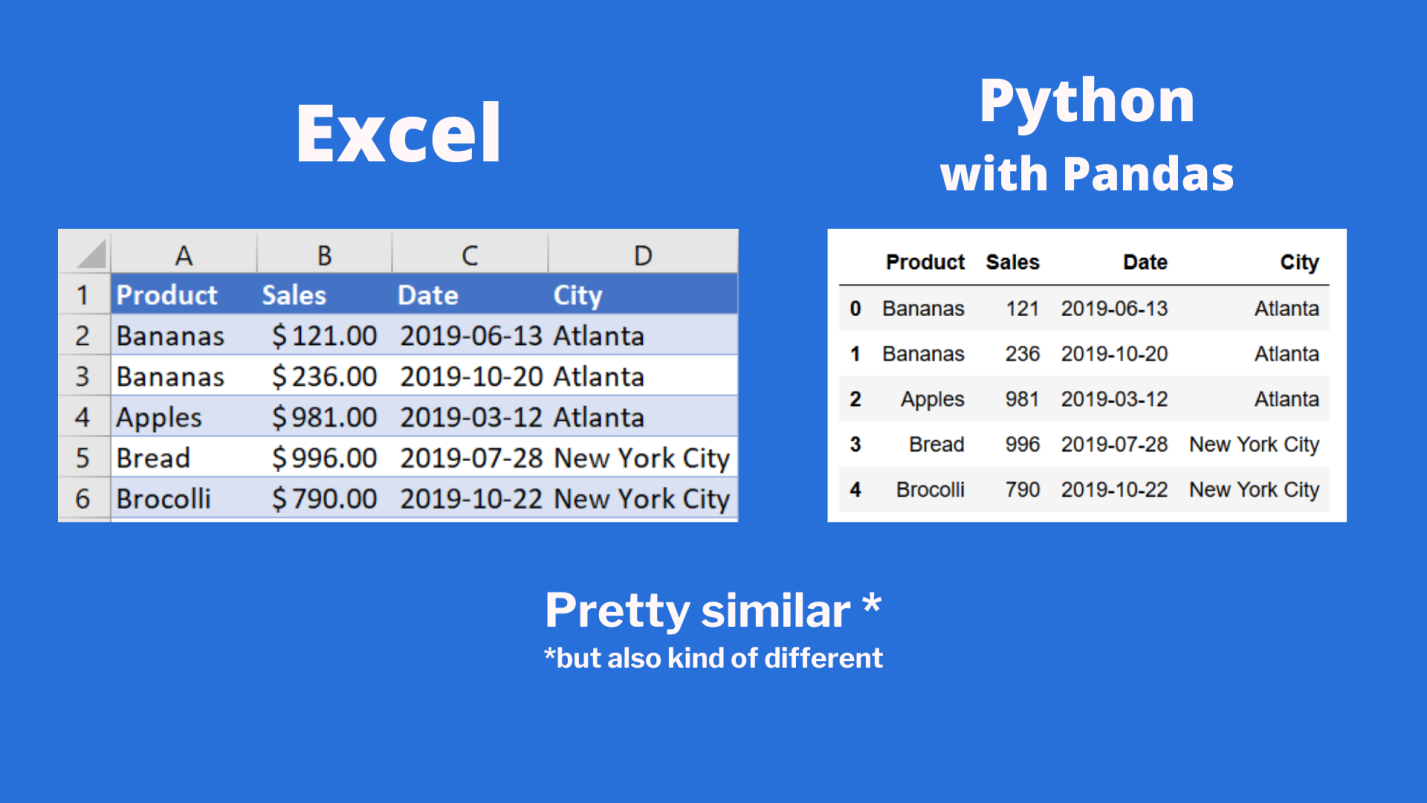
Сравнение внешнего вида данных, выводимых в Excel, с внешним видом данных, выводимых из датафрейма pandas
Тут можно видеть, что результаты визуализации данных из датафрейма очень похожи на то, что можно видеть в Excel. Но тут имеются и некоторые очень важные различия:
- Нумерация строк в Excel начинается с 1, а в pandas номер (индекс) первой строки равняется 0.
- В Excel столбцы имеют буквенные обозначения, начинающиеся с буквы
A, а в pandas названия столбцов соответствуют именам соответствующих переменных.
Продолжим исследование возможностей pandas, позволяющих решать задачи, которые обычно решают в Excel.
Реализация возможностей Excel-функции IF в Python
В Excel существует очень удобная функция IF, которая позволяет, например, записать что-либо в ячейку, основываясь на проверке того, что находится в другой ячейке. Предположим, нужно создать в Excel новый столбец, ячейки которого будут сообщать нам о том, превышают ли 500 значения, записанные в соответствующие ячейки столбца B. В Excel такому столбцу (в нашем случае это столбец E) можно назначить заголовок MoreThan500, записав соответствующий текст в ячейку E1. После этого, в ячейке E2, можно ввести следующее:
=IF([@Sales]>500, "Yes", "No")
Использование функции IF в Excel
Для того чтобы сделать то же самое с использованием pandas, можно воспользоваться списковым включением (list comprehension):
sales['MoreThan500'] = ['Yes' if x > 500 else 'No' for x in sales['Sales']]
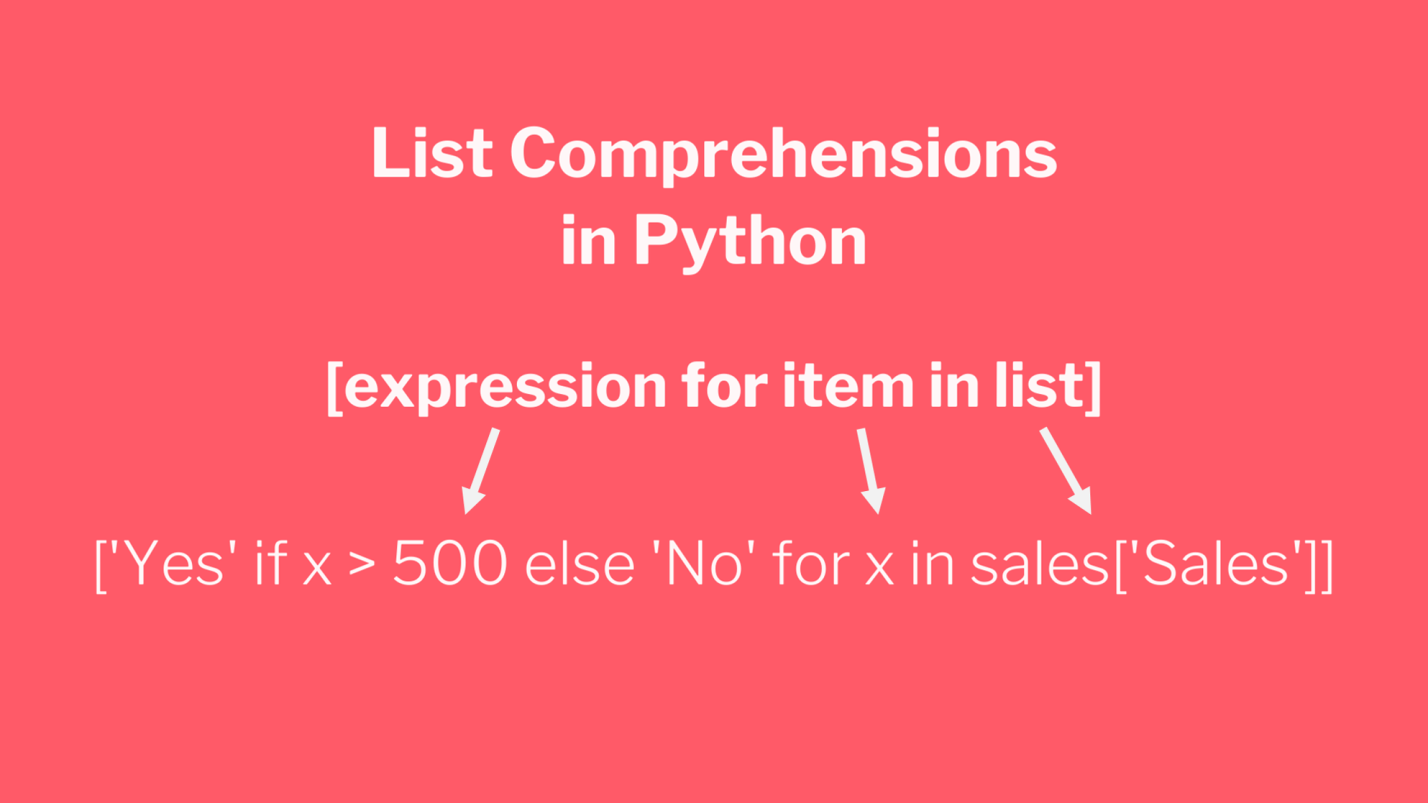
Списковые включения в Python: если текущее значение больше 500 — в список попадает Yes, в противном случае — No
Списковые включения — это отличное средство для решения подобных задач, позволяющее упростить код за счёт уменьшения потребности в сложных конструкциях вида if/else. Ту же задачу можно решить и с помощью if/else, но предложенный подход экономит время и делает код немного чище. Подробности о списковых включениях можно найти здесь.
Реализация возможностей Excel-функции VLOOKUP в Python
В нашем наборе данных, на одном из листов Excel, есть названия городов, а на другом — названия штатов и провинций. Как узнать о том, где именно находится каждый город? Для этого подходит Excel-функция VLOOKUP, с помощью которой можно связать данные двух таблиц. Эта функция работает по принципу левого соединения, когда сохраняется каждая запись из набора данных, находящегося в левой части выражения. Применяя функцию VLOOKUP, мы предлагаем системе выполнить поиск определённого значения в заданном столбце указанного листа, а затем — вернуть значение, которое находится на заданное число столбцов правее найденного значения. Вот как это выглядит:
=VLOOKUP([@City],states,2,false)
Зададим на листе sales заголовок столбца F как State и воспользуемся функцией VLOOKUP для того чтобы заполнить ячейки этого столбца названиями штатов и провинций, в которых расположены города.

Использование функции VLOOKUP в Excel
В Python сделать то же самое можно, воспользовавшись методом merge из pandas. Он принимает два датафрейма и объединяет их. Для решения этой задачи нам понадобится следующий код:
sales = pd.merge(sales, states, how='left', on='City')
Разберём его:
- Первый аргумент метода
merge— это исходный датафрейм. - Второй аргумент — это датафрейм, в котором мы ищем значения.
- Аргумент
howуказывает на то, как именно мы хотим соединить данные. - Аргумент
onуказывает на переменную, по которой нужно выполнить соединение (тут ещё можно использовать аргументыleft_onиright_on, нужные в том случае, если интересующие нас данные в разных датафреймах названы по-разному).
Сводные таблицы
Сводные таблицы (Pivot Tables) — это одна из самых мощных возможностей Excel. Такие таблицы позволяют очень быстро извлекать ценные сведения из больших наборов данных. Создадим в Excel сводную таблицу, выводящую сведения о суммарных продажах по каждому городу.
Создание сводной таблицы в Excel
Как видите, для создания подобной таблицы достаточно перетащить поле City в раздел Rows, а поле Sales — в раздел Values. После этого Excel автоматически выведет суммарные продажи для каждого города.
Для того чтобы создать такую же сводную таблицу в pandas, нужно будет написать следующий код:
sales.pivot_table(index = 'City', values = 'Sales', aggfunc = 'sum')
Разберём его:
- Здесь мы используем метод
sales.pivot_table, сообщая pandas о том, что мы хотим создать сводную таблицу, основанную на датафреймеsales. - Аргумент
indexуказывает на столбец, по которому мы хотим агрегировать данные. - Аргумент
valuesуказывает на то, какие значения мы собираемся агрегировать. - Аргумент
aggfuncзадаёт функцию, которую мы хотим использовать при обработке значений (тут ещё можно воспользоваться функциямиmean,max,minи так далее).
Итоги
Из этого материала вы узнали о том, как импортировать Excel-данные в pandas, о том, как реализовать средствами Python и pandas возможности Excel-функций IF и VLOOKUP, а также о том, как воспроизвести средствами pandas функционал сводных таблиц Excel. Возможно, сейчас вы задаётесь вопросом о том, зачем вам пользоваться pandas, если то же самое можно сделать и в Excel. На этот вопрос нет однозначного ответа. Python позволяет создавать код, который поддаётся тонкой настройке и глубокому исследованию. Такой код можно использовать многократно. Средствами Python можно описывать очень сложные схемы анализа данных. А возможностей Excel, вероятно, достаточно лишь для менее масштабных исследований данных. Если вы до этого момента пользовались только Excel — рекомендую испытать Python и pandas, и узнать о том, что у вас из этого получится.
А какие инструменты вы используете для анализа данных?
Напоминаем, что у нас продолжается конкурс прогнозов, в котором можно выиграть новенький iPhone. Еще есть время ворваться в него, и сделать максимально точный прогноз по злободневным величинам.