
Перевод
Ссылка на автора

Введение
Я был вовлечен в сферу анализа данных около 3 лет. Я работаю в этой области более 2 лет в качестве аналитика в области здравоохранения, и недавно я получила степень MBA, специализируясь на науке о данных.
Во время обучения в магистратуре меня особенно интересовали методы прогнозного моделирования с использованием Python (и я до сих пор). Тем не менее, с точки зрения организации / анализа / отчетности, мне легче всего пользоваться Excel. Тратить 60–80% дня на изучение электронной таблицы Excel — это не чуждо мне. Вкладки, ленты, группировки и инструменты, вложенные в графический интерфейс Excel, являются инструментами для моего оркестра. Они издают звуки, но я провожу и переношу мелодию и гармонию в отчеты, результаты и анализы. В ходе консалтинговых проектов, составления личных бюджетов и других проблем Excel всегда был моим любимым инструментом.
Я знал о SQL и его основных понятиях уже давно. Однако лишь сравнительно недавно я решил пристегнуться и выучить его по профессиональным причинам. С точки зрения пользователя Excel, SQL имеет свои взлеты и падения. В этой статье я надеюсь передать природу и использование SQL, сравнивая его с Excel.
Кто они такие?
Excel это программа. SQL это язык.Это очень важная часть информации, которую нужно переварить. Excel можно использовать только после нажатия на зеленый значок и запуска программы. С другой стороны, SQL можно использовать для взаимодействия и взаимодействия с программами баз данных. Несколько самых популярных:
- оракул
- MySQL
- Microsoft SQL Server
То, как я выучил SQL, это через Google Большой запрос, Это интересный способ изучения / использования SQL путем анализа бесплатных баз данных в облаке Google, доступных бесплатно.
Где данные?
превосходить
Excel — это типичный инструмент для работы с электронными таблицами. Ваши данные сохраняются в файле на вашем компьютере, и они обычно организованы в виде вкладок, столбцов и строк.Файл Excel является локальным для вашего компьютера, Вы напрямую взаимодействуете с ним. Нет посредника. Нет администратора. Конечно, есть возможность использовать API для доставки данных из другого места; Тем не менее, данные в конечном итоге ваши делать с тем, что вы хотите.Это усложняет отслеживание изменений, если несколько человек работают с книгами Excel.… Это действительно возможно отслеживать изменения, но это не очень удобно.
SQL
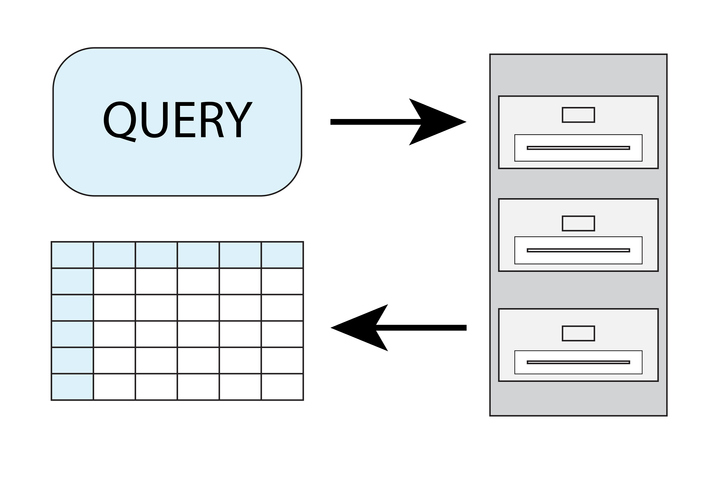
SQL — это язык, который взаимодействует с базами данных. Это означает язык структурированных запросов. В этом случае ваши данные находятся на шаг дальше. Вы пишите и отправляете запросы в SQL к базе данных, которая получает эти запросы, а затем дает вам то, что вы запрашиваете или вносит изменения.Данные хранятся в базе данных и организованы по таблицам. Красота запросов в том, что они более совместные и отслеживаемые. Эти запросы можно проследить, чтобы узнать, кто внес изменения в какую таблицу. Пользователи также могут сохранять и делиться полезными запросами с другими для будущих или совместных целей.
Пример запроса, который фильтрует таблицу «austin_bikeshare» в Big Query на основе «bikeid», а затем упорядочивает выборку по «duration_minutes».
SELECT
   duration_minutes
FROM
  `bigquery-public-data.austin_bikeshare.bikeshare_trips`
Where
   bikeid = "446"
ORDER BY
   duration_minutes desc
Когда вы узнаете, как работает синтаксис, манипулирование данными может быть намного быстрее с использованием SQL, чем в Excel. Другим важным аспектом является то, что синтаксис похож на английский, что делает его, пожалуй, самым простым компьютерным языком для изучения.
Для чего они лучше всего используются?
превосходить
- Меньшие наборы данных: менее 1 миллиона строк, даже к северу от 100 000, это, вероятно, замедлит работу вашего компьютера.
- Ввод данных вручную
- Более гибкая структура: любая ячейка может быть любого типа данных, независимо от того, в каком столбце она находится.
- Вывод графиков и визуализаций
- Встроенная проверка орфографии и другие полезные функции
- Работать самостоятельно над проектом
SQL
- Большие наборы данных: в зависимости от программного обеспечения и базы данных это может быть очень очень большим. Не замедляется, как в Excel.
- Организация / структура: таблицы SQL более строгие в отношении согласованных типов данных и ограничивают пользователей, если они пытаются ввести неправильный тип.
- Совместная работа
- Подготовка данных для дальнейшего анализа в другом программном обеспечении
- Согласованные отчеты или расчеты: как упоминалось ранее, вы можете сохранять и обмениваться запросами.
- Более безопасный, поскольку изменения всегда отслеживаются и проверяются.
Вывод

Когда я впервые узнал о предложениях JOIN в SQL, моей первоначальной реакцией было пометить его как незначительный, потому что я уже знал, как использовать Vlookups в Excel. После этого я некоторое время сохранял такое отношение, но, продолжая изучать уроки, реальность ситуации начала проявляться. Когда я узнал, насколько просты и полезны предложения JOIN, я вспомнил, сколько раз Vlookups выполнял на протяжении большого количества строк. Я вспомнил, как они увеличивают размер файла в геометрической прогрессии, если вы не вставляете значения после выполнения вычисления Я также вспомнил, как ограничивать его, принося только 1 значение за раз … Подобные уроки были получены, когда я сравнивал SQL с Excel на протяжении всего обучения.
В заключение, оба инструмента имеют свое место, когда дело доходит до анализа данных. Оба служат своим уникальным целям, и знание обоих полезно для всех, кто регулярно использует данные. Из моего опыта и исследование однако по этой теме SQL является более востребованным и полезным навыком в качестве аналитика данных. Excel отлично подходит для владельцев малого бизнеса, консультантов и студентов. SQL лучше для аналитиков и исследователей данных.
Некоторые полезные ресурсы, которые я использовал в своем изучении SQL:
SQL для науки о данных с Google Big Query
5 причин, по которым SQL необходим навыкам аналитиков данных
Команды SQL для часто используемых операций Excel
Пожалуйста, подпишитесь, если вы нашли это полезным. Если вам нравится мой контент, ниже приведены некоторые проекты, над которыми я работал:
Uber Отзывы Анализ текста
Простая линейная и полиномиальная регрессия
Случайный лес лучше, чем логистическая регрессия? (сравнение)
Индекс Джини против информационной энтропии
Прогнозирование рака с помощью логистической регрессии в Python
Пример двумерной логистической регрессии (python)
Расчет R-квадрата с нуля (с использованием Python)
Excel and SQL make up two of the most popular and powerful ways of working with data. You will find “Excel” and “SQL” in many job descriptions—especially for data analyst roles. What exactly are these data-related tools? Which one is better, and which one should you learn?
What is Microsoft Excel?
Microsoft Excel is a computer program that uses spreadsheets to help users store, manipulate, and analyze data. The program is widely used in business analyst roles for quick calculations, data summaries, and data visualizations.
What is SQL?
SQL stands for Structured Query Language. Data analysts use SQL to manage large databases and pull relevant data for business-use.
SQL is not a general programming language. Unlike with Python or Java, you cannot use SQL to implement sophisticated programs; SQL only lets you read, manipulate, and search through databases to convert raw data into organized, tabular information.
What are the differences between Excel and SQL?
The main differences between Excel and SQL revolve around accessibility and power:
- Excel is known for its ease-of-use. The application presents a visual notebook that makes it easy to format and visualize data.
- SQL is known for speed and volume. It lets users work with enormous amounts of raw data without sacrificing speed—Excel starts to lag with larger volumes of data.
Both Excel and SQL let data analysts work with data, but the two tools have different use-cases depending on a business’s data needs and expectations. Understanding the differences in terms of advantages and disadvantages with Excel and SQL will help you make the most of your data.
What is Excel good at?
Excel is a powerful tool that is easy to learn and great for quick data analysis. Its workbook aesthetic, color options, and easy formatting make data much more accessible to users. For instance:
- Excel simplifies data. As an example, Excel cells let you store strings of information like “January 3, 2020,” whereas relational databases using SQL would divide the date into three separate cells.
- Excel is more visual than SQL—instead of writing commands, users get to directly work with and manipulate their data in tables.
Because of its ease-of-use, Excel is commonly used across industries and widely taught in schools. If you’re a small business owner or a team of one working with relatively small data sets—no more than a couple hundred thousand lines of data—then Excel is a great tool for you to:
- Manipulate data
- Summarize data with pivot tables
- Visualize data into charts, graphs, and tables
- Compute quick statistics—numbers that summarize your data
What is Excel weak at?
Excel gets slower the more data you ask it to handle. In fact, Excel cannot store more than one million lines of data—and the tool begins to slow down well before reaching that much data. Although the tool is visually accessible, if you are working with large data sets, you do not want to use Excel.
What is SQL good at?
SQL is fast and can handle large loads of data. Unlike Excel, SQL can handle well over one million fields of data with ease. SQL queries are also more flexible and powerful than Excel formulas.
Data analysts use SQL to interact with enormous databases by:
- Manipulating data
- Pulling data
- Filtering data
- Updating data
- Combining data
SQL has better data integrity than Excel. Each cell in SQL is limited to only one piece of information—such as day of the week or month. Extrapolating data this way might be a hassle, but it significantly reduces the chance of miscalculations and data errors.
SQL is also compatible with various database management systems, including Oracle, MySQL, and PostgreSQL. Each software is different in how it handles new data and improves control for the end-user. But SQL is a way to access data across the board.
If you are planning on working with large databases and want speed, accuracy, consistency, volume, and power, SQL is the way to go.
What is SQL weak at?
SQL is less accessible than Excel. Whereas Excel has a graphical user interface and visual options for data manipulation, SQL amounts largely to writing code to interact with relational databases. While the query language is exceptionally powerful and the industry standard for working with large amounts of data, it is harder to learn than easier data analysis tools like Excel.
Is SQL better than Excel?
The answer to this question depends entirely on how much data you have and what you’re looking to do with your data. If you have small amounts of data and want to compute or visualize quick answers, Excel is more than enough.
If you have massive databases, need to combine datasets quickly, and want more data security, SQL is the way to go. SQL lets users track data updates and limit data manipulation by other users via restrictions—Excel has less robust solutions for data integrity.
Can learning SQL replace Excel?
Learning SQL is no replacement for learning Excel, and vice versa. Both tools have their own learning curve—although many claim SQL is more difficult than Excel. That said, learning one tool may make it much easier to learn the other.
Most data analysts learn both Excel and SQL. They use SQL to work in businesses and communicate with large databases and bust out Excel to solve quicker data analysis problems. To become a strong data analyst, it’s recommended you learn both.
Learn Excel and SQL with edX

If you work with data, you will need to know SQL and Excel. Although some businesses and team members may prefer one to the other, both tools are industry standards when it comes to data analysis. Excel is useful for quick visualizations and summaries of data, whereas SQL is necessary for working with large volumes of data, managing databases, and using relational databases to their full potential.
Take your data skills to the next level with edX. Learn Excel and study SQL online today!
Are you a seasoned Excel user? In this article, we’ll look at why you would want to learn SQL if you already are an Excel user.
I was once in the same place as you. I started programming in the late 1970s and early 1980s. In the 1990s, I first started creating spreadsheets and used Microsoft Access (another type of database). However, it was over a decade later before I began to investigate SQL Server.
Isn’t that just for big businesses? Why should you learn it? Let’s find out.
Similarities between Excel and SQL Server
What do Excel and SQL Server have in common?
- They can both store data.
- They both have a vast array of functions that you can use in formulas to manipulate the data or join multiple sets of data together.
- You can then use the finished results in your analysis.
However, the similarities stop there.
Differences between Excel and SQL Server
Adding Data in Excel
Excel is excellent as a presenting tool, but the spreadsheet application does have its disadvantages when it comes to data entry. It holds data in an unstructured format, meaning that users can put information anywhere they want in the spreadsheet.
In the image below, data analysis would only be accurate if you store the dates in column A. Because Excel has no limitations, the user could insert dates into columns A, B, and F without Excel raising any errors.

Also, the data in a single column doesn’t need to be of the same type. For example, users could insert dates, text, and numbers in the same column, making analysis hard to do. You can also merge cells together, which may be suitable when creating presentations, but it makes analyzing data much harder. Of course, this is especially true if you are using more structured analysis techniques such as PivotTables.
Fortunately, you can use the data validation tool to stop this from happening. Data validation ensures that users are inputting the correct type of data in each column. You could also protect the spreadsheet to prevent users from making structural changes, such as Merge Cells. However, in my experience, these types of safeguards are never used.
Adding Data in SQL Server
SQL Server has strongly typed data storage. This means that each column has a single data type such as text, date, or number. It is not possible to put anything in a particular column which is not compatible with its type. For example, you could insert “1” into a text column because it can convert “1” into text. However, you cannot insert “hello” into a number column because it cannot be converted. If you attempt to do this, you will encounter an error. Additionally, SQL Server cannot merge individual cells in tables together.


Your data is immediately validated in SQL, increasing your data integrity and allowing for more reliable analysis.
Adding functions into data in Excel
In Excel, you might have 100,000 rows of data, including FirstName and LastName columns, and you want to create a FullName column. That is a very easy formula to create using a formula like the following:
= A2 & ” ” & B2
However, you’ll have to create this formula for each data row. This increases the time required to calculate the values and increases the file size, as Excel has to store these formulas.

There are ways around this in Excel. You could:
- Use more advanced array formulas
- Create calculated columns in an Excel Table
- Use Get and Transform or Power Pivot to create the extra columns
However, the default is that you have to make a formula for each of these 100,000 rows.
Adding functions into data in SQL Server
In SQL Server, you only need to add one formula. SQL stands for “structured query language,” and you can use the programming language to add this formula. For example, you could add a computed column in your table or create a SELECT statement which concatenates these columns:
SELECT FirstName, LastName, FirstName + ' ' + LastName AS FullName
FROM myTable
You can save the results of these SQL queries as Views or Stored Procedures and regenerate the results whenever you want. You could also use it in more advanced fields like data science.
Security in Excel
Excel has not got many security features. This can be a concern if you have sensitive data, such as personal or salary data.
When saving your spreadsheet, you could password protect it. This means that you need that password to open the Excel file.

However, someone can bypass this protection using password crackers, which are readily available on the Internet.
Another way of locking down Excel is by protecting locked cells in a spreadsheet. This could stop people from looking at a particular formula to see how it is calculated, or changing some of the styles or content (such as merging cells together).

While useful, this again can be turned off using password crackers.
Security in SQL Server
As a Database Management System, SQL Server has security at its core.
- To access an SQL Server instance, you first need a set of credentials. This could be your Windows login or a separate username and password.
- In order to access a database within that instance, you also need to have a valid SQL user associated with that login.

This user account will also determine what sort of access you will have to the data. For instance, you may only be able to read a certain set of tables or queries. Alternatively, you may be able to only insert data without the ability to read it.
SQL Server is also good for version control. Suppose you added some data, altered it, then deleted it. In an Excel spreadsheet, you would only have the end result (namely, that nothing had changed). In SQL Server, you could have the entire history if you wanted to track it.
Can you use Excel and SQL Server together?
If you store data in SQL Server, can you use it in Excel? Absolutely, and it is very easy to do. In Excel, you can go to the Data tab and link data from SQL Server by going to Data – Get Data – From Database – From SQL Server Database.

This can be the original data or processed data. In this way, SQL Server can process the data, and Excel can then make the visualizations you want from the analysis.
Excel can have up to around a million rows in a single spreadsheet, and tables in SQL Server can store enormous amounts of data. Therefore, if you are importing big data sets into Excel, you have two options:
- Pre-process the data in SQL Server, which allows you to bring in the analysis.
- Import the data into Get and Transform first, which can then do the analysis.
The data can be refreshed by right-clicking on the table and choosing Refresh.
This means that:
- Your data analysis can be up to date whenever you want.
- Multiple people can access the same data at the same time.
- Multiple people can insert data at the same time into a central database.
You can’t do this easily in Excel. It is much simpler when you use SQL and Excel together.
How can I learn SQL?
If you are interested in learning how SQL Server works, why not look at my course “Database Fundamentals,” which is exclusive to Udemy.
In just over 8 hours, you will learn the key concepts of SQL Server:
- Learn the six principal clauses of the SELECT statement
- Create tables, views, and stored procedures
- Learn about security and backups
For a more in-depth look at the SELECT statement and related objects, please go to my “Querying Microsoft SQL Server with Transact-SQL” course.
However, maybe you want to know more about Get, Transform, and Power Pivot? If so, please have a look at my “Analyzing and Visualizing Data with Microsoft Excel” course. It also shows how to connect Excel with SQL Server.
I hope that you enjoyed this article and that you found it useful. Maybe you will consider looking at learning SQL Server. You can then connect it to your Excel visualizations.If you’re ready to learn more about SQL or Excel, please continue on to Udemy’s other blog articles. “What is Excel and how it can work for you?” will give you an overview of how the spreadsheet software became an essential skill for professionals. “What is SQL?” and “Best way to learn SQL,” will give you a deeper understanding of the database language. In my next article I will explain how to use SQL in Excel in more detail.
Post Views:
1,384
Some people may be curious whether we choose Excel or SQL in our projects, and what the differences between them are in terms of both definition and practical application. However, the mutual similarity is that they are used for Data Organisation.
“Data Organisation” refers to the method of classifying data sets to make them more useful
The purpose of this blog is to compare Excel and SQL as well as to demonstrate real-world examples in insurance industry. I hope this blog will make readers better understand these tools and be able to implement in their projects effectively.
Spreadsheet and traditional relational database : the Crash Concept
I believe that almost most people used to spreadsheet application like Excel or Google Sheet. The main feature is to represent data in the form of spreadsheet, which composes of rows and columns, and to demonstrate these data sets as graph or histogram.
Looking into SQL, it is query, which is commonly used to interact with
Traditional Relational Database , which can be seen as many excel spreadsheets, which have related relationship, grouped together as one database so that the redundancy of the data can be reduced.
Nevertheless, before writing SQL language in order to create, read, update or delete data from the database (aka CRUD) , we have to define the relationship. we can explain the structure of the database in
Entity Relationship Diagram or ERD . This diagram is standard and widely used.
For instance, it is assumed that many monthly claim can occur and be recorded in one policy (one to many relationship). We can store the data in spreadsheet like this:

It is clearly seen that the spreadsheet has redundancy in columns of
accident_date, reported_date and closed_date, and these can be fixed ,according to the principle of Traditional Relational Database by separating them to 2 tables, and add policy_id column in order to reference to id column of Policy Table as below:

To sum up, we can write the table relationship in term of ERD as below:

- ||—–o< means one to many relationship
- PK stands for Primary Key , and this key must not have duplicate values and must not have value NULL. The purpose of these rule is to prevent the duplicate data in the database and make the primary key get index. In particular, when you tell the database to insert a new row, it has to check the new row’s primary key value against every existing primary key values to ensure that the new value is not there yet. There’s no faster way do achieve this than by figuring out the value in the indexes.
- FK stands for Foreign Key . It is for connecting the relationship between 2 tables together. For example, the row of Policy Table, which has id (PK) =1, can be combined with the row of Monthly_Claim Table, which has the same policy_id (FK) =1.
By the way, one to many relationship is not the only relationship in the world. If you want to learn more about ERD and how we can define the relationship, I highly recommend to check this link out:
https://www.lucidchart.com/pages/er-diagrams?a=0
SQL or EXCEL ? :the Practical Detailed Comparison
The Readability
The emergence of SQL made human can write query or instruction easier. We can extract data that we only want not all from the table. To give an example, supposed we have database : Table Monthly_Claim in our system as I used as an example above, we can simply write query as following:
SELECT paid_claim
FROM Monthly_Claim
WHERE paid_claim BETWEEN 130 AND 150
ORDER BY paid_claim DESC
LIMIT 10;
Then, the result can be seen as new spreadsheet which includes the 10 greatest amounts of claims as:

Let see the code in detail
- SELECT is a keyword that tells SQL in order to query the data from the database.
- paid_claim is columns in Monthly_Claim table.
- FROM is a keyword that tells query to look up in Monthly_Claim table.
- WHERE is a keyword which filters the data as condition we specified. In our case, it is only the rows whose paid_claim has values 130 between 150.
- ORDER BY is a keyword which orders the obtained result in ascending or descending order . In our instance, it is
in descending order, so we use keyword DESC. - LIMIT is keyword to limit the amount of shown result.
If you’re an Excel power-use , the instruction are:
- Open Monthly_Claim table , then copy all data into Excel spreadsheet
- Use FILTER or IF function to every row of paid_claim column to handle conditional logic which is that paid_claim must be between 130 and 150
- Now, use Excel feature Sort & Filter for the purpose of order
- Finally, copy only first 10 rows , then delete unwanted rows
- Alternatively, all above steps can be implemented by VBA .
It can be summarised that although Excel gives more flexibility and simplicity , it has more complex steps users have to work on. Moreover, If there is new data, we have to repeat the same instruction again, so that error can easily occur. Last but not least, provided we need to collaborate with our teammate, we have to add comment in worksheet in order to make our teammate understand what we do. All of I mentioned is quite waste of time.
Whereas, SQL users just code in a few lines, then they get the same result. Furthermore, they can reuse their code and do not have to change anything, and the code is much easier to understand. This is because its syntax is quite similar to English language.
Performance and Speed
Excel has limitation which is that the more amount of data and the more complexity of the functions which Excel users use, the worse performance and speed they experience. Also, Excel can run the program at most 1 million row.

Compared to SQL, it can be up to billion rows and its performance is much faster. In some cases. with SQL, the query can be executed within a couple of minutes, whereas it take an hour in Excel.
Collaboration
You can imagine if the amount of data continues growing, the size of Excel files becomes larger as well. It may be dozens of Mb. It certainly appears slow and difficult, especially when uploading and sending these files to teammates. Apart from this, there is concern about naming convention and version control. I believe most Excel user often get the problem like I shown below:

Nonetheless, this kind of problem could be mitigated if you change to use Google Spreadsheets.
Turning into SQL, it stores only a piece of text query(small size of code or instruction ), not keeping a large size of data in file like Excel. As a result, everyone in the team can access the same database. Now, everybody can run their own queries, and they do not affect one another. This means that version control is no longer necessary.
Plus, knowing SQL makes us speak the same language the IT professionals who take care the database roles, following smoothly collaboration.
Learning Curve
Since Excel is Microsoft Office Product, it provides a good and easy-to-use UI (User interaction). Although people who never programmed before, they can easily use it . They just try clicking and using keyboard shortcuts, and they can master Excel in a short time.
SQL is not so hard too, but the most essential part is to understand the type of data and its relationship. If you want to dig deep into SQL, my recommendation is to study as following:
- Basic SQL Command
- SQL JOIN
- SQL Aggregate Function
- SQL Subqueries
- Data cleaning with SQL
- SQL Window Function
- SQL Performance Tuning
My favourite website to study SQL is tutorialspoint.com/sql .
Adoption with Other Tools
Data visualisation
In Excel, data visualisation is a piece of cake, because Microsoft has already especially prepared built-in feature. Excel users can quickly and effectively create various graphs such as line chart, bar chart, histogram , or even time series. We can then export these graphs to other Microsoft Office programs , namely Powerpoint and Word.

SQL is just a query programming language, so data visualisation can be done in different ways For example, most SQL users integrate with external libraries, namely Matplotlib in Python, D3.js in JavaScript , Processing.js in JavaScript ,etc. and these tools are open source and free.
One of well-known in data-driven library is D3.js. It helps us to unlimitedly design data visualisation documents. Its results are even more beautiful and flexible compared to Excel ones. Many developers use it to design and create new kinds of chart such as Zoomable Geography Graph, Sequence Sunburst Graph, etc.

However, in the real word, just normal graph like line chart or histogram, which can be easily created by Excel, is enough for showing insight of the the data. Therefore, D3.js is considered to be overkill , and it suitable for only highly complex and specific data set. Moreover, its learning curve is quite high. In addition to data skills, knowledge of Javascript Language and front end web development fundamental are required for mastering the library.
But if you interest, you can navigate to D3.js by this link: https://d3js.org/ .
Connection with Database
Again, For Excel users, the easiest way to access the database is via Microsoft Access. It does not only help us to easily create Relational Database and provide built-in SQL query features, but it also allow ability to use the result from those queries to be continuously apllied next in Excel. Still, it is not free, and it can be bought from Microsoft 365 package.

At the same time, if we use SQL, we have more options when we consider accessing traditional database. The famous tools are Access, MySQL, PostgreSQL , etc.
Extended to New feature such as Machine learning
If the Excel users want to use some not-built-in feature , they have to buy add-ons from Microsoft. Besides, its machine learning feature has some limitation, so I do not suggest Excel for this work.
Similarly, SQL is not a language for machine learning, since the top languages to develop machine learning are R and Python. Yet, SQL opens a door to machine leaning, predictive modelling, data science, and AI development by reason of its nature of compatibility with other famous open source libraries.
One of top Machine learning frameworks is TensorFlow, backed by Google. It allows us to write with both Python and Javascript.

From learning curve perspective, Python and Javascript are not so hard by themselves. The most difficult is the concept of machine leaning, and it requires a strong knowledge of mathematics.
Conclusion
Excel is fit for easy tasks, not complex ones, individual work or final task, which need not to forward to other teammates.
SQL is appropriate for complex, long-term and big projects, which have a frequent growing amount of data. Also, You need to take an account of collaboration concern.
You sometimes can use both Excel and SQL at the same time. As an illustration, you can write a SQL query to read the data, then plot it to Histogram with Excel.
When considering whether Excel or SQL should be implemented, one thing you have to consider is the simplicity to access and usage by yourself and your team. By instance, despite the fact that the project we currently work is really suitable for SQL, It makes no sense to implement SQL in your project if your team never have experience with SQL and database before.
Last but not least,
DO NOT choose the tool simply because others told that it is good. It may not be the best for you. We should use the tool that can make our work done smoothly with no errors and within the deadline.