
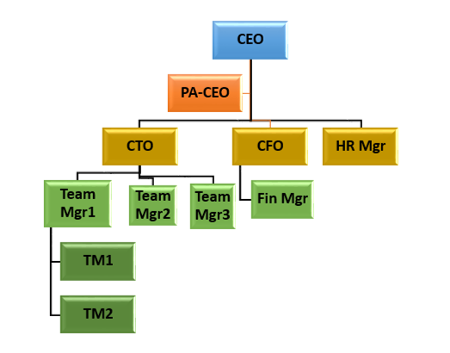
Организационная схема проекта достаточно типична: в самом верхнем прямоугольнике указывается фамилия «самого большого начальника» и далее вниз — до уровня отделов. В случае организационной схемы проекта в этом прямоугольнике указывается фамилия опекуна проекта, далее следуют руководитель проекта, непосредственные исполнители проекта и т.д. Организационная схема проекта для нас важна потому, что она позволяет отобразить уровни властных полномочий лиц, участвующих в реализации проекта, а также восходящие пути решения проблем, возникающих в ходе его выполнения.
Организационная схема проекта бывает особенно полезна при выполнении средних и крупных проектов, когда у руководителя есть несколько заместителей, которые отвечают за реализацию подпроектов или отдельных конечных результатов и подчиняются старшему руководителю проекта. На рис. 1 показан пример организационной схемы проекта. Организационные диаграммы можно использовать не только для определения ответственности в проекте, но и для графического изображения хода процесса, например так можно составить график для трудоустройства и работы в Австрии.

Рис. 1. Организационная схема проекта
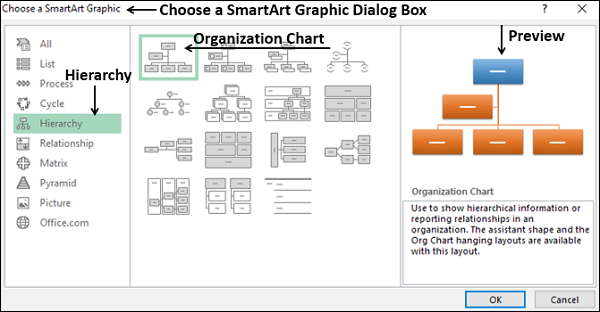
Организационные схемы проектов удобно создавать в программе Excel. На ленте этой программы активизируйте вкладку Insert (Вставка) и в разделе Illustrations (Иллюстрации) щелкните на кнопке Smart Art. На экране появится окно Choose a Smart Art Graphic (Выбор рисунка SmartArt), показанное на рис. 2.

Рис. 2. Диалоговое окно Choose a SmortArt Graphic
Из списка в крайней слева области этого диалогового окна выберите элемент Hierarchy (Иерархия), щелкните на значке Organizational Chart 1 (Организационная диаграмма), расположенном в верхнем левом углу центральной части окна, а затем на кнопке ОК. На экране появится незаполненная организационная диаграмма (рис. 3).
Панель Type text here (Введите текст) (см. рис. 3) предназначена для заполнения текстовыми фрагментами графических элементов организационной диаграммы. Щелкните на определенном элементе диаграммы, а затем введите текст, который должен отображаться на этом элементе. Нажмите клавишу Enter, чтобы создать новый графический элемент схемы (при этом вы останетесь на том же уровне организационной схемы, на котором работали до нажатия клавиши Enter). Для создания нового графического элемента организационной схемы, расположенного на уровень ниже от выделенного в данный момент, нажмите клавишу Enter, а затем — Таb. (Нажатие клавиш Ctrl+Tab позволяет вернуться на один уровень вверх.) Окончательный вариант организационной схемы нашего проекта был показан ранее (см. рис. 1).

Рис. 3. Шаблон организационной схемы проекта
Для того чтобы изменить местоположение любого элемента, просто перетащите его в другую часть организационной схемы. Программное средство SmartArt автоматически отслеживает связи между элементами организационной схемы. Если вам понадобится изменить размер любого графического элемента, воспользуйтесь маркерами, которые расположены по его периметру. Над выделенным графическим элементом организационной схемы расположен круглый маркер зеленого цвета. Щелкните на нем, а затем перетащите указатель мыши, чтобы повернуть графический элемент. Для выделения нескольких графических элементов организационной схемы щелкните на них мышью, удерживая нажатой клавишу Ctrl. Завершив построение организационной схемы, скройте ее левую панель Type text here (Введите текст). Наконец, обратите внимание на метки-манипуляторы, расположенные по периметру окна самой организационной схемы. Пользуясь этими метками-манипуляторами, можно перемещать организационную схему или менять ее размеры.
Чтобы пользоваться организационными схемами в Office 2007/2010/2013, сначала необходимо убедиться в том, что у вас установлено программное дополнение Organizational Chart Add-in for Microsoft Office Programs (Надстройка организационных диаграмм для программ Microsoft Office). По умолчанию это дополнение не устанавливается. Закройте все программы Office (в том числе и Outlook). Откройте окно Control Panel (Панель управления), а затем дважды щелкните на значке Add or Remove Programs (Установка и удаление программ), чтобы открыть одноименное диалоговое окно. В списке установленных приложений найдите элемент Microsoft Office Professional, выделите его и щелкните на кнопке Change (Изменить). На экране появится диалоговое окно Change Your Installation of Microsoft Office (Microsoft Office Профессиональный). Установите переключатель Add or Remove Features (Добавить или удалить компоненты), а затем щелкните на кнопке Continue (Продолжить).
Чтобы найти дополнение Organizational Chart Add-in for Microsoft Office Programs, щелкните на знаке «плюс» рядом с элементом Microsoft Office PowerPoint. (Многие годы это программное дополнение ассоциировалась исключительно с PowerPoint, хотя оно может использоваться и для других программ Microsoft Office.) Щелкните на интерфейсном элементе, который расположен слева от интересующего вас компонента, и в появившемся меню выберите команду Run from My Computer (Запускать с моего компьютера). Щелкните на кнопке Continue (Продолжить).
Роли и обязанности исполнителей нашего проекта задокументированы и отправлены па Microsoft Office Sharepoint Server. Каким образом вы могли бы мотивировать этот новообразованный коллектив исполнителей? На этот вопрос мы постараемся ответить в следующей статье.
Организационная диаграмма компании
Визуализируйте сотрудников компании и их взаимоотношения в сфере отчетности с помощью этого современного шаблона организационной диаграммы компании. Этот шаблон организационной структуры компании можно настроить под свои потребности. В нем применено цветовое выделение для распределения сотрудников компании, демонстрации структуры и представления отношений. Этот шаблон PowerPoint поддерживает специальные возможности.
PowerPoint
Скачать
Открыть в браузере
Поделиться
![]()
![]()
![]()
Вы можете проиллюстрировать отношения отчетности в вашей команде или организации, используя организационную диаграмму. В Excel вы можете использовать рисунок SmartArt, который использует макет организационной диаграммы.
Что такое организационная структура?
Организационная диаграмма графически представляет структуру управления организации, например, руководителей отделов и соответствующих сотрудников по отчетности в организации. Кроме того, могут быть помощники для топ-менеджеров, и они также изображены в организационной структуре.
Организационная схема в Excel будет такой, как показано ниже.
Подготовка данных
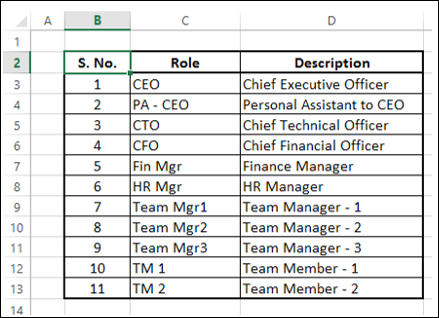
Ниже приведены шаги для подготовки данных для организационной структуры:
Шаг 1 – Соберите информацию о различных ролях в организации, как указано ниже.
Шаг 2 – Определите отношения отчетности в иерархии.
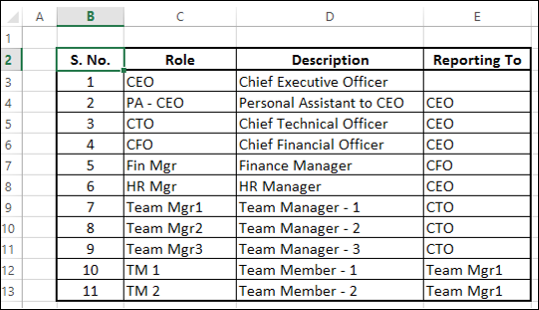
Вы будете использовать эту информацию для создания организационной структуры.
Создание организационной диаграммы
Ниже приведены шаги для создания организационной диаграммы.
Шаг 1 – Нажмите вкладку INSERT на ленте.
Шаг 2 – Щелкните значок «Графика SmartArt» в группе «Иллюстрации».
Шаг 3 – Выберите диалоговое окно выбора SmartArt Graphic .
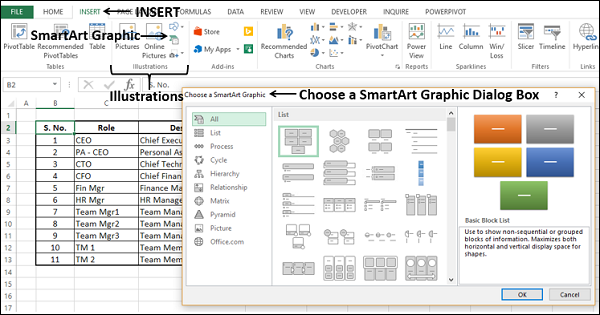
Шаг 4 – Выберите Иерархия на левой панели.
Шаг 5 – Нажмите на организационную диаграмму.
Шаг 6 – Появится предварительный просмотр организационной диаграммы. Нажмите ОК.
Шаблон организационной диаграммы появится в вашем рабочем листе.
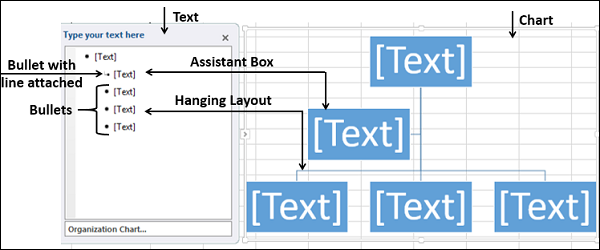
Как вы можете заметить, вы можете ввести текст в левой панели, и он сразу появится на графике справа. Поле с маркером с линией, прикрепленной на левой панели, указывает, что это поле помощника на диаграмме. Поля с маркерами на левой панели указывают, что они являются частью висящего макета на диаграмме.
Шаг 7 – Введите информацию в текстовой панели.
Шаг 8 – Понизить, если есть отношения отчетности.
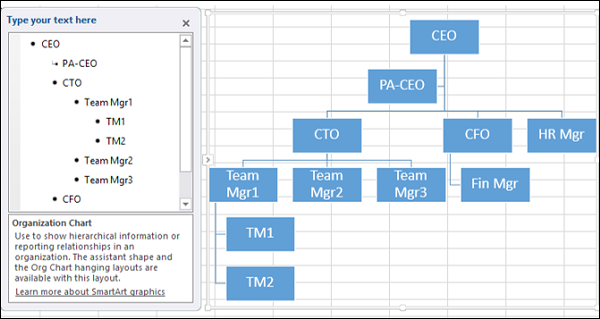
Шаг 9 – Нажмите за пределами графика. Ваша организационная структура готова.
Форматирование организационной диаграммы
Вы можете отформатировать Организационную диаграмму, чтобы придать ей дизайнерский вид. Следуйте инструкциям ниже
- Нажмите на график.
- Нажмите вкладку ДИЗАЙН на Ленте.
- Выберите «Полированный» в группе «Стили SmartArt».
- Измените цвета коробок.
- Изменить цвет шрифта.
- Отрегулируйте размер ящиков.
- Отрегулируйте ширину линий.

Ваша организационная структура готова.
Smartsheet Contributor
Kate Eby
March 9, 2022
This article features a collection of organization chart templates that department heads and HR pros can use for listing organizational structures. You’ll find organization charts that meet the needs of a variety of business scenarios.
Included on this page, you’ll find templates for a simple small business organizational chart and matrix. You can also download a presentation version of a sample small business organizational chart template and a basic horizontal organizational chart for sharing the chart with a larger group.
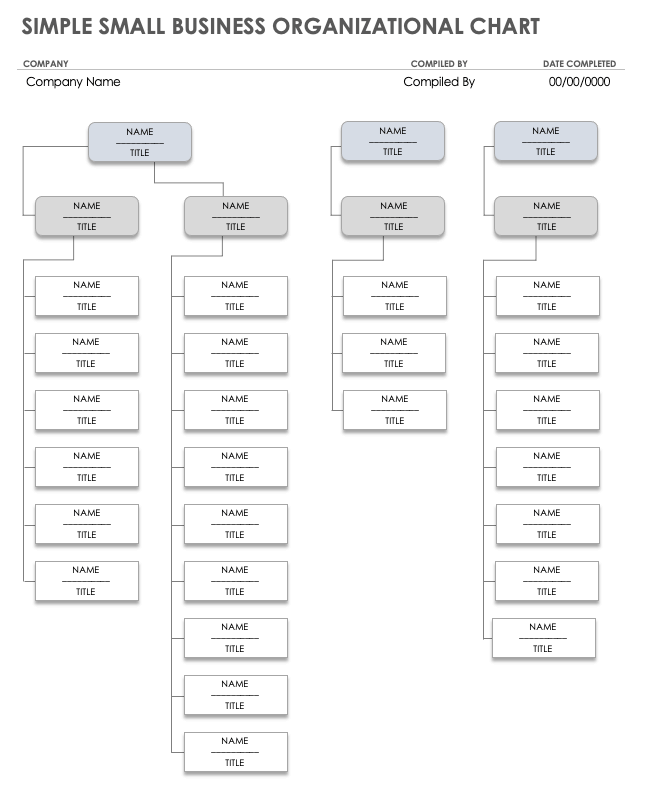
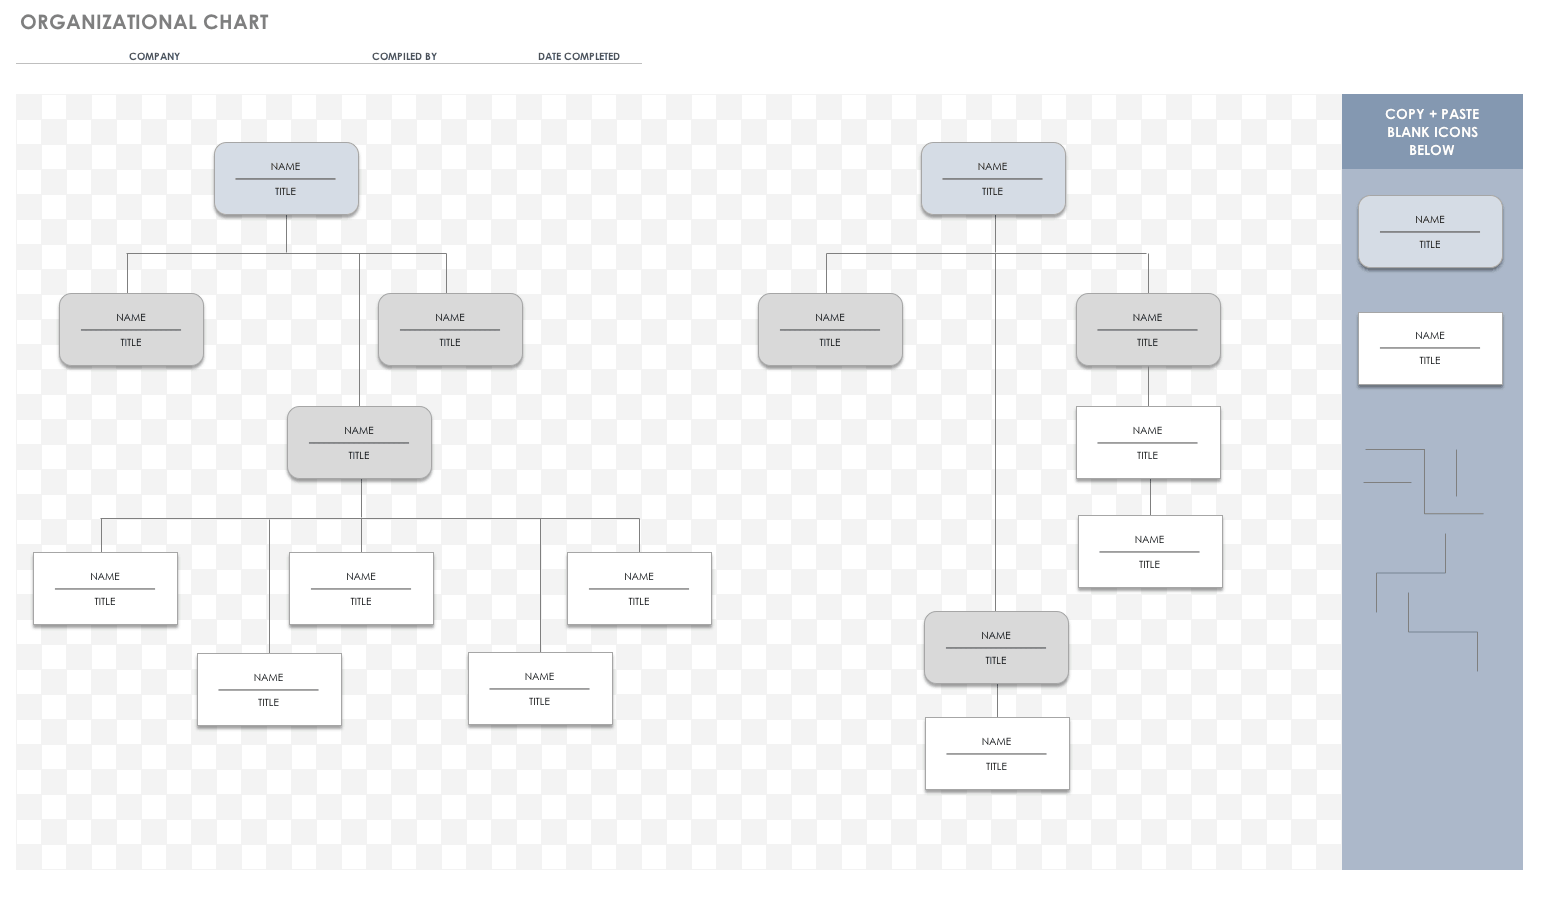
Simple Small Business Organizational Chart Template
Download Simple Small Business Organizational Chart Template
Microsoft Excel | Microsoft Word | Microsoft PowerPoint | Google Slides | Google Sheets
Use this simple small business organizational chart template to identify and detail your business’s personnel structure. Space for names and titles enables you to diagram reporting relationships for divisions, departments, and teams to see who reports up the chain to whom. Highlighting the reporting structure in this manner makes this organizational chart template ideal for presentations, planning, and personnel directories.
Find tips for creating an organizational chart in Word when mapping the employee structure of your small business.
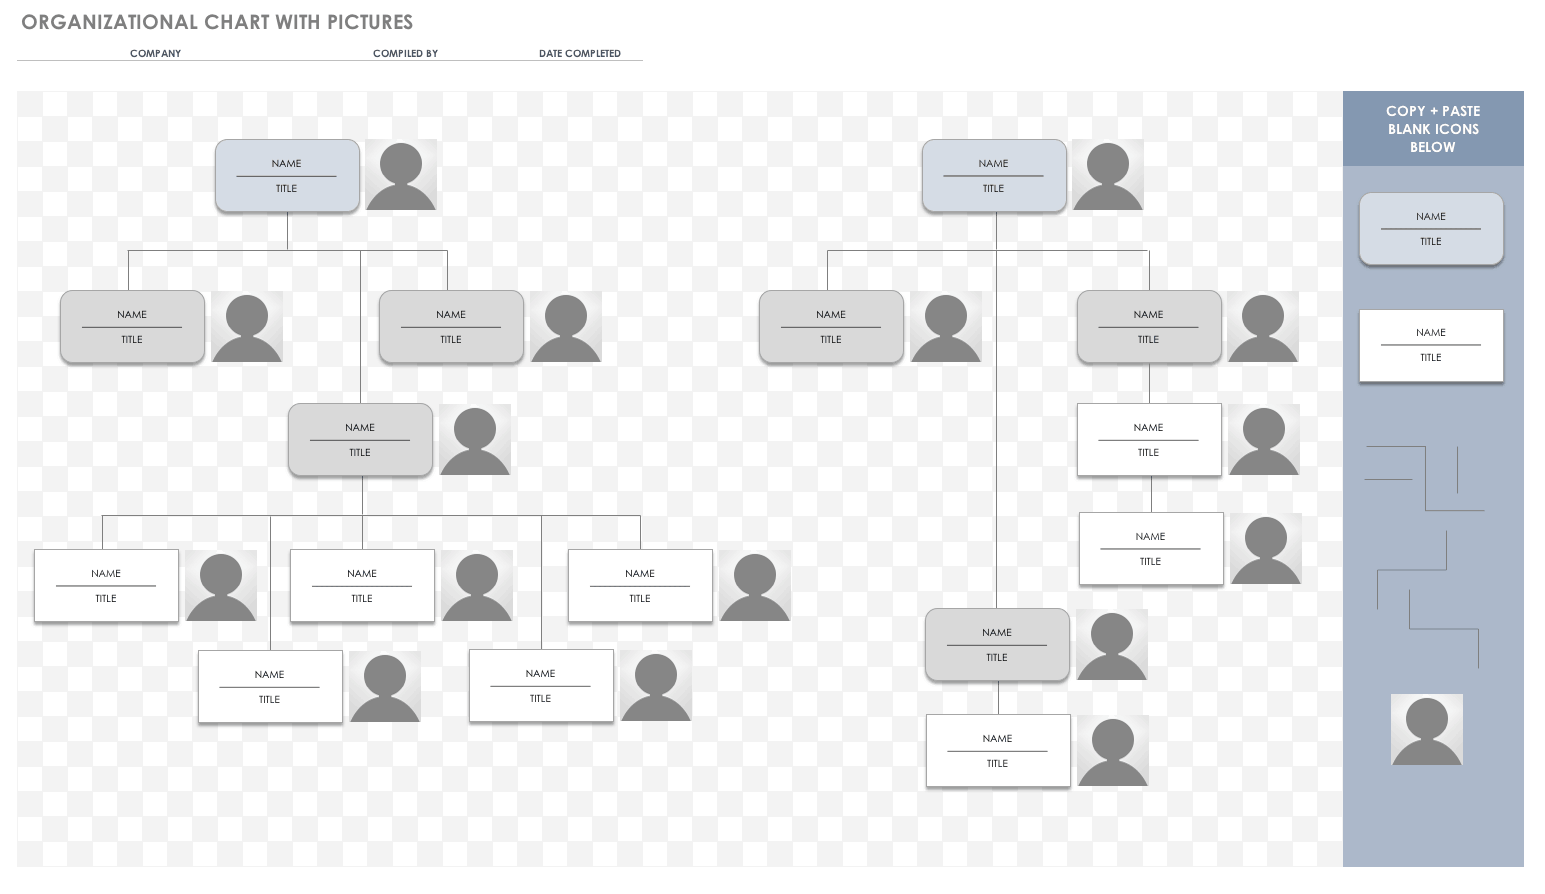
Small Business Organizational Chart with Pictures Template
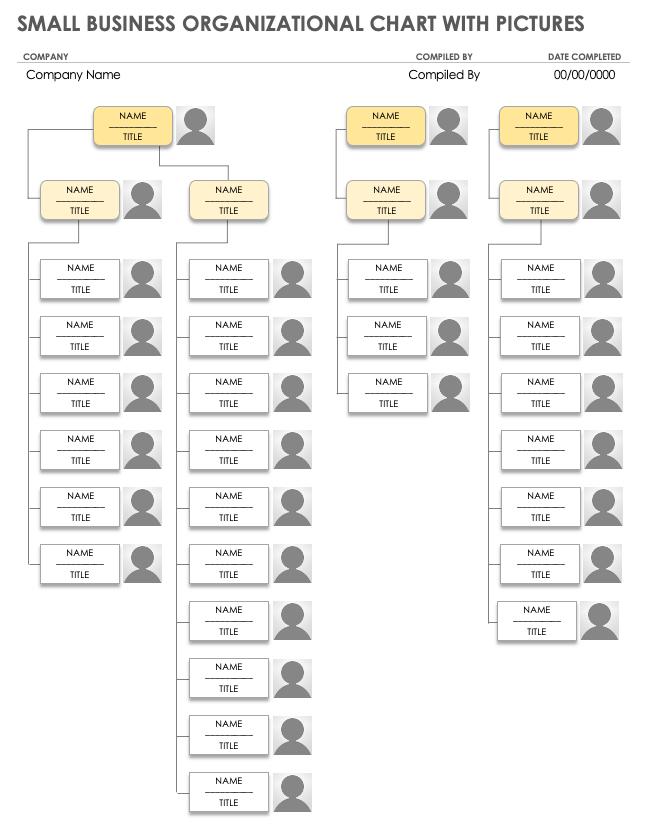
Download Small Business Organizational Chart with Pictures Template
Microsoft Excel | Microsoft Word | Microsoft PowerPoint | Google Slides
Putting a face to a name helps your employees communicate and assume responsibilities more efficiently and effectively. Use this small business organizational chart with pictures template to help employees learn more about their division, department, or team structure. This customizable template allows you to add profile pictures to names and titles to promote familiarity and clarity for reporting.
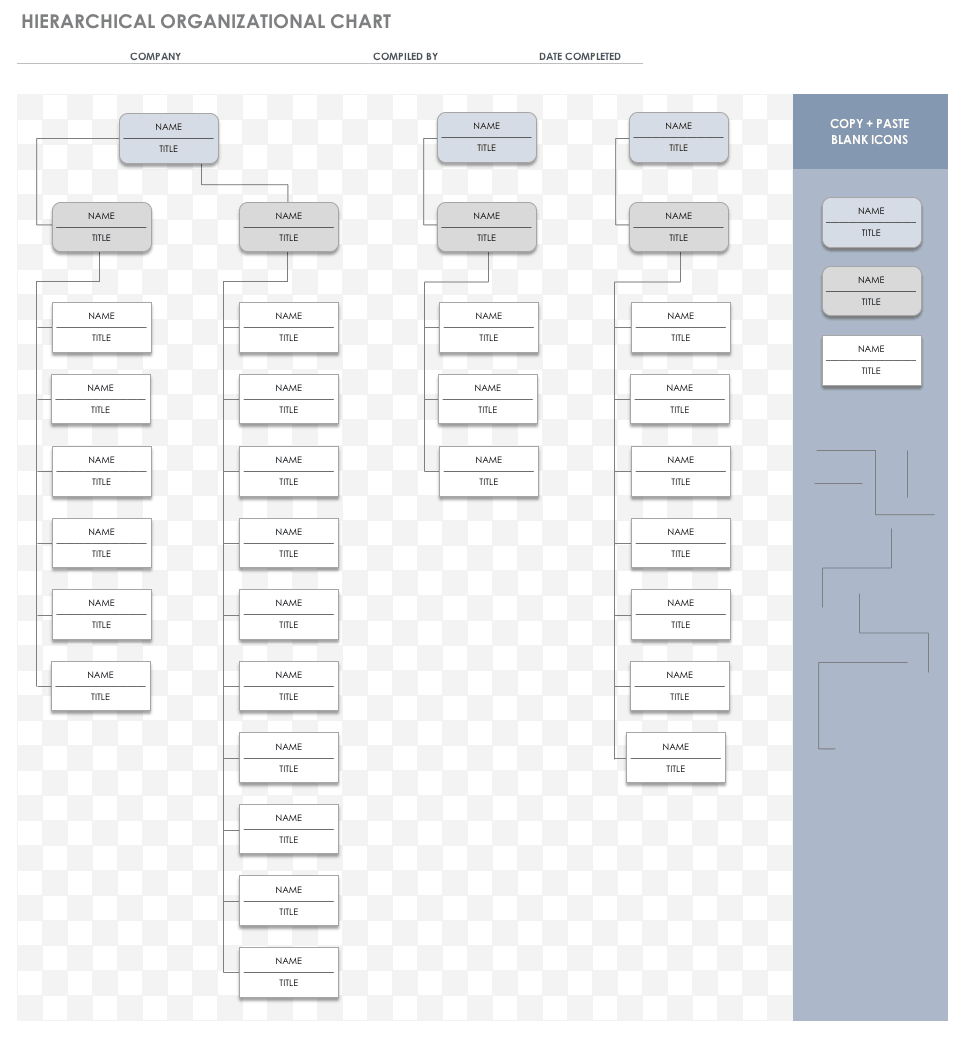
Basic Small Business Horizontal Organizational Chart Template
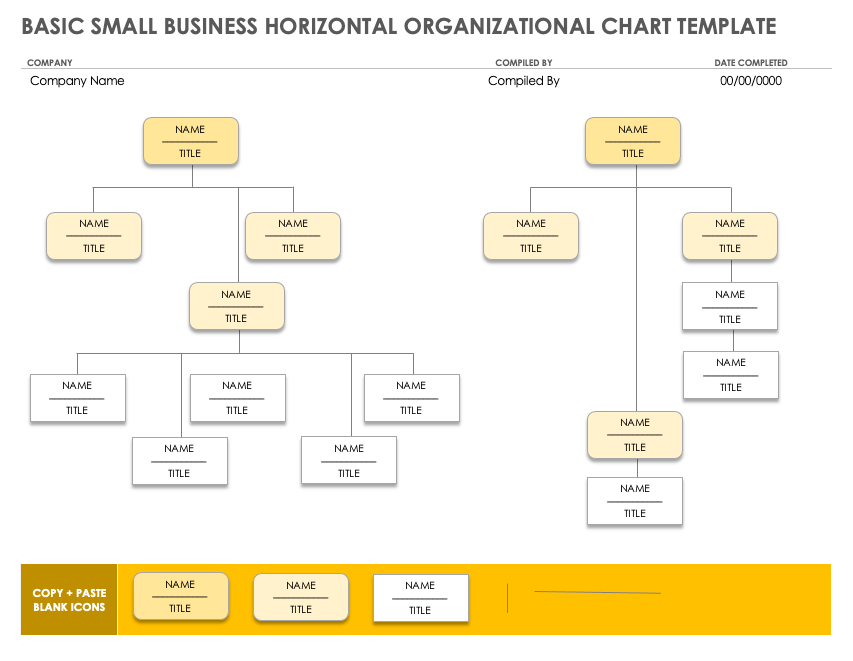
Download Basic Small Business Horizontal Organizational Chart Template
Microsoft Excel | Microsoft Word | Microsoft PowerPoint
Use this basic small business horizontal organizational chart template to map the workflow with fewer levels in your business’s hierarchy. This template maximizes space and identifies areas that need improvement along your organization’s linear process. Copy-and-paste the color-coded blank icons to add names and titles for a complete employee listing in this basic organizational chart template.
Use any of these free organizational chart templates in Excel to highlight your employee roles and their reporting relationships to management.
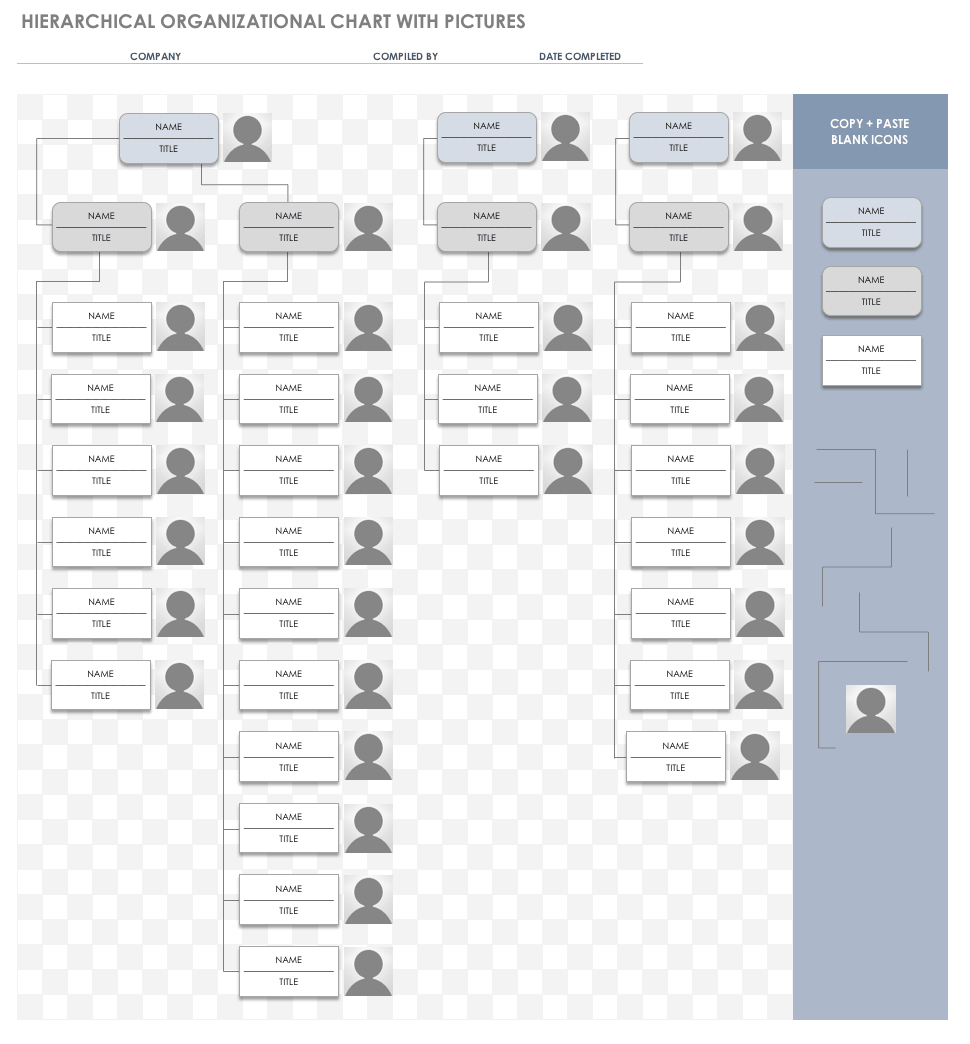
Small Business Horizontal Organizational Chart with Pictures Template
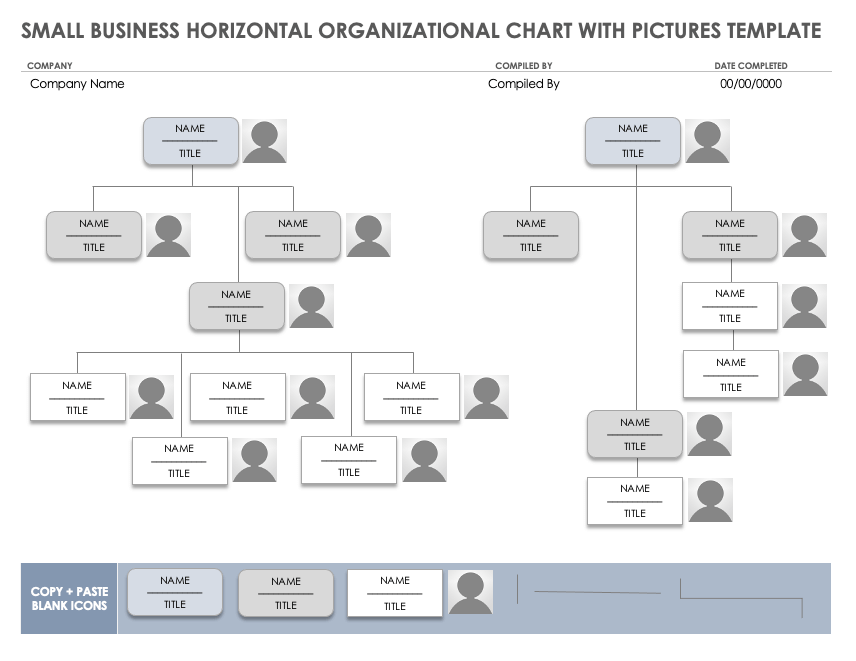
Download Small Business Horizontal Organizational Chart with Pictures Template
Microsoft Excel | Microsoft Word | Microsoft PowerPoint
With fewer middle management levels, a small business horizontal organizational chart displays your structure without wasting space. Use this template to add images of executives and staff to their names and titles so that it’s easier to identify people during presentations, planning, and directories. Add pictures, names, and titles by copying and pasting the color-coded icons to illustrate your organization better.
Small Business Matrix Organizational Chart Template
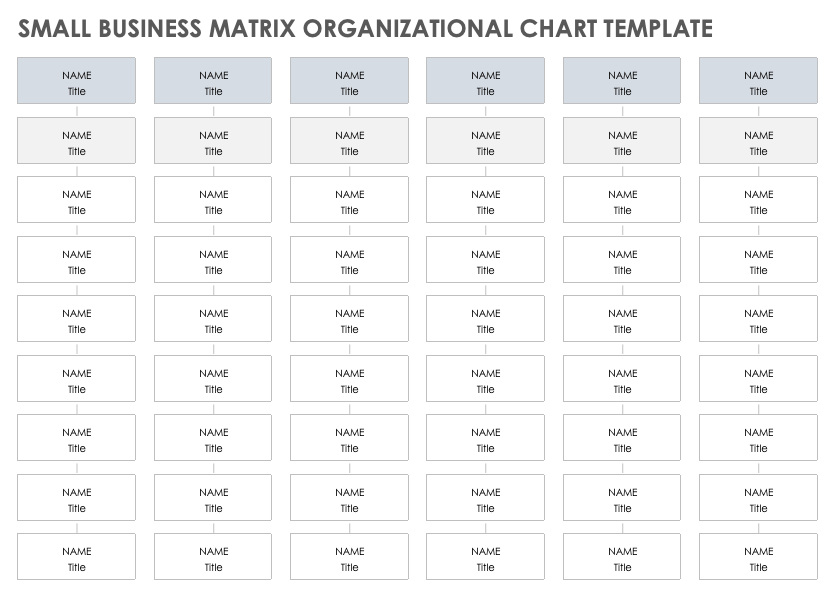
Download Small Business Matrix Organizational Chart Template
Microsoft Excel | Microsoft Word | Microsoft PowerPoint
With shifting reporting relationships in a matrix structure, this small business matrix organizational chart template easily tracks multiple reporting structures. Use this template to illustrate and simplify complex systems where people report to more than one manager and multifunctional work occurs. Track team members as they move between projects and reporting responsibilities.
Sample Small Business Organizational Chart Template
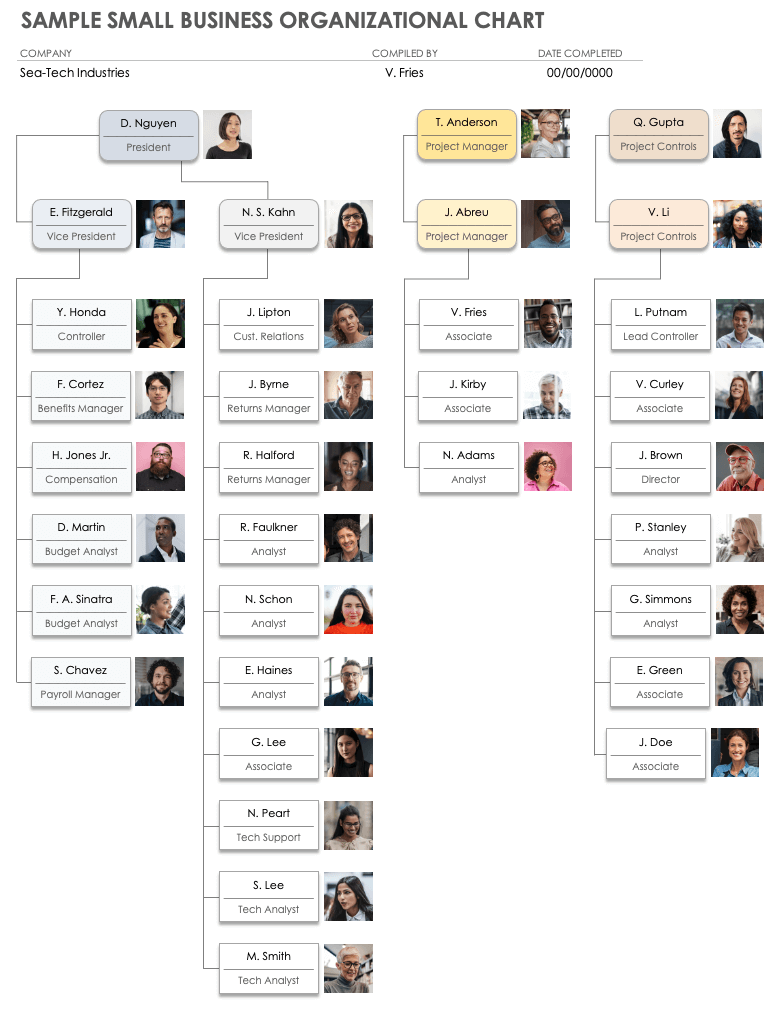
Download Sample Small Business Organizational Chart Template
Microsoft Excel | Microsoft Word | Microsoft PowerPoint
Use this sample small business organizational chart template to replace the sample information with your organization’s names and titles. You can add profile pictures and additional blank icons to illustrate your small business’s organizational structure. This customizable template is ideal for charting your executive, division, department, and team structures for your small business’s directory, planning, or presentation.
Small Business Partnership Organizational Chart Template
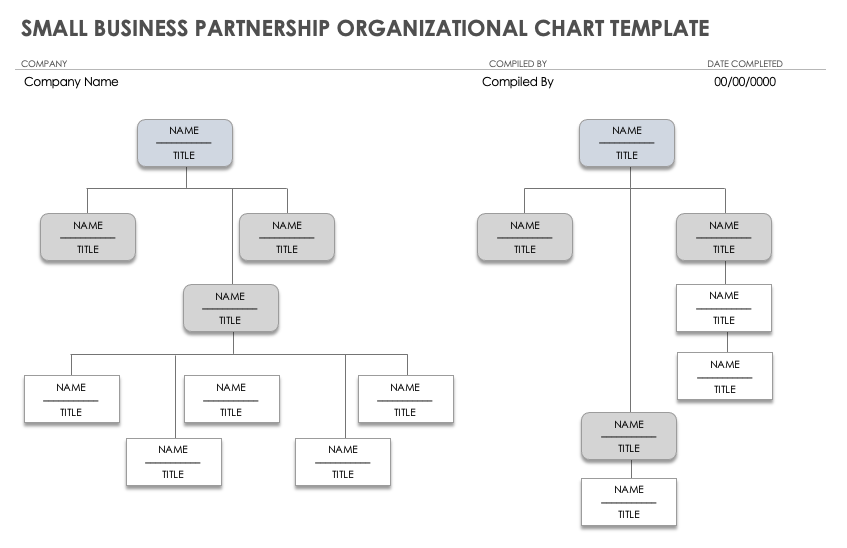
Download Small Business Partnership Organizational Chart Template
Microsoft Excel | Microsoft Word | Microsoft PowerPoint
This small business partnership organizational chart template allows you to illustrate reporting relationships and responsibilities in a business partnership structure. Use this template to copy and paste blank icons to add a partner name and title atop your small business hierarchy. This organizational chart template keeps partners aware of their roles and responsibilities, which helps promote seamless collaboration.
What Is a Small Business Organizational Chart?
A small business organizational chart is a visualization of a business’s structure. It charts a small business’s hierarchy and illustrates employee reporting relationships to determine work responsibilities. A small business organizational chart lists employee and management names and titles.
New employees can use small business organizational charts to learn who reports to whom in their department, making onboarding easier. Employees of all tenures can use organizational charts to familiarize themselves with the names and titles of coworkers and executives. Managers can use these charts to define how employees function within a small business. The utility of an organizational chart goes beyond illustrating reporting structure. Organizational charts can also be helpful in the following ways:
- Managers use organizational charts to strategize growth and assign new projects across departments.
- Small business executives use organizational charts to plan and evaluate restructuring.
- Small business organizational charts allow managers to track workloads to identify workplace inefficiencies.
Most small business organizational charts are pyramid-shaped and best read from top to bottom, with the highest-ranking employees listed at the top. Rows represent management levels, so organizational charts widen at the small business’s lower employee levels. Lines connect chart shapes to represent reporting relationships.
Easily Track the Work of Your Team with Smartsheet
Discover a better way to connect your people, processes, and tools with one simple, easy-to-use platform that empowers your team to get more done, faster.
With Smartsheet, you can align your team on strategic initiatives, improve collaboration efforts, and automate repetitive processes, giving you the ability to make better business decisions and boost effectiveness as you scale.
When you wear a lot of hats, you need a tool that empowers you to get more done in less time. Smartsheet helps you achieve that. Try free for 30 days, today.
Free Organizational Chart Templates for Microsoft Excel
Smartsheet Contributor
Kate Eby
April 25, 2018
An organization chart (also called an organizational chart or org chart) shows the roles and reporting relationships in an organization, such as a team, department, division, or an entire company. The chart can also be used for nonprofits, schools, clubs, sports teams, or any other group that has a multi-level structure. Below, you’ll find a variety of org chart templates in Microsoft Excel format that you can download and customize to fit your needs.
Hierarchical Organization Chart Template — Excel
Most org charts plot hierarchical organizations, which means they can also be hierarchical and show reporting relationships up the chain. Use this template to show the structure of a company, division, team, or other group, a view of who reports to whom, the title for each position, and the name of the person currently in each role.
Download Hierarchical Organization Chart Template — Excel
Hierarchical Org Chart with Pictures Template — Excel
This template is similar to the hierarchical organization chart template above, but you can also add an image for each person listed. Adding a picture to the chart is useful to help new employees become familiar with the people they see around the office and their roles.
Download Hierarchical Org Chart with Pictures Template — Excel
Matrix Org Chart Template — Excel
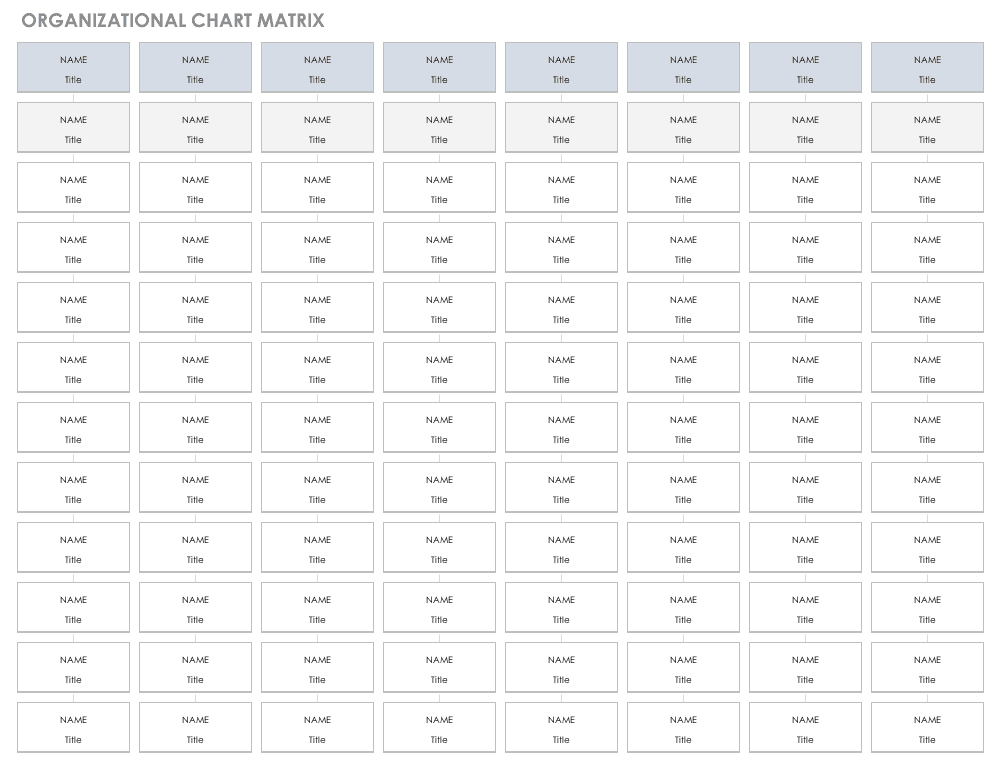
In matrix organizations, employees can report to more than one boss — therefore, they tend to be more fluid than hierarchical organizations because of changing reporting relationships. Typically, each individual contributor has a resource manager and a functional manager. The functional manager changes as a contributor moves from project to project throughout an organization. Use this template to keep track of the assignments if you work in a matrix structure.
Download Matrix Org Chart Template — Excel
Horizontal Organization Chart Template — Excel
The horizontal chart is good for process-focused organizations. It shows the flow of work on a product or service as it moves from one person to the next. If your organization is based on linear processes, use this template to track how products or services are created, so that you can identify areas for improvement.
Download Horizontal Org Chart Template — Excel
Horizontal Org Chart Template with Pictures — Excel
Horizontal org charts are useful for illustrating the flow of work from position to position in process-focused organizations. Similar to the horizontal org chart template for Excel listed above, this chart provides a space to add pictures of the employees working on the product or service.
Download Horizontal Org Chart Template with Pictures — Excel
Origin of the Organization Chart
In its modern form, the organization chart is attributed to engineer Daniel McCallum and artist George Holt Henshaw. Their chart illustrated the hierarchy of the New York and Erie railroad and showed both the positions and locations where each person worked.
In the first part of the 20th century, the name “organization chart” made its way into the English vocabulary, with its use peaking in the 1960s. However, the term continues to be in regular use, according to the Google ngram viewer.
Utility and Benefits of an Org Chart
Today, company staff can use org charts to determine who reports to whom, who fills a role, or who is responsible for a particular task or project. New employees may use an org chart to familiarize themselves with the structure of their team, department, or other parts of the company.
You can also use an org chart to help with planning projects (by showing the people available for deployment), estimating workload for teams, as a roadmap for growth (by identifying where you can create new positions), or to help find and map inefficiencies in a workplace (by illustrating areas of redundancy).
What Org Charts Can’t Do
While org charts are handy tools to answer certain questions, they don’t do everything. You can’t suss the following information out of an org chart:
- Budget-related information
- Operational details
- The complexity of interoffice relationships
- Any informal communication channels
Also, if temporary employees and contractors have a high rate of turnover, keeping track of them requires frequent updates.
How to Create an Org Chart
The SmartArt feature in Excel has some basic formats that allow you to create simple org charts. However, depending on your preference, you can also create an org chart in Microsoft Word, Visio, LucidChart, and other programs. Visit our article to learn how to create an org chart and what should be included.
Make Better Decisions, Faster by Creating Org Charts in Smartsheet
Empower your people to go above and beyond with a flexible platform designed to match the needs of your team — and adapt as those needs change.
The Smartsheet platform makes it easy to plan, capture, manage, and report on work from anywhere, helping your team be more effective and get more done. Report on key metrics and get real-time visibility into work as it happens with roll-up reports, dashboards, and automated workflows built to keep your team connected and informed.
When teams have clarity into the work getting done, there’s no telling how much more they can accomplish in the same amount of time. Try Smartsheet for free, today.