
This is the second part of the Black-Scholes Excel guide covering Excel calculations of option Greeks (delta, gamma, theta, vega, and rho) under the Black-Scholes model.
Calculating Black-Scholes Greeks in Excel
I will continue in the example from the first part to demonstrate the exact Excel formulas. See the first part for details on parameters and Excel formulas for d1, d2, call price, and put price.
Here you can find detailed explanations of all the Black-Scholes formulas.
Here you can see how everything works together in Excel in the Black-Scholes Calculator.

Delta in Excel
Delta is different for call and put options. The formulas for delta are relatively simple and so is the calculation in Excel.


I calculate call delta in cell V44, continuing in the example from the first part, where I have already calculated the two individual terms in cells M44 and S44:
=M44*S44
The calculation of put delta is almost the same, using the same cells. Just add minus one and don’t forget the brackets:
=S44*(M44-1)
Gamma in Excel
The formula for gamma is the same for calls and puts. It is slightly more complicated than the delta formulas above:

Notice especially the second part of the formula:

You will find this term in the calculation of theta and vega too. It is the standard normal probability density function for -d1. In Excel the formula looks like this:
=EXP(-1*POWER(K44,2)/2)/SQRT(2*PI())… where K44 is the cell where you have calculated d1 (see first part).
Alternatively, you can use the NORM.DIST Excel function, which I have also explained in the first part. The only difference from the first part is that the last parameter (cumulative) is now FALSE. Don’t forget the minus sign before K44:
=NORM.DIST(-K44,0,1,FALSE)These two formulas must return the same result.
In the example from the Black-Scholes Calculator I use the first formula. The whole formula for gamma (same for calls and puts) is:
=EXP(-1*POWER(K44,2)/2)/SQRT(2*PI())*S44/(A44*J44)
Theta in Excel
Theta has the longest formulas of all the five most common option Greeks. It is different for calls and puts, but the differences are again just a few minus signs here and there and you must be very careful. Theta is very small for many options, which makes it often hard to detect a possible error in your calculations.


Although it looks complicated, all the symbols and terms in the formulas should be already familiar from the calculations of option prices and delta and gamma above. One exception is the T at the beginning of the formulas.
T is the number of days per year. You can choose either calendar days (T=365 or 365.25) or trading days (T=252 or something similar, depending on where you trade). Based on your selection, the interpretation of theta will then be either option price change in one calendar day or option price change in one trading day.
Call Option Theta
The whole formula for call theta in our example is in cell X44. It is long and uses several (10) other cells, but there is no high mathematics:
=(-(A44*EXP(-1*POWER(K44,2)/2)/SQRT(2*PI())*C44*S44/(2*SQRT(G44)))-(D44*R44*O44)+(E44*A44*M44*S44))/IF($C$20=2,'Time Units'!$D$4,'Time Units'!$D$3)
The last line of the formula in the screenshot above is the T. Cell C20 in the calculator contains a combo where users select calendar days or trading days. Cells D3 and D4 in the sheet Time Units contain the number of calendar and trading days per year. If you want to keep it simple, you can replace the whole last line of the formula with a fixed number, such as 365.
You can again find the explanation of all the individual cells in the first part or see all these Excel calculations directly in the calculator.
Put Option Theta
Analogically to call theta, the formula for put theta in cell AD44 is:
=(-(A44*EXP(-1*POWER(K44,2)/2)/SQRT(2*PI())*C44*S44/(2*SQRT(G44)))+(D44*R44*P44)-(E44*A44*N44*S44))/IF($C$20=2,'Time Units'!$D$4,'Time Units'!$D$3)
Vega in Excel
The formula for vega is the same for calls and puts:

There is nothing new. You can again see the familiar term at the end.
In the calculator example I calculate vega in cell Y44:
=EXP(-1*POWER(K44,2)/2)/SQRT(2*PI())*S44*A44*SQRT(G44)/100
Rho in Excel
Rho is again different for calls and puts. There are two more minus signs in the put rho formula.


In the calculator example I calculate call rho in cell Z44. It is simply a product of two parameters (strike price and time to expiration) and cells that I have already calculated in previous steps:
=B44*G44*Q44*O44/100
I calculate put rho in cell AF44, again as product of 4 other cells, divided by 100. Make sure to put the minus sign to the beginning:
=-B44*G44*Q44*P44/100
More about Option Greeks in Excel
You can also use Excel and the calculations above (with some modifications and improvements) to model behaviour of individual option Greeks and option prices in different market situations (changes in the Black-Scholes model parameters). That is beyond the scope of this guide, but you can find it in the Black-Scholes Calculator.
VsCap: How to calculate option Greeks in Excel
A very basic beginners guide to valuing options in excel. Useful for anyone looking to start a model based on pricing or trading options.

Related Trading Articles
- Trading Day Care- 11/18/21 – Using Greeks to calculate option price on our SPY 472C
11/18/21 — Using Greeks to calculate option price on our SPY 472C Dec 3 expo…just before the AAPL calls we were holding in the … - Trade From MS Excel using Option Greeks | Zerodha and AliceBlue | Using python code
Get live Option Greeks of any symbol strike in excel and place order from excel. Speed up your day trading process using excel. - 3 WAYS TO EXCEL IN OPTION DERIVATIVES (1 -OPTION CHAIN 2 -OPTION GREEKS 3 -ITM
3 ways to excel in option derivatives, involves the use of option chain, option greeks and In-The-Money Probability. All of it on … - AUTOMATE – OPTION GREEKS REALTIME EXCEL CALCULATOR
Fundamental analysis of Indian Stocks of NSE & BSE. To open trading DEMAT account with ZERODHA, click below: … - Options Greeks in Excel via Function & Option chain corrected
Bhavcopy CM, FO Delivery report , Option Chain with Greeks, Automated Option Strategies Options PayOff graph EOD Report for Options on all FNO stocks and … - Black-Scholes-Merton (BSM) Option Pricing Model (with Greeks) in Excel – PART 1
Some time back, my student asked for my help to build a calculator to calculate call and put option prices and the option greeks. So, I thought I will just do a … - Black-Scholes-Merton (BSM) Option Pricing Model (with Greeks) in Excel – PART 2
Continuing from my Part 1 video ( now we will calculate the option Greeks (delta, gamma, vega, theta, and … - How to Calculate Option Greeks? | Rashmith Shetty
Open Trading A/C at Zerodha — In this video i have explained about calculation of Option Greeks, Using Spot Price, Strike Price, Expiry … - FRM: Using Excel to calculate Black-Scholes-Merton option price
This is Black-Scholes for a European-style call option. You can download the XLS @ this forum thread on our website at - How to use OPTION GREEKS to calculate calendar call spreads profit/risk
Содержание
- Binomial Option Pricing Excel
- A Primer on Binomial Option Pricing
- Valuing Price of Options with Known Dividend Yield
- Lets get into action with Excel
- Options Pricing & Valuation models Start the discussion!
- What is an Option?
- Call Option vs. Put Option
- Option Pricing Models
- Black-Scholes Excel Formulas and How to Create a Simple Option Pricing Spreadsheet
- Black-Scholes in Excel: The Big Picture
- Black-Scholes Inputs
- Black-Scholes d1 and d2
- Black-Scholes Option Price Excel Formulas
- N(d1), N(d2), N(-d2), N(-d1)
- The Terms with Exponential Functions
- Call Option Price
- Put Option Price
- Black-Scholes Greeks in Excel
Binomial Option Pricing Excel
A Primer on Binomial Option Pricing
A binomial tree represents the different possible paths a stock price can follow over time.To define a binomial tree model, a basic period length is established, such as a month. If the price of a stock is known at the beginning of a period, the price at the beginning of the next period is one of two possible values.
Two possibilities are defined to be multiples of the price at the previous period minus a multiple of u, for an upward movement and multiple of d, for a downward movement. Both u and d are positive, with u > 1 and d 
A two-step binomial tree may appear simplistic, but by carefully selecting the values of u and d, and making the steps smaller, a binomial tree can be made to closely resemble the path of a stock over any period of time. A two-period option value is found by working backward a step at a time. In this article, we will develop a model to estimate the price of an European options (both calls and puts) on stocks with known dividend yields using Excel. We will use a 9-step Cox, Ross, and Rubinstein or a CRR binomial tree.
An American option offers the possibility of early exercise before the expiration date of option. For call options on a stock that pays no dividends prior to expiration, early exercise is never optimal, given that prices are such that no arbitrage is possible.
Valuing Price of Options with Known Dividend Yield
The Black-Scholes techniques can be used to calculate European options on stocks with known dividend yields. Binomial trees can be used to value both American and European options on dividend-yielding stocks. If we know that a stock will pay only one dividend within the period for which we are building a binomial tree, we can compute Present Value of the dividend, subtract it from the initial price of the stock, and treat the remainder as its uncertain component.
We thus build the tree by using the uncertain component of the stock price. The present value will get larger as we travel closer to the time of the dividend payment. The same methodology can be used if there are multiple dividend payments during the time covered by the tree.
A two-stage tree representing a two-period call option can be expressed by –
Cuu = max (u 2 S – K, 0)
Cud = max (udS – K, 0)
Cdd = max (d 2 S – K, 0)
The price of Stock can be modified by up and down factors u and d while moving through the tree. The values shown in the tree are those of call option with strike price K and expiration time corresponding to the final node in the tree. For a tree with multiple periods, the single-period, risk-free discounting is repeated at every node of the lattice, starting from the final period and working backward towards t=0.
Cox, Ross, and Rubinstein (CRR) have shown that if we chose the parameter for a binomial tree and probability of up movement as follows, then the tree closely follows the mean and variance of the stock price over short intervals and we can use risk-neutral evaluation.


The risk neutral probability than becomes,


In the above equations, σ represents the volatility of the underlying stock, q is the constant dividend yield, and Δt is the length of each step. For stocks that do not pay dividends, q will simply be 0.
Lets get into action with Excel
Consider a stock with volatility of σ = 20%. The current price of the stock is $62. The annual dividend is 3%. A certain call option on this stock has an expiration date of 5 months from now and a strike price of $60. The current risk free interest rate is 10%, compounded monthly.
Upward Movement or u = EXP(0.20 X SQRT(0.42/9)) = 1.04
Downward Movement or d = 1/u = 0.96
Let us dive into the implementation part of Binomial Option Pricing Excel example. Simply enter the inputs;
- Current Stock Price,
- Strike or Exercise price
- Put or Call option type
- Risk Free Interest Rate
- Dividend Yield, Volatility %
- Time to Expiration
- No. of Steps

The spreadsheet builds the tree and gives you the following output; Up Factor u, Down Factor d, Risk Neutral probability, and finally the option price.

The VBA in the spreadsheet conveniently builds a binomial tree in the shape of a triangle. A 9-step tree will take the shape of a triangle which is one half of a 10 X 10 rectangle, and the values can either occupy the upper triangle or the lower triangle. The upward movement values occupy the upper triangle. The downward movement values occupy the lower triangle. The columns represent the the successive steps and are numbered starting from 0.
The difference in calculating the price of a call and a put option occurs at the nodes at expiration. These values are driven by the parameter “Put or Call” indicator with values of -1 and +1. There is no need to build separate models or Puts and Calls.

The tree has been constructed for illustrating the stock and option price upward and downward movements. Because we can use Black-Scholes-Merton equations to calculate exact prices for European options with known dividend yields, binomial trees are not necessary.
 Download Binomial Option Pricing Excel
Источник
Options Pricing & Valuation models Start the discussion!

What is an Option?
• An option is a financial derivative which means it derives its value from another financial security. An option writer sells the option to an option buyer. The agreed-on price between the two parties is called the strike price and there is always a specified date which signifies when the option expires. You can exercise your right to buy or sell the option. This means you do not have to buy or sell if you do not want to. If you hold an American option, then you can exercise your right on the option any time before the expiration date. If you hold a European option, you can only exercise your right on the expiration date. They are mainly used to speculate or hedge any of your current holdings.
Call Option vs. Put Option
• A call option allows the buyer to buy the underlying security at the strike price. In this situation, the buyer would want the price of the stock to be higher than the strike price because the buyer pays the agreed upon strike price. This allows the buyer to sell the stock at the current market price and make a profit from it. If you write a call option, you believe that the price of the stock will either drop or stay the same. The profit that a writer can make from selling a call option is the difference between the price of the stock and the strike price, the premium.
• A put option allows the buyer of the option to sell the underlying security at the strike price. A buyer of a put option wants the price of the security to drop because the buyer can sell the security at a strike price that is higher than the market price. However, a put option writer wants the price of the security to raise above the strike price because the buyer would have to sell it to them at a lower price.
Option Pricing Models
• Two ways to price options are the Black-Scholes model and the Binomial model. The Black-Scholes model is used to find to find a call price by using the current stock price, strike price, the volatility, risk free interest rate, and the time until the option expires. The Binomial model uses a tree of stock prices that is broken down into intervals. This tree represents the potential value of a stock from the present date and until the expiration. From this, one can find the value of the option with the strike price, volatility, risk free interest rate and the stock price at expiration date.
Источник
Black-Scholes Excel Formulas and How to Create a Simple Option Pricing Spreadsheet
This page is a guide to creating your own option pricing Excel spreadsheet, in line with the Black-Scholes model (extended for dividends by Merton). Here you can get a ready-made Black-Scholes Excel calculator with charts and additional features such as parameter calculations and simulations.
Black-Scholes in Excel: The Big Picture
If you are not familiar with the Black-Scholes model, its assumptions, parameters, and (at least the logic of) the formulas, you may want to read those pages first (overview of all Black-Scholes resources is here).
Below I will show you how to apply the Black-Scholes formulas in Excel and how to put them all together in a simple option pricing spreadsheet. There are four steps:
- Design cells where you will enter parameters.
- Calculate d1 and d2.
- Calculate call and put option prices.
- Calculate option Greeks.
Black-Scholes Inputs
First you need to design six cells for the six Black-Scholes parameters. When pricing a particular option, you will have to enter all the parameters in these cells in the correct format. The parameters and formats are:
S = underlying price (USD per share)
K = strike price (USD per share)
σ = volatility (% p.a.)
r = continuously compounded risk-free interest rate (% p.a.)
q = continuously compounded dividend yield (% p.a.)
t = time to expiration (% of year)
Underlying price is the price at which the underlying security is trading on the market at the moment you are doing the option pricing. Enter it in dollars (or euros/yen/pound etc.) per share.
Strike price, also called exercise price, is the price at which you will buy (if call) or sell (if put) the underlying security if you choose to exercise the option. If you need more explanation, see: Strike vs. Market Price vs. Underlying Price. Enter it also in dollars per share (it must have same units as underlying price, also with the same contract or lot multipliers).
Volatility is the most difficult parameter to estimate (all the other parameters are more or less given). It is your job to decide how high volatility you expect and what number to enter – neither the Black-Scholes model, nor this page will tell you how high volatility to expect with your particular option (for more on that, see the volatility tutorials, particularly historical and implied volatility). Being able to estimate (= predict) volatility with more success than other people is the hard part and key factor determining success or failure in option trading. The important thing here is to enter it in the correct format, which is % p.a. (percent annualized).
Risk-free interest rate should be entered in % p.a., continuously compounded. The interest rate’s tenor (time to maturity) should match the time to expiration of the option you are pricing. You can interpolate the yield curve to get the interest rate for your exact time to expiration. Interest rate does not affect the resulting option price very much in the low interest environment that we’ve had in the recent years, but it can become very important when rates are higher (for more details on the effect of interest rates on option prices see the option rho tutorial).
Dividend yield should also be entered in % p.a., continuously compounded. If the underlying stock doesn’t pay any dividend, enter zero. If you are pricing an option on securities other than stocks, you may enter the second country interest rate (for FX options) or convenience yield (for commodities) here.
Time to expiration should be entered as % of year between the moment of pricing (now) and expiration of the option. For example, if the option expires in 24 calendar days, enter 24/365 = 6.58%. Alternatively, you can measure time in trading days rather than calendar days. If the option expires in 18 trading days and there are 252 trading days per year, you will enter time to expiration as 18/252 = 7.14%. You can also be more precise and measure time to expiration to hours or even minutes. In any case you must always express the time to expiration as % of year in order for the calculations to return correct results (it is very easy in Excel – just divide the number of days to expiration by the number of days per year).
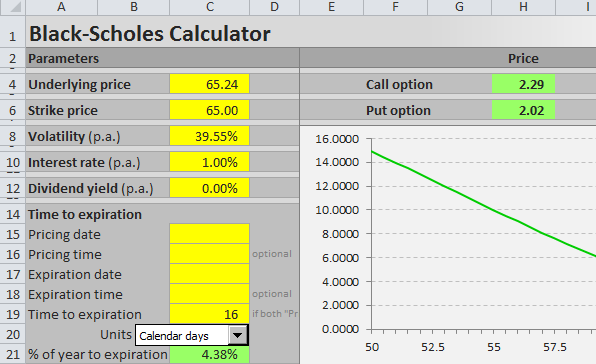
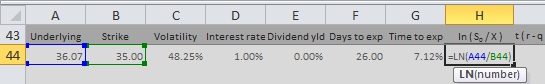
I will illustrate the calculations on the example below. The parameters are in cells A44 (underlying price), B44 (strike price), C44 (volatility), D44 (interest rate), E44 (dividend yield), and G44 (time to expiration as % of year).
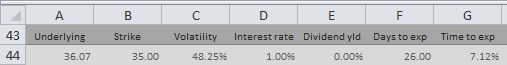
Note: It is row 44, because I am using the Black-Scholes Calculator for screenshots and it has charts in the rows above. You can of course start in row 1 or arrange your calculations in a column.
Black-Scholes d1 and d2
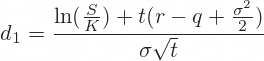
When you have the cells with parameters ready, the next step is to calculate d1 and d2, because these terms then enter all the calculations of call and put option prices and Greeks. The formulas for d1 and d2 are:

All the operations in these formulas are relatively simple mathematics. The only things that may be unfamiliar to some less savvy Excel users are the natural logarithm ( LN Excel function) and square root ( SQRT Excel function).
The hardest thing with the d1 formula is making sure you put the brackets in the right places. This is why you may want to calculate individual parts of the formula in separate cells, as I do in the example below:
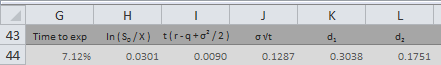
First I calculate the natural logarithm of the ratio of underlying price and strike price (this is why they must have the same units) in cell H44:
Then I calculate the rest of the numerator of the d1 formula in cell I44:
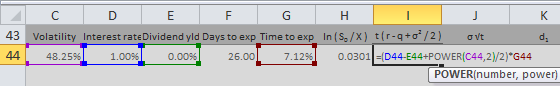
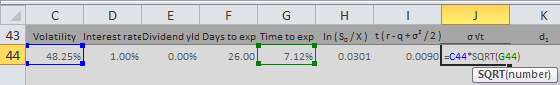
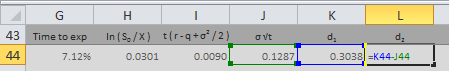
Then I calculate the denominator of the d1 formula in cell J44. Another reason why you may want to calculate d1 in separate parts is that this term will also enter the formula for d2:
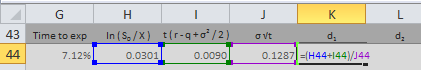
Now I have all the three parts of the d1 formula and I can combine them in cell K44 to get d1:
Finally, I calculate d2 in cell L44:
Black-Scholes Option Price Excel Formulas
The Black-Scholes formulas for call option (C) and put option (P) prices are:


The two formulas are very similar. There are four terms in each formula. I will again calculate them in separate cells first and then combine them in the final call and put formulas.
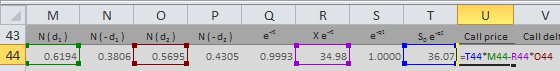
N(d1), N(d2), N(-d2), N(-d1)
N(x) denotes the standard normal cumulative distribution function:
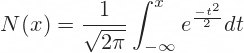
For example, N(d1) is the standard normal cumulative distribution function for the d1 that we have calculated in the previous step.
In Excel you can easily calculate the standard normal cumulative distribution functions using the NORM.DIST function, which has four parameters:
- x = link to the cell where you have calculated d1 or d2 (with minus sign for -d1 and -d2)
- mean = enter 0, because it is standard normal distribution
- standard_dev = enter 1, because it is standard normal distribution
- cumulative = enter TRUE, because it is cumulative
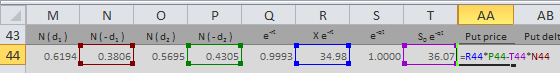
For example, I calculate N(d1) in cell M44:
Note: There is also the NORM.S.DIST function in Excel, which is the same as NORM.DIST with fixed mean = 0 and standard_dev = 1 (therefore you enter only two parameters: x and cumulative). You can use either. NORM.S.DIST may not be available in some spreadsheet software.
The Terms with Exponential Functions
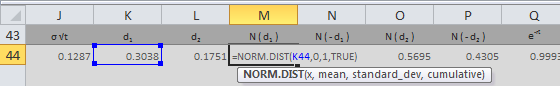
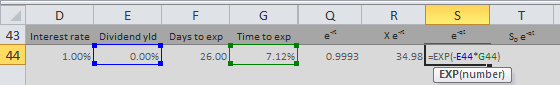
The exponents (e -qt and e -rt terms) are calculated using the EXP Excel function with -q*t or -r*t as parameter.
I calculate e -rt in cell Q44:
Then I use it to calculate K e -rt in cell R44:
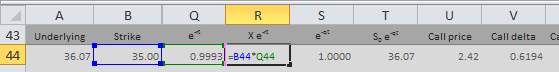
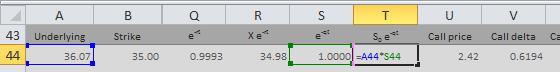
Analogically, I calculate e -qt in cell S44:
Then I use it to calculate S e -qt in cell T44:
Now I have all the individual terms and I can calculate the final call and put option price.
Call Option Price
I combine the four terms in the call formula to get call option price in cell U44:
Put Option Price
I combine the four terms in the put formula to get put option price in cell U44:
Black-Scholes Greeks in Excel
Here you can continue to the second part of this tutorial, which explains Excel calculation of the Greeks: delta, gamma, theta, vega, and rho:
Or you can see how all the Excel calculations work together in the Black-Scholes Calculator. Explanation of the calculator’s other features (parameter calculations and simulations of option prices and Greeks) are available in the calculator’s user guide.
Источник

OPTION CHAIN WITH GREEKS ON EXCEL
- Home
- Services
OPTION CHAIN WITH GREEKS ON EXCEL
The VBA-based excel program calculates the option greeks value of all strike prices of a particular script, and, allows a user to identify opportunities, be it in terms of option buying or option writing, and, thus ensures a good profit margin. The program also calculates the ITM probability of each OTM strike price, which, renders a user to choose from various strike prices at the time of expiry.
The excel based VBA program is an excellent tool in the hands of a retail trader, allowing them to either book profit or exit the trade completely, based on a more scientific way of trading.
Instructions:
Please go through the below-mentioned video completely and ensure that the program satisfies your requirement, sufficiently. Also, the video shows how to run the program.
The program is designed for two scripts only — NIFTY and BANKNIFTY.
This program is made for educational purposes only.
Please go through the above-mentioned video carefully, to understand the working of the video.
Arha bears no responsibility of whatsoever nature, that shall arise out when used for trading purposes. Arha also clarifies that the program is associated with mere fetching option chain data to excel and nothing beyond that, and thus, anyone modifying the program for their own purposes shall bear all the responsibility towards their action.
It is your responsibility to familiarize yourself with the program and its aspects. By placing an order for the product, you indicate that you have read this rule and understood it clearly, as no refund will be made once the purchase is done. If you do not agree with or fully accept the terms of this refund policy, we ask that you do not place an order with us.
For any reasons, if the download link is not available after successful payment, please write to us at investwitharha@gmail.com
Excel Price Feed provides several Excel formulas which use the Black-Scholes option pricing model. They include a formula for calculating the theoretical price of an option as well as formulas for the most commonly used «Greeks».
All formulas require percentages to be expressed in fractions of 100, for example 25% is 0.25.
Please note that Excel Price Feed also includes formulas for retrieving Option Chains from Yahoo Finance.
EPF.BlackScholes.Premium
This formula calculates the theoretical price (premium) of an option using the Black-Scholes option pricing formula.
=EPF.BlackScholes.Premium(optionType, underlyingPrice, strikePrice, timeToExpiry, volatility, interestRate, dividendYield)
The input parameters required are:
| Parameter | Description |
|---|---|
| Option Type | The type of option, either Put or Call. Can be specified as «Put» or «P» or «Call» or «C». |
| Underlying Price | The current price of the underlying instrument. |
| Strike Price | The strike price of the option. |
| Time To Expiry | The time to expiration of the option, expressed as % of a year. |
| Volatility | The volatility. |
| Interest Rate | The continuously compounded risk-free interest rate. |
| Dividend Yield | The continuously compounded dividend yield of the underlying. |
EPF.BlackScholes.Delta
This formula calculates the Delta of an option using the Black-Scholes option pricing formula. Delta is the amount that an option changes with respect to a small change in the underlying.
=EPF.BlackScholes.Delta(optionType, underlyingPrice, strikePrice, timeToExpiry, volatility, interestRate, dividendYield)
The input parameters required are:
| Parameter | Description |
|---|---|
| Option Type | The type of option, either Put or Call. Can be specified as «Put» or «P» or «Call» or «C». |
| Underlying Price | The current price of the underlying instrument. |
| Strike Price | The strike price of the option. |
| Time To Expiry | The time to expiration of the option, expressed as % of a year. |
| Volatility | The volatility. |
| Interest Rate | The continuously compounded risk-free interest rate. |
| Dividend Yield | The continuously compounded dividend yield of the underlying. |
EPF.BlackScholes.Gamma
This formula calculates the Gamma of an option using the Black-Scholes option pricing formula. Gamma quantifies the rate of change of the delta with respect to a change in the underlying.
=EPF.BlackScholes.Gamma(underlyingPrice, strikePrice, timeToExpiry, volatility, interestRate, dividendYield)
The input parameters required are:
| Parameter | Description |
|---|---|
| Underlying Price | The current price of the underlying instrument. |
| Strike Price | The strike price of the option. |
| Time To Expiry | The time to expiration of the option, expressed as % of a year. |
| Volatility | The volatility. |
| Interest Rate | The continuously compounded risk-free interest rate. |
| Dividend Yield | The continuously compounded dividend yield of the underlying. |
EPF.BlackScholes.Theta
This formula calculates the Theta of an option using the Black-Scholes option pricing formula. Theta quantifies the amount that an option decays in one day.
=EPF.BlackScholes.Theta(optionType, underlyingPrice, strikePrice, timeToExpiry, volatility, interestRate, dividendYield)
The input parameters required are:
| Parameter | Description |
|---|---|
| Option Type | The type of option, either Put or Call. Can be specified as «Put» or «P» or «Call» or «C». |
| Underlying Price | The current price of the underlying instrument. |
| Strike Price | The strike price of the option. |
| Time To Expiry | The time to expiration of the option, expressed as % of a year. |
| Volatility | The volatility. |
| Interest Rate | The continuously compounded risk-free interest rate. |
| Dividend Yield | The continuously compounded dividend yield of the underlying. |
EPF.BlackScholes.Rho
This formula calculates the Rho of an option using the Black-Scholes option pricing formula. Rho quantifies the change of an options value with respect to a change in the interest rate.
=EPF.BlackScholes.Rho(optionType, underlyingPrice, strikePrice, timeToExpiry, volatility, interestRate, dividendYield)
The input parameters required are:
| Parameter | Description |
|---|---|
| Option Type | The type of option, either Put or Call. Can be specified as «Put» or «P» or «Call» or «C». |
| Underlying Price | The current price of the underlying instrument. |
| Strike Price | The strike price of the option. |
| Time To Expiry | The time to expiration of the option, expressed as % of a year. |
| Volatility | The volatility. |
| Interest Rate | The continuously compounded risk-free interest rate. |
| Dividend Yield | The continuously compounded dividend yield of the underlying. |