
Excel for Microsoft 365 Excel for Microsoft 365 for Mac Excel for the web Excel 2021 Excel 2021 for Mac Excel 2019 Excel 2019 for Mac Excel 2016 Excel 2016 for Mac Excel 2013 Excel 2010 Excel 2007 Excel for Mac 2011 Excel Starter 2010 More…Less
This article describes the formula syntax and usage of the NPV function in Microsoft Excel.
Description
Calculates the net present value of an investment by using a discount rate and a series of future payments (negative values) and income (positive values).
Syntax
NPV(rate,value1,[value2],…)
The NPV function syntax has the following arguments:
-
Rate Required. The rate of discount over the length of one period.
-
Value1, value2, … Value1 is required, subsequent values are optional. 1 to 254 arguments representing the payments and income.
-
Value1, value2, … must be equally spaced in time and occur at the end of each period.
-
NPV uses the order of value1, value2, … to interpret the order of cash flows. Be sure to enter your payment and income values in the correct sequence.
-
Arguments that are empty cells, logical values, or text representations of numbers, error values, or text that cannot be translated into numbers are ignored.
-
If an argument is an array or reference, only numbers in that array or reference are counted. Empty cells, logical values, text, or error values in the array or reference are ignored.
-
Remarks
-
The NPV investment begins one period before the date of the value1 cash flow and ends with the last cash flow in the list. The NPV calculation is based on future cash flows. If your first cash flow occurs at the beginning of the first period, the first value must be added to the NPV result, not included in the values arguments. For more information, see the examples below.
-
If n is the number of cash flows in the list of values, the formula for NPV is:

-
NPV is similar to the PV function (present value). The primary difference between PV and NPV is that PV allows cash flows to begin either at the end or at the beginning of the period. Unlike the variable NPV cash flow values, PV cash flows must be constant throughout the investment. For information about annuities and financial functions, see PV.
-
NPV is also related to the IRR function (internal rate of return). IRR is the rate for which NPV equals zero: NPV(IRR(…), …) = 0.
Example
Copy the example data in the following table, and paste it in cell A1 of a new Excel worksheet. For formulas to show results, select them, press F2, and then press Enter. If you need to, you can adjust the column widths to see all the data.
|
Data |
Description |
|
|---|---|---|
|
0.1 |
Annual discount rate |
|
|
-10000 |
Initial cost of investment one year from today |
|
|
3000 |
Return from first year |
|
|
4200 |
Return from second year |
|
|
6800 |
Return from third year |
|
|
Formula |
Description |
Result |
|
=NPV(A2, A3, A4, A5, A6) |
Net present value of this investment |
$1,188.44 |
Example 2
|
Data |
Description |
|
|---|---|---|
|
0.08 |
Annual discount rate. This might represent the rate of inflation or the interest rate of a competing investment. |
|
|
-40000 |
Initial cost of investment |
|
|
8000 |
Return from first year |
|
|
9200 |
Return from second year |
|
|
10000 |
Return from third year |
|
|
12000 |
Return from fourth year |
|
|
14500 |
Return from fifth year |
|
|
Formula |
Description |
Result |
|
=NPV(A2, A4:A8)+A3 |
Net present value of this investment |
$1,922.06 |
|
=NPV(A2, A4:A8, -9000)+A3 |
Net present value of this investment, with a loss in the sixth year of 9000 |
($3,749.47) |
Top of Page
Need more help?
Содержание
- Задача на нахождение NPV
- Расчет NPV в Excel (пример табличный)
- Расчет NPV в Excel (функция ЧПС)
- Расчет NPV в Excel: заключение
Сегодняшняя публикация будет полезна тем, кто уже знает, что такое NPV и с помощью каких формул этот показатель рассчитывается, но нуждается в простых подручных инструментах, позволяющих рассчитывать NPV быстрее, нежели вручную или с помощью обычных калькуляторов.
Им в помощь многофункциональная среда Excel, позволяющая рассчитать NPV с помощью табличной организации данных либо же с применением специальных финансовых функций.
Разберем гипотетический пример, который решим посредством применения уже известной нам формулы расчета NPV, а затем повторим наши вычисления, используя возможности Excel.
Задача на нахождение NPV
Пример. Первоначальные инвестиции в проект A составляют 10000 рублей. Ежегодная процентная ставка – 10 %. Динамика поступлений с 1-го по 10-ый годы представлена в нижеследующей таблице:
| Период | Притоки | Оттоки |
| 0 | 10000 | |
| 1 | 1100 | |
| 2 | 1200 | |
| 3 | 1300 | |
| 4 | 1450 | |
| 5 | 1600 | |
| 6 | 1720 | |
| 7 | 1860 | |
| 8 | 2200 | |
| 9 | 2500 | |
| 10 | 3600 |
Для наглядности cответствующие данные можно представить графически:

Необходимо рассчитать показатель NPV.
Стандартное решение. Для решения задачи будем использовать уже известную нам формулу NPV:

Просто подставляем в нее известные значения, которые затем суммируем. Для этих вычислений нам пригодится калькулятор:
NPV = -10000/1,10 + 1100/1,11 + 1200/1,12 + 1300/1,13 + 1450/1,14 + 1600/1,15 + 1720/1,16 + 1860/1,17 + 2200/1,18 + 2500/1,19 + 3600/1,110 = 352,1738 рублей.
Расчет NPV в Excel (пример табличный)
Этот же пример мы можем решить, организовав соответствующие данные в форме таблицы Excel.
Выглядеть это должно примерно так:

Для того чтобы получить нужный результат, мы должны соответствующие ячейки заполнить нужными формулами.
| Ячейка | Формула |
| E4 | =1/СТЕПЕНЬ(1+$F$2/100;B4) |
| E5 | =1/СТЕПЕНЬ(1+$F$2/100;B5) |
| E6 | =1/СТЕПЕНЬ(1+$F$2/100;B6) |
| E7 | =1/СТЕПЕНЬ(1+$F$2/100;B7) |
| E8 | =1/СТЕПЕНЬ(1+$F$2/100;B8) |
| E9 | =1/СТЕПЕНЬ(1+$F$2/100;B9) |
| E10 | =1/СТЕПЕНЬ(1+$F$2/100;B10) |
| E11 | =1/СТЕПЕНЬ(1+$F$2/100;B11) |
| E12 | =1/СТЕПЕНЬ(1+$F$2/100;B12) |
| E13 | =1/СТЕПЕНЬ(1+$F$2/100;B13) |
| E14 | =1/СТЕПЕНЬ(1+$F$2/100;B14) |
| F4 | =(C4-D4)*E4 |
| F5 | =(C5-D5)*E5 |
| F6 | =(C6-D6)*E6 |
| F7 | =(C7-D7)*E7 |
| F8 | =(C8-D8)*E8 |
| F9 | =(C9-D9)*E9 |
| F10 | =(C10-D10)*E10 |
| F11 | =(C11-D11)*E11 |
| F12 | =(C12-D12)*E12 |
| F13 | =(C13-D13)*E13 |
| F14 | =(C14-D14)*E14 |
| F15 | =СУММ(F4:F14) |
В результате в ячейке F15 мы получим искомое значение NPV, равное 352,1738.
Чтобы создать такую таблицу нужно затратить 3-4 минуты. Excel позволяет найти нужное значение NPV быстрее.
Расчет NPV в Excel (функция ЧПС)
Поместим в ячейку B17 (или любую другую свободную ячейку) формулу:
=ЧПС(F2/100;C5:C14)-D14
Мы мгновенно получим точное значение NPV в рублях (352,1738р.).

Наша формула ссылается на ячейки F2 (у нас там указана процентная ставка – 10 %; для использования в функции ЧПС нужно разделить ее на 100), диапазон значений C5:C14, где размещены данные о притоках денежных средств, и на ячейку D14, содержащую размер первоначальных инвестиций.
Таковы особенности функции ЧПС, рассчитывающей NPV без учета первоначальных инвестиций.
Тем, кто не прочь поэкспериментировать с функцией ЧПС, а также вычислением NPV с помощью табличной организации данных, предлагаю скачать исходник с примерами, рассмотренными в настоящей статье по ссылке.
Расчет NPV в Excel: заключение
Расчет NPV в Excel (читается: эксель) позволяет избежать трудоемких вычислений вручную или за счет использования громоздких программных комплексов и получить нужный результат в считанные секунды.
Расчет NPV в Excel (видео):
NPV calculates the net present value (NPV) of an investment using a discount rate and a series of future cash flows. The discount rate is the rate for one period, assumed to be annual. NPV in Excel is a bit tricky, because of how the function is implemented. Although NPV carries the idea of «net», as in the present value of future cash flows less initial cost, NPV is really just the present value of uneven cash flows.
As Timothy R. Mayes, author of Financial Analysis with Microsoft Excel, says on his website TVMCalcs.com:
Net present value is defined as the present value of the expected future cash flows less the initial cost of the investment…the NPV function in spreadsheets doesn’t really calculate NPV. Instead, despite the word «net,» the NPV function is really just a present value of an uneven cash flow function.
One simple approach is to exclude the initial investment from the values argument and instead subtract the amount outside the NPV function.
In the example shown, the formula in F6 is:
=NPV(F4,C6:C10)+C5
Note the initial investment in C5 is not included as a value, and is instead added to the result of NPV (since the number is negative).
Notes
- values must be equally spaced in time and occur at the end of each period.
- values must be in chronological order.
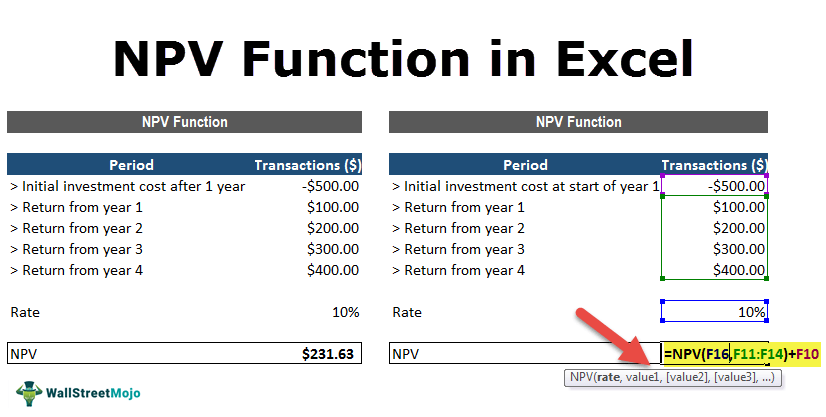
NPV Function in Excel
NPV in Excel is also known as the net present value formula in Excel, which is used to calculate the difference between the current cash inflow and cash outflow for an investment. It is a built-in function in Excel. It is a financial formula that inputs the rate value for inflow and outflow.
The NPV (Net Present Value) function on Excel calculates the net present value for periodic cash flows based on a supplied discount rate and a series of payments. The NPV in Excel is generally leveraged under financial calculation.
In financial projects, the NPV in Excel is useful in finding the value of an investment or analyzing the feasibility of a project. Therefore, it is recommended that financial analysts should use the XNPV function over the regular NPV (Net Present Value) in the Excel function.
Table of contents
- NPV Function in Excel
- NPV Formula in Excel
- NPV Equation
- How to use the NPV Function in Excel? (with Examples)
- Example #1
- Example #2
- Things to note about the NPV in Excel
- NPV in Excel Video
- Recommended Articles
You are free to use this image on your website, templates, etc, Please provide us with an attribution linkArticle Link to be Hyperlinked
For eg:
Source: NPV in Excel (wallstreetmojo.com)
NPV Formula in Excel
The NPV in excel accepts the following arguments:
- Rate (argument required): It is the discount rate over the length of the period.
- Value1, Value2: Value1 is required. They are numeric values that represent a series of payments and income where:
- Outgoing payments are mentioned as negative numbers.
- Incoming payments are mentioned as positive numbers.
NPV Equation
The calculation of NPV (Net Present Value) of an Investment in the Excel’s NPV function is based upon the following equation:

How to use the NPV Function in Excel? (with Examples)
Let’s take a few NPV excel calculation examples before using the NPV function in the Excel workbook:
You can download this NPV Function Excel Template here – NPV Function Excel Template
Example #1
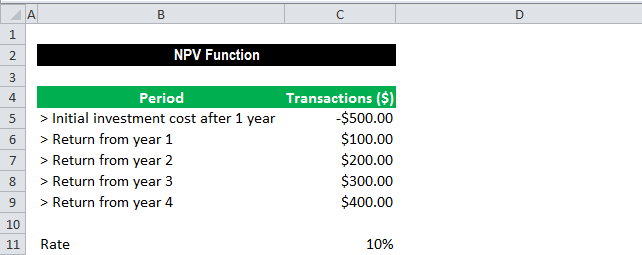
Suppose we are working on the following data set on cash inflows and outflows:
The below spreadsheet shows a simple example of the NPV function in excel.
The rate arguments that are supplied to the function are stored in cell C11, and the value arguments have been stored in cells C5-C9 of the spreadsheet. The NPV in Excel is entered in the cell C13.

This function gives the result of $231.63.
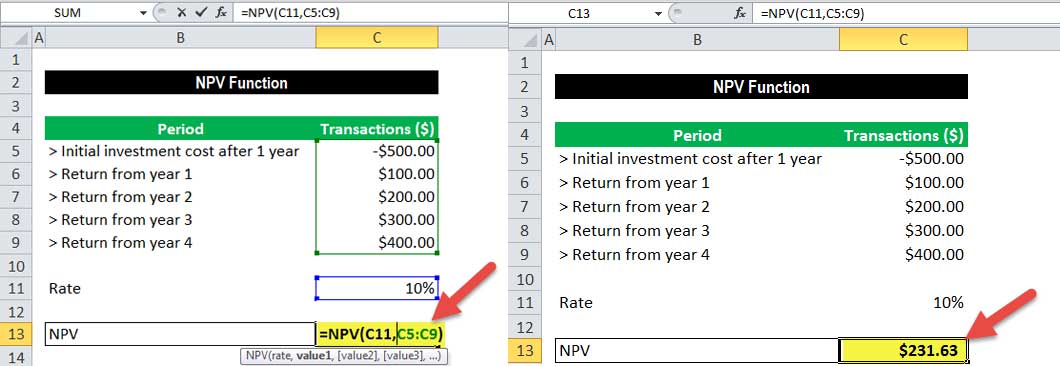
In this example, we made the initial investment of $500 (shown in cell C5) at the end of the first period. This value is considered the first argument (value1) to the NPV function in Excel.
Example #2
The below spreadsheet shows a further example in which the first payment is made at the start of the first period and how this payment should be considered in the NPV function in Excel.
Again, the rate of 10% is stored in cell C11, and cash flow value arguments of the transactions are held between the range C5-C9 of the spreadsheet. NPV in Excel is inserted in cell C11.
The function gives the result of $2,54.80.
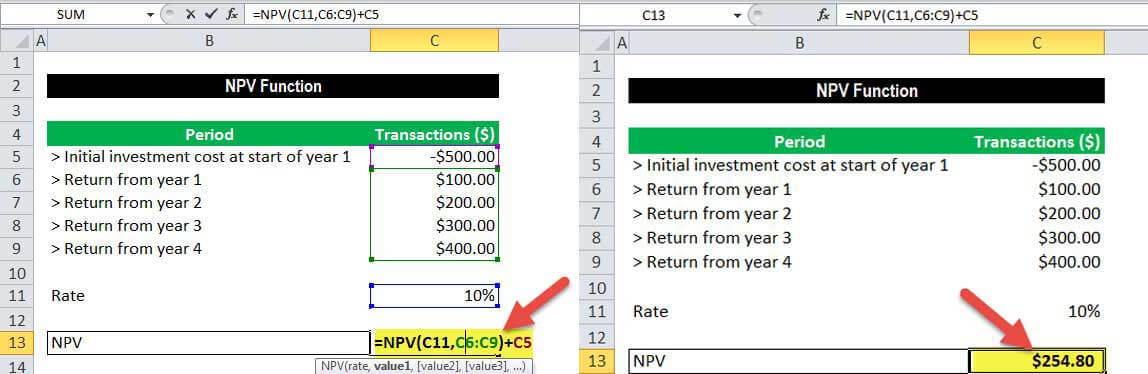
Note that, as the initial investment of $500 (shown in cell C5) was done at the start of the first period, this value is not included in the arguments to the NPV function in Excel. Instead, the first cash flow is added to the NPV Excel result.
As described in example # 2, the NPV formula in excelThe NPV (Net Present Value) of an investment is calculated as the difference between the present cash inflow and cash outflow. It is an Excel function and a financial formula that takes rate value for inflow and outflow as input.read more is established on future cash flows. Therefore, if the first cash flow happens at the start of the first period, we must add the first cash flow value to the NPV Excel result. We should not include it in the values arguments.
Things to note about the NPV in Excel
- The NPV investment begins one period ahead of the date of the value1 cash flow and ends with the last cash flow in the list. The NPV calculation in Excel is based upon future cash flows. Therefore, if the first cash flow is made at the beginning of the first period, the first value must be explicitly added to the NPV Excel result, excluded in the values arguments. For more information, see the examples below.
- Let us say n is the number of cash flows in the list of values; the formula for NPV (Net Present Value) in Excel would be:
- If the arguments are supplied individually, numbers, logical values, blank cells, and text representations of numbers are evaluated as numeric values. At the same time, the function ignores other values of cells in text and error form.
- If the arguments are supplied in a range, all non-numeric values in the range are ignored.
- We need to enter transactions, payments, and income values in the right sequence as NPV functions use the order of the 2nd argument, i.e., value1, value2, …, to evaluate the ranking of cash flows.
- The key difference between NPV functions and PV function is that PV allows cash flows to begin either at the beginning or at the end of the period.
- NVP (Net Present ValueNet Present Value (NPV) estimates the profitability of a project and is the difference between the present value of cash inflows and the present value of cash outflows over the project’s time period. If the difference is positive, the project is profitable; otherwise, it is not.read more)function in the latest versions of Excel can accept up to 254 value arguments, but with Excel 2003, only up to 29 values can be supplied.
NPV in Excel Video
Recommended Articles
This article is a guide to NPV Function in Excel. We discuss the NPV formula in Excel and how to use NPV in Excel, along with practical examples and downloadable Excel templates.
- Examples of NPVNet Present Value (NPV) refers to the dollar value derived by deducting the present value of all the cash outflows of the company from the present value of the total cash inflows. For example, if the present value of all the company’s cash outflows is $100,000 and the present value of the total cash inflows is $120,000, the net present value will be $20,000 ($120,000 – $100,000).read more
- NPV Profile DefinitionA net present value (NPV) profile is a graph that depicts the relationship between the project’s net present value and various discount rates. The NPV of the project is plotted on the Y-axis, and the discount rate is plotted on the X-axis.read more
- PV Function in ExcelPV, or present value, is a function that is used to calculate the current present value of any investment. It is determined by the investment rate and the number of payment periods, with the future value as an input.read more
- PMT Function
- Linear Programming in ExcelLinear programming in excel helps implement this applied mathematics aspect to excel worksheet for solving business problems through resource optimization. For this purpose, the user can opt for the «Excel Solver».read more
Net Present Value (NPV) is a method to analyze projects and investments and find out whether these would be profitable or not.
It’s widely used in the financial world and is considered a robust way to make accurate investment decisions.
To give you an example, if you’re considering an investment plan, where you invest $100 every month for the next 10 years and get $20,000 at the end of 10 years, you can use the NPV method to find out whether this is a profitable investment decision or not.
Don’t worry, things will get a lot clearer as I cover some examples later in the tutorial.
In this tutorial, I will show you different examples of calculating NPV in Excel. I’ll also cover two formulas to calculate NPV in excel – NPV and XNPV function.
So let’s get started!
What is NPV – An Easy Explaination
Before I get into calculating the NPV value next cell, let me quickly explain what it really means.
NPV (short for Net Present Value), as the name suggests is the net value of all your future cashflows (which could be positive or negative)
For example, suppose there’s an investment opportunity where you need to pay $10,000 now, and you will be paid $1000 per year for the next 20 years.
If you know what is the current discount rate (also called the cost of capital or the interest rate), you can use that in the NPV formula in Excel to calculate the net present value of all the future inflows that you will have in the next 20 years with this investment.
If that value is more than $10,000, then this is a profitable investment and you should go ahead and do it. And in case it is less than 10,000, then you end up with a loss and you shouldn’t do this investment (and instead invest the money at the current discount rate in government bonds or index funds).
NPV value is also used when comparing different projects or investment opportunities.
If you have 3 different projects with expected outflow and inflow values, you can use the net present values of all these to see which project has the best profitability.
Now that you have a decent understanding of what NPV is, let’s see a couple of examples on how to calculate in Excel.
Excel NPV Function
Excel has an in-built NPV function with the following syntax:
=NPV(rate, value1, [value2],...)
The above formula takes the following arguments:
- rate – this is the discount rate for one time period. For example, if your cashflows are happening every year, this would be the annual discount rate. If these are quarterly, this would be quarterly discount rate
- value1, value2… – these are the cashflow values and could be positive (inflow/income) or negative (outflow/payment). You can have a maximum of 254 values
Some important things to know when using the NPV function in Excel:
- The NPV function considers all the these values are evenly spaced out (i.e., have the same time interval between each value).
- The order of the values matter, so if you change the order and keep the same values, the final result would be different
- The formula considers that the inflow/outflow takes place at the end of the period
- It only considers the numeric values, and if there are blanks or text values, these would be ignored
The most important thing to keep in mind is that you can only use this formula when your regular flow of inflows and outflows. For example, if the inflow/outflow happens at the end of the year, it should be the same for all the values.
In case you have a dataset where the inflow/outflow happens on specific dates (and is not evenly spaced), you can not use the NPV formula. In that case, you need to use the XNPV formula.
Now that we know about the syntax of the NPV function, let’s have a look at some practical examples.
Calculating Net Present Value (NPV) in Excel
When working with the NPV formula in Excel, there could be two scenarios:
- The first outflow/inflow happens at the end of the first period
- The first outflow/inflow happens at the beginning of the first period
For example, if I am evaluating a project which would need an initial outlay of $100,000 and then yearly returns, the two scenarios would be:
- Outflow of $100,000 at the end of Year 1, and then inflows from end of Year 2 onwards
- Outflow of $100,000 at the beginning of Year 1, and then inflows from end of Year 1 onwards
You can use the NPV function in both scenarios with a minor adjustment.
Let’s have a look at each example!
First Outflow/Inflow Happens at the End of the First Period
Suppose I need to evaluate a project where the cash flows are as follows and the discount rate is 5%:

In this example, the first outflow of $100,000 happens at the end of year 1.
You can use the below formula to calculate the NPV value for this data:
=NPV(D2,B2:B7)

The above formula gives the NPV value of $15,017, which means that based on these cash flows and the given discount rate (also called the cost of capital), the project will be profitable and generate profit worth $15,017.
This is the straightforward use of the NPV function, but in most cases, you will be dealing with cases where the inflow happens in the beginning.
So let’s see an example of that.
First Outflow/Inflow Happens at the Beginning of the First Period
Below I have the data to evaluate a project where the cash flows are as follows and the discount rate is 5%:

You can use the below formula to calculate the NPV value for this data:
=B2+NPV(D2,B3:B7)

In the above formula, I have excluded the initial outflow, as it happens at the beginning of the first year.
Since the NPV function is programmed in such as way that it considers each value as an inflow/outflow at the end of each period, I excluded the initial outflow and calculated the NPV for all the other future cash flows.
And then the result of the NPV function is then added back to the initial outflow.
This gives us a value of $15,768, which is the profit we will make by investing in this project.
So in case you need to evaluate projects/investments where the first cash flow happens at the beginning of the first period, exclude it from the formula and add it back to the result.
Comparing Projects Using NPV to Find the Best One
In real life, it often happens that you need to analyze multiple projects/investment opportunities and see which ones are the best for you or your company.
NPV is often the best and most accepted way to compare different projects where you can the cashflows.
Suppose you have the dataset as shown below and you want to find out which project(s) are worth investing in.

For the purpose of this example:
- I am considering that the first cashflow happens at the end of first year
- The initial outflow for each project is $100,000
- The discount rate for evaluating all the projects is 5%
Below are the formulas that will give me the NPV value for each project.
Project 1:
=NPV(5%,B2:B7)
Project 2:
=NPV(5%,C2:C7)
Project 3:
=NPV(5%,D2:D7)

Based on the results, we can see that the return on Project 3 is the highest, and if you have to choose between one of these, you should choose Project 3.
Similarly, if you need to choose any two, you should choose Project 3 and 1, as these have a higher NPV.
When evaluating projects using the NPV method is that it works on projected future cash flows. With projections, there is always a risk that it may not turn out as we expected (could be higher or lower). Also, the risk of error in forecasting increases as the duration increases. We can forecast income in the next two years with far more accuracy than that of the income in the year 19 and 20.
Calculating NPV for Irregular Interval – Using XNPV Formula
NPV formula works great if you have regular cash flows (i.e., the time period between the cash flow is the same).
But in case it’s not, you can’t use the NPV function.
For such cases, Excel gives you the XNPV function.
The XNPV function is similar to the NPV function, with one improvement, you can specify dates for cashflows and it will calculate the present value for each cash flow based on it.
Below is the syntax of the XNPV formula:
=XNPV(rate, values, dates)
The above formula takes the following arguments:
- rate – this is the discount rate for one time period. For example, if your cashflows are happening every year, this would be the annual discount rate. If these are quarterly, this would be quarterly discount rate
- value1, value2… – these are the cashflow values and could be positive (inflow/income) or negative (outflow/payment).
- dates – these are the dates for each cashflow
One important thing to remember when using the XNPV formula in Excel is that the first date is considered as the beginning of the time period.
Suppose you have a dataset as shown below and you want to calculate the net present value for this data:

Below is the formula that will give us the net present value:
=XNPV(D2,B2:B7,A2:A7)

In the above example, the formula considers the first transaction (outflow of $100,000 on 01-01-2021) as the starting point and then calculates the overall net present value.
So in cases where you have cash flows/investments happening at irregular time intervals, you should use the XNPV formula.
NPV vs IRR – Which One Should you Use?
When analyzing project and investment decisions, NPV and IRR are the two most used methods.
Where NPV is Net Present Value and IRR is Internal Rate of Return.
While both the methods would give you similar results in most cases, NPV is considered a superior method when it comes to calculating the present value and viability of projects and investments.
IRR has a few shortcomings that make it less accurate, and in some cases, the NPV method and the IRR method will give you different results.
In case of different results, the NPV method is considered right.
In this tutorial, I have covered how to calculate net present values in Excel using NPV and XNPV methods.
In case you have evenly spaced-out cash flows, you can use the NPV method. And in case you have irregular cash flows then you can use the XNPV method (which also uses the dates of the cash flow for the calculation).
I hope you found this tutorial useful!
Other Excel tutorials you may also like:
- How to Calculate Average Annual Growth Rate (AAGR) in Excel
- How to Calculate Compound Interest in Excel + FREE Calculator
- How to Calculate Correlation Coefficient In Excel
- How to Calculate Standard Deviation In Excel
- Calculating Moving Average in Excel [Simple, Weighted, & Exponential]
- How to Calculate Compound Annual Growth Rate (CAGR) in Excel