
Е. Ковалева,
29 сентября 2020
Адекватно оформленная письменная работа способствует не только эстетическому наслаждению читателя, но и правильному пониманию написанного. В этой статье детально описывается, как настроить файл в текстовом редакторе Microsoft Word, чтобы отчет по практике, курсовая или дипломная работа была составлена в соответствии с требованиями ГОСТ.
Содержание:
- Первый шаг – устанавливаем параметры страниц
- Второй шаг – устанавливаем стили
- Третий шаг – автоматический перенос слов
- Четвертый шаг – линейка
- Пятый шаг – нумерация страниц
- Шестой шаг – собираем оглавление
- Полезные советы
Первый шаг – устанавливаем параметры страниц
Согласно государственным стандартам, поля должны быть: слева – 3 см, справа – 1,5 см, сверху и снизу – по 2 см. Чтобы их установить проделываем следующие действия:
- На главной панели выбираем вкладку «Разметка страницы».
- Заходим в «Параметры страницы».
- В разделе «Поля» устанавливаем необходимые значения.
- Здесь же выбираем «книжную» ориентацию.
- Переходим в раздел «Размер бумаги» и выставляем формат А4.


Второй шаг – устанавливаем стили
Как правило, в большинстве учебных заведений для оформления курсовой, дипломной или любой другой письменной работы достаточно установить три стиля:
- обычный – используется для написания основного текста работы;
- заголовок 1 – размещается посередине страницы, пишется заглавными буквами;
- заголовок 2 – оформляется как обычный текст документа.
В редакторе Word можно создать собственный стиль, либо изменить уже существующие.
Обычный стиль
1. На главной панели заходим в раздел «Стили».
2. Щелкаем по кнопке «Дополнительные параметры».

3. В открывшемся окне кликаем правой кнопкой мыши по надписи «Обычный стиль», затем выбираем «Изменить».

Появляется диалоговое окно, в котором показана вся информация об этом стиле.

4. Обращаемся к разделу «Форматирование» и выставляем необходимые параметры:
- шрифт – Times New Roman;
- кегль – 14;
- цвет текста – черный;
- выравнивание – по ширине;
- интервал – полуторный.

5. Здесь же выставляем абзацный отступ. Для этого:
- В левом нижнем углу кликаем по кнопке «Формат» и выбираем раздел «Абзац».
- Во всплывшем окне в разделе «Первая строка» выбираем надпись «Отступ».
- Далее устанавливаем необходимый показатель при помощи стрелочек – в нашем случае это 1,25 см.

Важно! Следует обратить внимание на раздел «Интервал», который находится в этом же окне. Показатели «перед» и «после» должны быть обнулены, иначе расстояние между строками будет больше необходимого, что может стать причиной возврата труда на доработку.
Заголовок 1
Кликаем правой кнопкой мыши на «Заголовок 1» и выбираем пункт «Изменить».
- Выставляем аналогичные обычному стилю параметры, за исключением выравнивания – его необходимо установить «по центру».
- Далее здесь же нажимаем кнопку «Формат» и выбираем пункт «Абзац».

- В разделе «Первая строка» устанавливаем надпись «(нет)», а интервал обнуляем.
- Поскольку «заголовок 1» должен быть написан заглавными буквами, повторно щелкаем «Формат» в нижнем левом углу, а затем выбираем пункт «Шрифт».
- Во всплывшем окне ставим галочку напротив надписи «Все прописные».


Заголовок 2
Для форматирования второго заголовка проделываем полностью такие же манипуляции, которые совершались при установлении параметров обычного стиля.
Третий шаг – автоматический перенос слов
Автоматический перенос слов в Word по умолчанию отключен. Однако для более грамотного составления документа, более гармоничного его вида, вполне целесообразно включить эту функцию. Для этого следует сделать следующее:
- В верхнем меню переходим на вкладку «Разметка страницы», выбираем пункт «Расстановка переносов».
- В открывающемся списке находим вариант «Авто» и кликаем на него.

Четвертый шаг – линейка
Этот инструмент необходим для изменения полей, отступов, абзацев или выравнивания графических изображений. Чтобы появилась боковая и верхняя линейка, необходимо сделать следующее:
- Переходим во вкладку «Вид».
- Ставим галочку напротив слова «Линейка».

Пятый шаг – нумерация страниц
Чтобы пронумеровать весь документ, следует предпринять следующие действия:
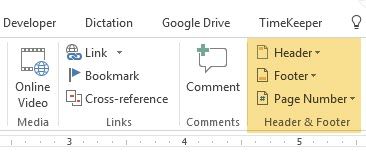
- Заходим во вкладку «Вставка».
- В группе «Колонтитулы» кликаем на кнопку «Номер страницы».
- В выпадающем текстовом меню выбираем подходящий вариант расположения номеров страниц. В большинстве случаев ВУЗы требуют устанавливать нумерацию внизу страницы.
- После этого откроется окно с примерами расположения номера на странице документа. Кликаем на шаблон с выравниванием по центру, а затем выходим из режима вставки.


Шестой шаг – собираем оглавление
Для того чтобы сделать оглавление, в котором будут прописаны все заголовки и подзаголовки, а также указаны номера страниц, на которых они находятся, следует провести следующие манипуляции:
- Разбиваем текст на заголовки.
- Переходим в раздел «Ссылки».
- Выбираем раздел «Оглавление» и переходим в подраздел с аналогичным наименованием.
- Во всплывшем окошке меняем настройки нужным образом и кликаем кнопку «ОК».

В результате все заголовки в содержании будут иметь то же название, которое им было задано в тексте.
Важно! Если вы решите отредактировать какой-либо из заголовков, оглавление необходимо обновить.
Для этого:
- Кликаем на содержание правой клавишей мыши.
- Выбираем в появившемся списке команд надпись «Обновить поле».
- Далее во всплывшем окне выбираем «обновить целиком», а затем нажимаем «ОК».
Полезные советы
Что делать, если нужно написать следующее слово с новой страницы?
Иногда при работе с документом в Microsoft Word требуется перенести часть текста на новую страницу. Многие проделывают данную операцию с помощью клавиши Enter, нажимая ее до тех пор, пока не появится разрыв, означающий начало новой страницы. Данный метод является абсолютно неверным, поскольку чреват неприятными последствиями – если понадобится отредактировать верхнюю часть текста, придется корректировать и нижнюю область с правильной расстановкой отрывков работы. Чтобы избежать подобных недоразумений, следует сделать следующее:
- Ставим курсор в конец предложения, после которого последующий текст должен быть размещен с новой страницы.
- Нажимаем одновременно клавиши «Ctrl» и «Enter».
В результате в документе Word появится новая страница с текстом, который нужно было перенести. После этого перемещенный отрывок всегда будет начинаться с начала листа независимо от того какие сдвиги текста производились на предыдущей странице.
Как начать нумерацию не с первой страницы?
В большинстве случаев, согласно ГОСТу нумерация студенческой работы начинается с цифры «2» или «3». Чтобы этого добиться нужно предпринять следующие шаги:
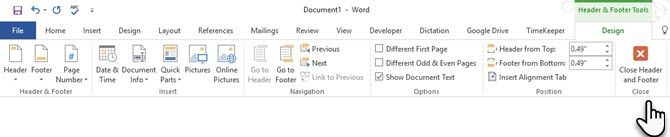
- Заходим во вкладку «Конструктор».
- Ставим галочку напротив надписи «Особый колонтитул для первой страницы».

Теперь нумерация начинается со второй страницы с цифры «2».
Как сделать нумерацию с третьей страницы?
Порядок действий следующий:
- Ставим курсор на первую страницу.
- Заходим в раздел «Разметка страницы».
- Выбираем на панели инструментов «Разрывы».
- Кликаем на надпись «Следующая страница».

Таким образом, нумерация работы начнется с третьей страницы с цифры «3».
Если вы освоите представленные выше шаги, серьезных проблем с оформлением курсовой, дипломной или любой другой письменной работы у вас больше не будет никогда!
При использовании материалов сайта, обязательно указание активной ссылки на источник.
FAQ — Создание отчета в MS Word
Создавать отчет в программе Word удобно если отчет имеет сложную структуру (тогда его быстрее создать в Word, чем в Qreport от Delphi, кроме того, этот QReport имеет «глюки»), либо, если после создания отчета его нужно будет изменять. Итак, первым делом в Word создается шаблон будущего отчета, это самый обыкновенный не заполненный отчет. А в места куда будет записываться информация нужно поставить метки. Например (для наглядности метки показаны зеленым цветом, реально они конечно не видны):
| No | Поставщик | Наименование товара | Код товара | Кол-во | Цена | Сумма |
| 1 |
Далее в форму, откуда будут выводиться данные, вставляете компоненту DdeClientConv из палитры System. Назовем ее DDE1. Эта компонента позволяет передавать информацию между программами методом DDE. Свойства:
ConnectMode : ddeManual — связь устанавливаем вручную
DdeService : (winword) — с кем устанавливается связь
ServiceApplication : C:MSOfficeWinwordWINWORD.EXE — полный путь доступа к программе. (Вот здесь можно наступить на грабли. Ведь Word может лежать в любой папке! Поэтому путь доступа к нему лучше взять из реестра, а еще лучше использовать OLE см.начало раздела)
Теперь пишем процедуру передачи данных:
Для Delphi 2 и выше
Пример проверен только на русском Word 7.0! Может, поможет.
И еще, как определить установлен ли на компьютере Word, запустить его и загрузить в него текст из программы?
По командам OLE Automation сервера см. help по Microsoft Word Visual Basic.
Учимся говорить на языке диаграмм на всех версиях ворда

Здравствуйте всем, уважаемые читатели! На связи Федор Лыков. Сегодня я вам расскажу о том, как построить диаграмму в ворде.
Сперва рассмотрим определение и назначение этих графических объектов в документе, а после рассмотрим возможные способы их создания. Итак, поехали!
Как построить диаграмму в ворде?
Определение, виды и назначение
Диаграмма – это такое изображение или графический чертеж, который позволяет наглядно увидеть соотношение нескольких величин.
Используется для создания отчетов и более детального представления разницы в расходах, о доходах компании за квартал, о повышении или уменьшении прибыли.
Качественное и уместное использование данных графиков позволяет упростить ваш документ для восприятия, а также очень даже неплохо украсить его в визуальном плане. Согласитесь в разы приятнее глазами увидеть разницу с помощью какого-то красивого графика, чем бесконечно смотреть на черные цифры в тексте.
Существуют самые различные её виды, каждый из которых может подойти лучше всего для отображения каких-то конкретных данных.
- «Биржевая» исходя из названия создана для отображения повышения и понижения курса валют.
- «Круговая» отлично подходит для того, чтобы увидеть самый большой источник расходов.
- «Линейчатая» или «гистограмма» позволяет наглядно сравнить несколько различных кандидатов в сравнении. К примеру, с помощью подобных диаграмм сравниваются процессоры или видеокарты и данные вносятся исходя из результатов тестов конкурирующих продуктов.
И это далеко не все примеры. В самой программе я насчитал 17 разных видов у каждого из которых есть еще несколько разновидностей. В общем, на любой вкус и цвет.
Давайте уже наконец перейдем к рассмотрению возможности создания диаграмм в ворде по данным таблицы пошагово. Начнем с традиционного 2003, а закончим более современными 2007, 2010, 2016 и так далее.
Приятного вам чтения!
Создание диаграмм в 2003 ворде
Итак, создаем для тренировки новый текстовый документ. В нем нас интересует вкладка меню вверху окна программы «вставка». Кликаем левой кнопкой мыши по ней и наводим курсор на пункт раскрывающегося меню «Рисунок» и в нем уже выбираем «Диаграмма».

Перед нами появится гистограмма и окно с таблицей данных, в которую вы можете внести уже свои значения и названия элементов.

Внимательно посмотрите на таблицу и на гистограмму, чтобы верно ввести значения в каждой ячейке.
Для смены данной стандартной гистограммы на какой-либо другой вид необходимо нажать чуть ниже самого графика как на скриншоте ниже и выбрать из контекстного меню пункт «тип диаграммы».

Перед вами откроется окно выбора, в котором просто выбирайте подходящий вам вариант и нажимаете «ОК».
В конце статьи мы обязательно рассмотрим разные виды и их назначение, так что обязательно читайте статью до конца!

После ввода всех данный и выбора типа просто закрывайте окно таблицы и любуйтесь результатом вашей работы. Для повторного редактирования данных таблицы нажмите два раза левой кнопкой мыши по полученной диаграмме, чтобы ее область была обведена диагональными пунктирными линиями. После этого нажмите правой кнопкой мыши в этой области и выберите пункт «режим таблицы».

После этого табличка с данными снова появится и позволит вам отредактировать их.
Для редактирования цвета столбцов необходимо нажать на тот, который хотите изменить правой кнопкой мыши и выбрать пункт «Формат ряда данных». Так же можно просто дважды кликнуть по нему левой клавишей мыши. В открывшемся окне вы сможете настроить столбец более детально.

То же самое касается и фона столбцов. По выше написанной инструкции вы сможете изменить его цвет.
Теперь предлагаю рассмотреть возможность создания диаграмм из уже имеющейся таблички с данными.
Создать диаграмму по таблице в ворде 2003
Часто может возникать необходимость графически отобразить уже готовые таблички данных. В этом случае можете попробовать сделать автоматическую диаграмму на основании данных.
Для этого нам понадобится таблица для примера. Я сделал небольшую 3×4 со случайным расчетом расходов.

В рамках тренировки можете просто сделать точно такую же.
После этого выделяем все ячейки таблицы, зажав левую клавишу мыши и после этого выполняем те же действия, что и в прошлом случае.

Мы увидим созданную гистограмму, которая использует данные из таблицы.

Вот мы и разобрали как построить диаграмму в ворде 2003 пошагово для чайников. Теперь предлагаю рассмотреть данный вопрос на современных версиях офиса.
Создание диаграмм на современных изданиях офиса
Для добавления их в современную версию офиса так же не понадобится особых профессиональных умений.
Переходим на уже хорошо знакомую нам вкладку «Вставка» и нажимаем на кнопку «Диаграмма».

После этого откроется окно выбора макета. Как я уже упоминал в начале статьи их здесь 17 штук и еще в каждой есть свои разновидности.

Выбираем макет, выбираем его разновидность и нажимаем «ОК».
На листе появится выбранная нами диаграмма и также откроется окно таблицы Excel, в которую будет необходимо внести данные. В зависимости от выбранного макета будут различаться и имеющийся в ней стандартный формат данных. То есть, это зависит от прямого типа назначения макета.

В верхней части окна программы мы сразу можем обратить внимание на настройки. Здесь мы можем добавить элемент, выбрать экспресс-макет, изменить цвета, выбрать стиль, поменять данные со строки на столбец и наоборот, выбрать данные, изменить или сменить формат на какой-либо другой, если выбранный вами не подошел или не понравился.
После окончания редактирования просто нажмите в любом свободном месте листа, чтобы выйти из режима настройки параметров. Для повторного редактирования дважды нажмите по любой области диаграммы и снова попадете в настройки. Для изменения данных нажмите кнопку «Изменить данные» в верхней части окна на панели настроек и в этом случае снова откроется окно редактирования таблицы.

Создать диаграмму по таблице в современном издании офиса
Здесь следует сделать небольшое отступление. Не знаю по какой причине, но в современных версиях не работает это так, как в 2003. Как бы я не старался все равно пришлось вводить значения вручную. Лучше делать сразу таблицу средствами Excel в ворде.
Как это сделать я рассказывал в одной из предыдущих статей под названием «12 невероятных способа создания таблицы в ворде на всех версиях офиса», рекомендую ознакомиться.
Если у вас уже есть готовая таблица формата Word, то тогда можно просто построить диаграмму по предыдущему способу. Затем внести данные или преобразовать нынешнюю таблицу в Excel формат.
Разбор
Сейчас покажу как построить диаграмму в ворде 2010 по данным таблицы пошагово.
В начале создадим небольшую табличку Excel ради примера. Я сделал небольшую 3×4 со случайным расчетом расходов. Собственно, это такая же табличка, как и в случае со старой версией ворда, но уже в формате электронных таблиц экселя.

Так как сама программа Excel обладает куда более интересными возможностями в плане построения диаграмм, то это будет даже удобнее. Перейдите на вкладку «Вставка» и увидите большое количество кнопок для построения.

Здесь имеющиеся виды рассортированы по категориям, которые обозначены миниатюрными значками. Я предпочту в данной ситуации просто выбрать «Рекомендуемые диаграммы», чтобы приложение само подобрало подходящую. Для наших расчетов он выбрал несколько видов, в том числе график и гистограмму.
Остановился я на гистограмме, так как она мне больше всего нравится для подобного рода наглядных расчетов. Вы можете выбрать любую другую, читайте описание и смотрите пример. После выбора нажимайте кнопку «ОК».

После этого увидите получившийся результат в рабочей области экселя.

Для того, чтобы выйти из интерфейса Excel, нажмите в любое свободное место листа Word. Чтобы вернуться к редактированию дважды нажмите левой кнопкой мыши по таблице.
Если нет необходимости в изменении данных полученной диаграммы, то рекомендую выделить ее как на скриншоте выше (нажать в область ближе к краю). Затем скопировать (Ctrl-C или правой кнопкой мыши и выбрать «Копировать»). После выйти из режима экселя и вставить (Ctrl-V или правой кнопкой мыши и выбрать «Вставить»).
В этом случае наша гистограмма будет в виде картинки и более лаконично впишется в документ. Взгляните сами.

Рекомендую делать данные действия только в финальном форматировании готового документа, чтобы не вышла ситуация, что вам необходимо поправить какие-то данные, а у вас уже не таблица, а всего лишь картинка. Имейте в виду.
Заключение
Итак, мы рассмотрели все имеющиеся способы воплощения ваших таблиц в виде наглядного графика или гистограммы и тем самым разобрались с вопросом как построить диаграмму в ворде.
Предлагаю вашему вниманию небольшую таблицу с несколькими видами различных диаграмм, их описанием и назначением. Для того, чтобы вы смогли более точно наглядно изобразить в документе необходимые сравнения или подготовить отчеты.
| Название диаграммы | Описание | Назначение |
Гистограмма |
Значение параметров отображаются в виде прямоугольников, высота которых отображает большее значение. | Для сравнения расходов по кварталам или напротив для планирования будущих затрат. |
График |
Данные изображаются в виде точек, соединенных линиями. Для построения используется классическая система прямоугольная система координат | Целесообразно использовать при большом количестве данных в длительном промежутке времени, которые необходимо представить к сравнению |
Круговая |
Значения представляются в виде процентного соотношения и располагаются в кругу, разделенном на сектора, где каждый сектор – определенный параметр таблицы данных. | Удобно использовать при сравнении затрат, так как позволяет увидеть наибольшие элементы расходов. Поэтому данные представлены в процентном соотношении. |
Линейчатая |
Значение параметров отображаются в виде прямоугольников, длина которых отображает большее значение. | Аналогичное как у гистограммы. Применяется для сравнения нескольких значений. |
Каскадная (водопад) |
Значения представлены в виде прямоугольных столбцов разного цвета, который показывает положительный или отрицательный результат. Каждый столбец отвечает за конкретную категорию значения. | Позволяет определить общий эффект, последовательно представляя положительные и отрицательные значения факторов. Классическая диаграмма для проведения факторного анализа. |
А на этом я предлагаю закончить. Надеюсь, что статья была информативной и полезной. Остались вопросы? Милости прошу в блок комментариев, где я обязательно отвечу на ваши вопросы. Спасибо, что дочитали данную публикацию до конца. До скорых встреч в следующих публикациях!
Отчет в Word
На вкладке «Отчет в Word» возможно произвести следующие настройки стандартного отчета в MS Word:
1. Установка галочки в поле, обозначенное на рис. 22 единицей (1) позволяет либо использовать при формировании отчета главу, определяющую наличие признаков преднамеренного и фиктивного банкротства, либо отказаться от ее формирования в отчете.
2. Если отсутствуют данные в форме отчета о движении денежных средств, то с помощью снятия галочки с поля №2 (2), можно отказаться от использования отчета о движении денежных средств в отчете в MS Word.
3. Под номером три (3) на рисунке №22 с помощью ниспадающего меню, можно установить формат ориентации страниц отчета. Это могут быть либо книжные, либо альбомные страницы.
4. Кнопка «Стандартный отчет» начинает построение отчета по финансовому анализу в формате MS Word. Эту кнопку следует нажимать только после проверки данных на следующих шести закладках меню, показанного на рисунке №22.
5. Кнопка «Отчет об оценке бизнеса» начинает построение отчета по оценке бизнеса. Эту кнопку следует нажимать после настройки входных параметров и в «Главном меню» и, при необходимости веса влияния прибыли на стоимость бизнеса на листе «Coefficients».
6. Кнопка «Сформировать отчет в соответствии с ПП 367» начинает построение тестового отчета в формате MS Word. Эту кнопку следует нажимать после проведения всех настроек на вкладке 367ПП данного меню.
Внимание! Перед формированием отчета в MS Word необходимо установить базовый и отчетный периоды на листе «Deviation» (см. п. 5.10. данного руководства).
Приложение.
Внешний вид вкладки «Приложение» показан на рисунке № 23.
При использовании планируемых периодов, для того, чтобы включить в отчет расчетные таблицы с листа «Plan», необходимо установить галочку напротив надписи «Включать в качестве приложения к отчету таблицы с листа «Plan».
Отчет по финансовому анализу, либо по оценке стоимости бизнеса можно дополнить приложением, которое должно быть в файле формата MS Word с расширением .doc. Файл приложения выбирается с помощью кнопки «Выбрать файл». Наименование и путь к файлу в этом случае будут видны в окне «Используемый файл» (2).
Чтобы файл добавлялся в отчет также необходимо установить галочку напротив надписи «Использовать файл приложения к отчету» (2).
Для закрытия диалогового окна предназначена клавиша «X».
10.1.3. Настройка отчетов. Отклонения … Коэффициенты.
Эти вкладки предназначена для настроек стандартного текстового отчета и отчета по оценке бизнеса, так как в нем также проводится минимальный финансовый анализ ликвидности, платежеспособности, деловой активности.
На данных вкладках необходимо определить предельные размеры величин, для которых в отчете будут использоваться наречия «значительно», «незначительно» и т.д.
ПП.
Эта вкладка предназначена для настроек тестового отчета, создаваемого в соответствии с Постановлением Правительства №367.
If Microsoft Office had been a country, it would have been the third most populous country in the world. 1.2 billion people using a single suite of apps is mind-boggling. And, they «speak» 107 languages!
But right now, you and I are speaking in English and we are going to talk about the most popular tool in the Microsoft Office arsenal — Microsoft Word 2016.
This document editor is used for writing a variety of documents. From a simple application to the necessary resume. From a plain bucket list to an office memo. We think we can work with Word. But it is when we sit down to write a serious professional report, we discover an important fact.
Professional report writing needs a different set of skills.
So, ask yourself this — can you make the leap from a single document to a lengthy report? Do you know all the Microsoft Word features that will help manage this large scale document project? Can you collaborate on the work with other team members?
You may be a student, a small business owner, or an office worker…you will need to create a report or a professionally formatted document of some kind. This MakeUseOf guide will help you update your techniques and sharpen your design approach.
In this guide:
Writing a Report — Introduction | The Report Checklist
Useful Microsoft Word Tools — Paste Special | Researcher | Freeze Parts of Your Document
Work on the Layout & Design — Intro | Cover Page | Table of Contents | Header and Footer | Page Numbers | Font Styling | Paragraph Styling | Page Breaks | Styles and Themes | Captions | Quick Parts | Page Borders
References and Collaboration — Index | Bibliographies | Cross-Referencing | Comments
Finalize Your report — Signatures | Watermarks | Read Only | Print to PDF
The Next Step — Conclusion
Writing a Report
Report writing involves research and then publishing the outcome of that analysis. In the professional world, the «look» or appearance of what you publish is paramount. The eye-pleasing final result could burnish your reputation and enhance your personal brand.
The steps below will handhold you through the expert features in Microsoft Word 2016. Spend a lot of time on a plan. Start with these guidelines…

Step 1: Decide the Purpose
Before you begin the report, you must first know why you are writing it in the first place. Reports are of many kinds but they are either meant to inform or persuade. It can be meant for describing a technical process, sharing background information, or demonstrate progress on a project.
Ask yourself – What and Why. This will help you distill the purpose to the one main point and stick to it instead of rambling on with unnecessary details.
Step 2: Identify Your Audience
The second important consideration is to evaluate your audience. Will they be able to understand what you are talking about? Are there different levels of readers who will read the report? The reader’s knowledge of the subject will greatly influence the information that you need to include.
Decide on the primary audience and then script the report at the adequate technical level. The secondary audience can be supported with supplemental information at the end of the report.
Step 3: Know Your Topic
You must know what you are talking about. So, research the topic, and include all the relevant information to prove your point. Make sure that you come to a conclusion based on facts and not personal opinion. The information must be correct, current, and well-referenced.
Also use a variety of resources such as journals, newspaper articles, books, websites, brochures, raw data, annual reports, and speeches to help support your point. Just don’t stick to Wikipedia.
Step 4: Outline the Report
You have done the research. There’s a ton of information that is waiting to be typed and printed. But wait! Don’t drown before you enter the water. Prepare the final outline of the report which will be the chart of waypoints to help you navigate from start to finish. The outline is the blueprint. It will give you a bird’s eye view of the land and also show you where you need to fill in the details.
The structure of an idea report can include the following elements:
- Title Page
- Executive Summary
- Table of Contents
- Introduction
- The Body of the Report
- Conclusion
- Recommendations
- Appendix
- Bibliography and References
Microsoft Word’s Document Outline is a powerful feature that can help you organize a document even before you start filling it with research. Take advantage of brainstorming and mind-mapping templates too.
Step 5: Write, Edit, Proofread, and Finish
Once you have structured your report, it is time to fill out the headers with content. I personally find it best to tackle a little bit of each section, and then bulk it up with information. You can do that if you want, or finish each section as you go down the report structure. Make sure you focus on presenting your ideas and using supportive evidence rather than spelling and grammar first. Outline your argument and write a few sentences that cast your main ideas. If you find something worth quoting, quote it.
Once the majority of your text is written, it is now time to read through it and make sure it flows well. Make sure you guide the reader’s understanding with transition words such as «This information shows…», «In other words…», «Similarly…» and do highlight relevant and key points.
Finally, spend time to proofread, check for grammar and spelling, and double-check all relevant information and its logical flow. It is best to leave at least one day to check and proofread your work. Don’t try to edit it straight after you think you have finished, as you will tend to miss read what you have written. Get some sleep, and proofread it the next day.
The Report Checklist
Before you go and submit or hand in your report that you have worked so hard on, make sure you have done the following:
- Completed the title page with the Title, Your Name, Date, Who the report is for, and a possible description of what the report is about.
- The contents page has appropriate headings and pages numbers are correct.
- Make sure the introduction covers key points, the scope of the report, and the objective it wants to meet.
- You have added captions above tables and below images/graphs.
- Does the content of the report present the information in a clear way, logical, factual, stay on topic, is to the point?
- Does the conclusion state the results, restate main idea’s, and does not include any new information?
- Are the headings and sub headings clearly labeled?
- Are quotes relevant, up-to-date, and correctly referenced?
- Have you used page breaks where appropriate?
Now, let’s launch Microsoft Word and take you through the features that will help piece together the draft of your report and present it as a professional document.
Useful Microsoft Word Features for Report Writing
Take these as bite-sized tips and master them one by one.
Microsoft Word is a big howitzer with many nuts and bolts. Let’s focus on the key skill sets and the tools you will need to plan, prepare, and present the professional report. The Microsoft Word features we will cover below are also productivity shortcuts that will make your job easier.
Tip: Use Microsoft Word 2016’s «Tell Me» assistant to learn more about new features in the Office suite.
Let’s start with three preliminary tools…
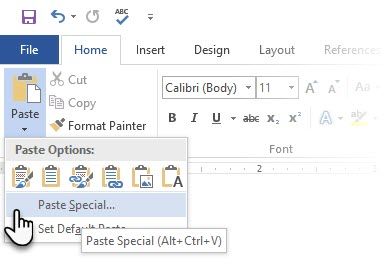
Use Paste Special
For most of us, when we need to copy text or an image into Word, the CTRL+V shortcut does just fine. But sometimes we might want to paste the copied data into another format, such as Excel data as an image. With the Paste Special command you can discard or specify the format when you paste a picture, presentation data, table, or object from any other program into Word.
You will work a lot with Excel tables and charts in a professional document.
If you just copy what you want and click paste, you will notice that it will insert the data as tables. But, if it is a large area of cells you want to paste, and you do not want to edit it, you may want to paste it as an image, with the extra option to edit it.
In Microsoft Excel: Select and highlight the cells that you want to copy > Press CTRL+C.
In Microsoft Word: Go to Home > Paste > Paste Special. Select Paste Special and from the dialog select Microsoft Office Excel Worksheet Object.
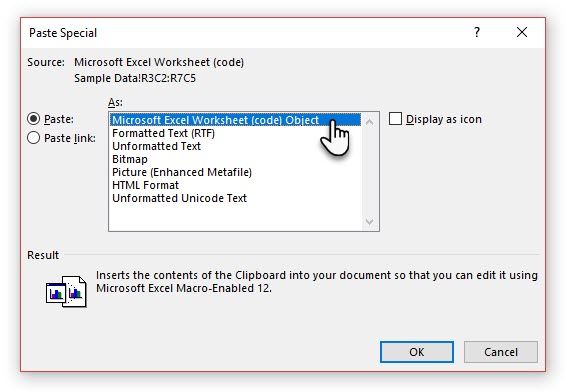
You can resize the data as it was an image, and if you double click, you will be able to edit the values. You can change the table or chart and redesign it. And, if you update the data in the chart or table in Excel, you can automatically refresh the chart in Word.
Try the right-click context menu too. The Paste Special menu pops up:
There are more options to import data from Excel into Word. The Microsoft Office Support page also describes them in detail.
Use the Researcher
Yes, there is Google and Wikipedia. But constantly switching from Word to your browser can hamper your productivity. Office 2016 brings in powerful research integration to this grunt work. The Researcher can not only help you find content from within Microsoft Word but also help you quickly add citations. It uses the Bing Knowledge Graph to find the right content to support your document.
Go to Ribbon > References tab and c Choose Researcher. A pane will open on the right with the search options.
Type a keyword for the topic want to search for and press Enter.
The Results pane shows a list of sources you can use in your document. Choose a topic to explore in detail.
Add the topic to your Microsoft Word document with a click on the plus sign on the top-right. You can also click the plus sign on any result to cite the source in your research document. The cite source helps you support your research with web sources and books.
As we will see later, an annotated bibliography is one of the toughest parts of a document. The Researcher is an intelligent assistant who steps in.
Freeze Part of Your Word Document
Let’s take for granted that your professional report will be a long and complex work. You can split the Word window into two panes so that you can view two different parts of a document at the same time. It is a valuable time saver when you want to copy and paste parts from one place to another or refer to one part of the document while working in another.
Go to Ribbon > View tab > Split.
To remove the split, click on Remove Split in the same tab.
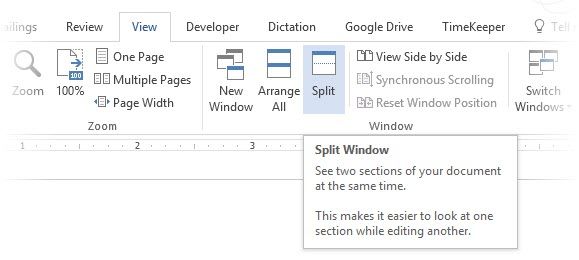
The Windows group gives you several options to change the way you work with two or more documents. The features are self-explanatory.
To scroll both documents at the same time, click Synchronous Scrolling in the Window group on the View tab. You can also click on View Side by Side to put two parts of the document next to each other.
Tip: Use Split View to display two different layouts – for instance, Print and Outline. Set the split. Then, click in the pane that you want to change, and then select a different layout on the View tab.
Work on the Layout & Design
The presentation of a report is what gets someone to read a report in the first place, and that is why it is crucial that your report is well presented. If you had the choice of four reports to read, what will you choose?
- A hand written report.
- A document printed in black and white.
- A report printed on normal A4 paper in color.
- A report printed in color, with a catchy title page, neatly bounded, and slick?
You will pick up the fourth report because it will pull you towards it by the visual appearance alone.
The front cover is not the only reason. A well-designed report is easier to read. It is also easier to scan when you don’t have time to read. That is why you need to spend some time on your headers and footers, and the different styles and themes. In short – the formatting of every element in the report.
Formatting may seem like a difficult chore, but it is a fun exercise that will exercise all your creative muscles. The key takeaways will be the skills you can apply to anything in Microsoft Office going forward. And the time you will save with all the productivity tips learned here.
Microsoft Word 2016 has a wealthy set of features. These are only some of the ways that your report design can stand out from the rest and be professional. So, let’s break down the layout and design skills.
This section will cover these features step-by-step:
- Start with a Cover Page
- Make a Table of Contents
- Create Your Header and Footer
- Add Page Numbers
(Format the Content)
- Pick the Right Fonts
- Style the Paragraphs
- Control Page Breaks
- Use Styles and Themes
- Captions
- Use Quick Parts
- Decorate with Page Borders
1. Start With a Cover Page
The first page is the first point of contact with your reader. It is also your opportunity to make a favorable impression. Don’t let your lack of artistic skills be an excuse because Word takes up the job with its in-built gallery of title pages. All you have to do is marry one to the theme of the report.
Microsoft Word 2016 offers you 16 pre-formatted templates and three more on Office.com.
Go to Insert > Pages Group > Cover Page.
The cover page appears at the beginning of the document by default.
As there are only 16 «official» templates on offer, you may find that all your other peers have the same cover page. So, why not customize it, and make it a bit more unique.
You can design a title page (or cover page) in Microsoft Word that can be an original in the stack. Save it as a template or easily change the design on the fly.
2. Make a Table of Contents
Casual readers scan. Good readers scan first and then dive deep. A table of contents provides the waypoints that help both. When it is a long and complicated document, wouldn’t you rather check the lay of the land before you head to the section that interests you?
Consider a Table of Contents (TOC) if your document is more than 10 pages long. You should first make sure you don’t need to rearrange any pages in your document before creating the TOC.
In Microsoft Word, you don’t have to write the entire TOC by hand. There’s a Table of Contents automatic tool under the References tab which takes your outline and designs it for you. Also, you can easily keep it updated when you want to change something.
There are also templates you can download and fit it around the nature of the content. For instance, a TOC for a thesis will look different from that of a company’s annual report.
We have a complete tutorial on how to create a table of contents page in Word.
The gist of it is this:
Create the outline and use heading styles to organize the hierarchy. Apply the automatic TOC tool to the heading styles. Word 2016 searches for those headings and then inserts the table of contents into your document. Then you can automatically update your TOC if you make changes in your document.
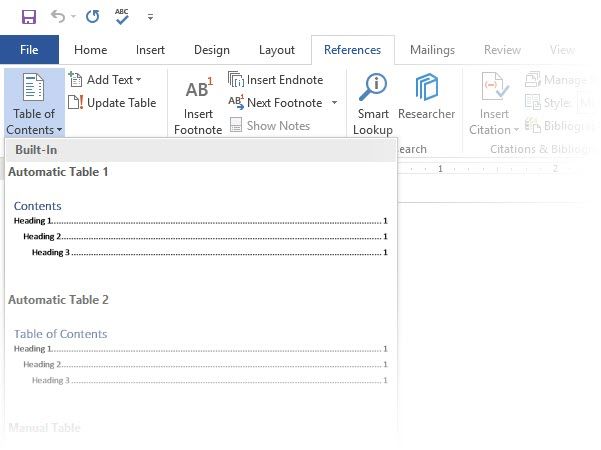
For more hands-on control, you can also use the Manual Table of Contents style. Word inserts placeholder text and you have to insert and format each content in the list.
3. Create Your Header and Footer
Headers and Footers are important in reports as the main purpose is to provide information about the report on every page. They are the common display areas for page numbers. The header of the document should contain the title of the report, and possibly the name of who created it. The title of the current section is helpful.
The footer, on the other hand, should include the page numbers, date of publication, and other administrative information that is required. Do note that some style guides have special guidelines for headers and footers.
Let’s start with the header in your document and give it a unique look.
Select Insert, then select either Header or Footer from the group. The built-in gallery shows you several options you can choose from.
The header and footer space is inserted in your document with placeholder text or table. The Header & Footer Tools opens on the Ribbon for other formatting work like the date, time, or picture.
Enter your text and then select Close Header and Footer.
You can start with a blank header and footer. If you have the design skills, use the Header & Footer Tools to design your own. Master the header and footer space if you want to create custom letterheads for your organization. You can use brand elements like company or organization logos at the top and neatly formatted footnotes at the bottom
Let’s try with and modify one of the inbuilt headers. I selected Facet from the gallery.
The final look took two minutes to put together with simple text effects and an icon sourced from the Microsoft Office icon gallery.

The header and footer are in place. But, how do you know where you are in the document? Insert page numbers as the next important signpost.
4. Add Page Numbers
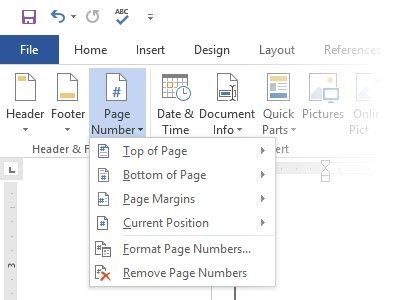
Page numbers look best in the footer (unlike in the header as in the image above). You can add a basic page number from the Insert > Page Number button on the Ribbon. You can also add it from the Design tab that appears when you add the header and the footer.
You have a lot of control over page numbers. Choose from a wide range of number formats and customize them to your needs. In this case, we are adding the number to the footer, but you can put them at the top or even at the margins. In this example, I have placed the page number at the bottom left. But, I would like to change the default look and the format.
For example: Using a «Page X of XXX» makes for a better indicator on a long document.
Select the page number. Go to Insert > Quick Parts. From the drop-down menu, select Field. You can also reach the Field dialog from the Header and Footer Design tab.
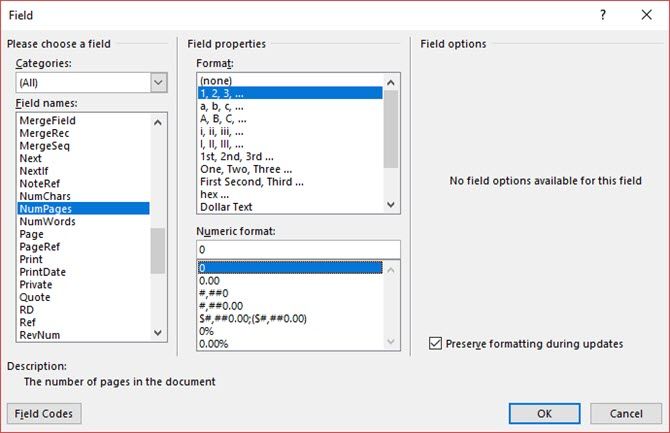
Choose NumPages from the long list of field names. From the box on the right, you can pick a specific format. I selected the usual 1, 2, 3. Click OK, and the number of the number of pages will appear. Now all you have to do is add your text such as Page X of XXX, and change the look of the numbers with the usual text formatting tools available from the Home tab.
It now looks like this:
Design the look on any page number in your document and Word updates all the remaining automatically. Page numbers are the most common elements in a footer, but it can also hold any other information like the header. From the options in the Insert group, you can add the date and time, document info, pictures, and more to your header or footer.
Next, we’re heading into formatting the content.
The visual draw of your professional report comes together with the «beautification» you apply to the content. Formatting is also an essential step for a document that flows well. So, you must focus a lot of energy on picking the right font, paragraph space, and the colors.
Don’t worry. Even, the artistically challenged will find this part easy because Microsoft Word comes packaged with default themes and visual styles. Let’s start with the most basic element of a document.
5. Pick and Style the Right Font
Your choice of font in a professional Word report not only determines how the text stands out but also how it is printed. You want both for maximum impact.
You can apply a typeface (i.e. the visual look of the font) to either an entire document or to specific parts of a document. All font choices are available from the Home tab. Go to Home > Font.
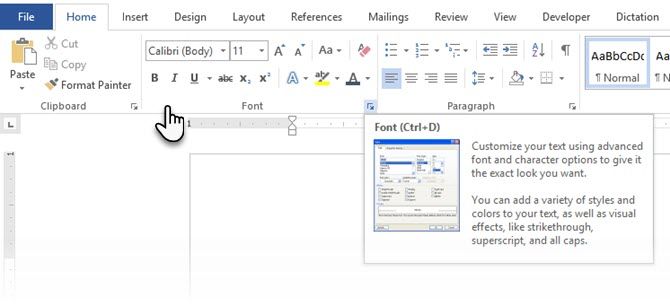
The default font in Microsoft Word 2016 is Calibri. Look beyond that as you have lots of others to choose from. If you choose Times New Roman, you may be considered lazy, if you choose Windings, well… I don’t think I need to explain that. So make sure you choose a font that is easy to read and suits the report. To play it safe, pick from one of these professional-looking Google fonts; they’re available for free.
Tip: Baskerville and Georgia are good alternatives to the over-used Times New Roman
Try different font pairing for the body text and Headings (and Subheadings). Several websites like FontJoy and TypeWolf will help you experiment with font pairings. You can download and use custom fonts too. But remember the thumb-rule — never use more than three different typefaces in a document.
For that extra bit of pizazz, try a drop cap to enhance your text.
6. Style the Paragraphs
If you want to have your lines double spaced, or single spaced, you need to change the format of the paragraphs. By changing the spacing, you can make a document easier to read or give the impression that it is longer and that you have put more work into it.
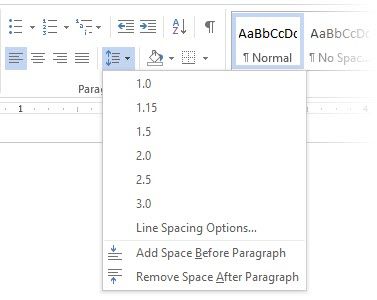
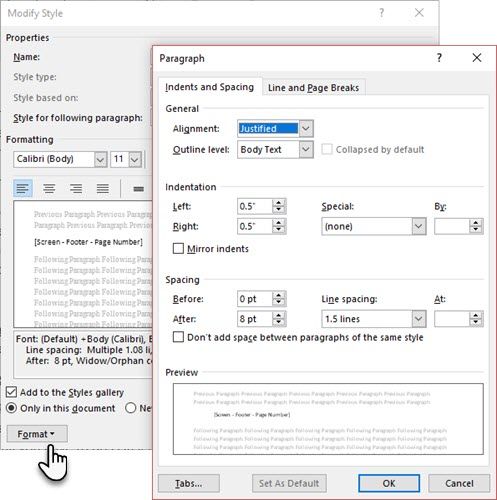
To change the paragraph for the whole document, it is best that you select each block of text; otherwise, if you are using headers in your report, they will change too. Another better option is if you customize the particular style you are using to format the paragraph.
To do this, go to Home > Styles. Right click on the style you want to change and select Modify. Click on Format > Paragraph which is at the bottom of the dialog box. Now, change the spacing, indentation, and alignment for the paragraph. Click OK to close the dialogs.
When you want to change a smaller portion of the document, select what you want to change. Right click on the highlighted text and select Paragraph. The same dialog box as above will appear.
7. Control Page Breaks
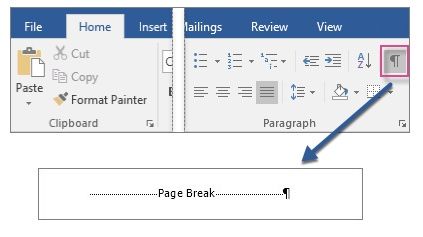
A page break — by its very name — splits a continuous block of text across two pages. Page breaks are important structural elements for long documents. Word automatically inserts a page break at the end of the page. But in a long document, you can place page breaks where you want them.
To insert a manual page break, click Insert > Page Break. (Keyboard shortcut: CTRL + Enter)
A page break looks like this when you click on the Show/Hide command in the Paragraph group.
But what if you want to keep a bunch of lines together on a page or column and not have them separate because of a page break? The layout is in your control. Click the tiny arrow you see in the bottom right of the Paragraph group.
In the Paragraph box, click Line and Page Breaks. Select from these four pagination options:
- Widow/Orphan control places at least two lines of a paragraph at the top or bottom of a page.
- Keep with next prevents breaks between paragraphs you want to stay together.
- Keep lines together prevents page breaks in the middle of paragraphs.
- Page break before adds a page break before a specific paragraph.
We’ve also shown how to remove page breaks when necessary.
8. Use Styles and Themes
Styles and themes are perhaps two of the more underused features in Microsoft Word. But I think you should use them at every opportunity to save a lot of time.
But what is the difference between a theme and a style? Microsoft says:
Themes provide a quick way to change the overall color and fonts. If you want to change text formatting quickly, Word Styles are the most effective tools.
So, as themes control the general look with color, effects, and fonts – start with a good theme for your document first. Then, use Styles to dig into the specific portions you want to change the appearance for.
For Themes: Go to the Design tab. Pick a theme from the gallery. You can see previews of what the color combination is like.
For Styles: Select the part of the text you want to change. Go to the Styles group on the Home tab. You can see previews of what they look like. Choose the Style that is suitable for your content. For instance, choose a heading style for the headings in your document. Or, a particular style for any quotes. You can also modify an existing style and create new styles from scratch.
9. Captions
Every picture, chart, or illustration needs a caption to clearly describe it. It is a single line of text, usually located below a graphic. Captions are also an important reference when you need to mention them in another place. Many documents omit this small detail.
It is easy to add a caption. Right-click the illustration you want to add a caption to. Select Add Caption.
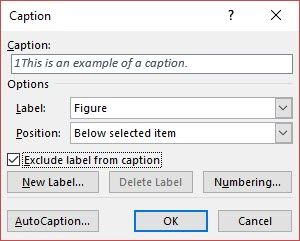
In the dialog box, add your caption text and configure the remaining options. Captions can be automatically referenced in Word.
10. Use Quick Parts
Professional documents can get repetitive. This is why you should start using Quick Parts for boilerplate content you reuse all the time. For instance, let’s say there is a contract clause you include with every document. Or, some introductory information. Instead of repeated copy-paste, save them as Quick Parts and re-use them again and again.
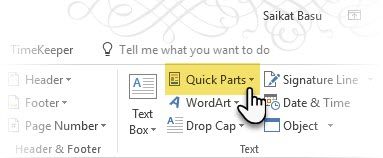
Quick Parts is also a type of building block. You can see the gallery of all reusable blocks of content in the Building Block Organizer.
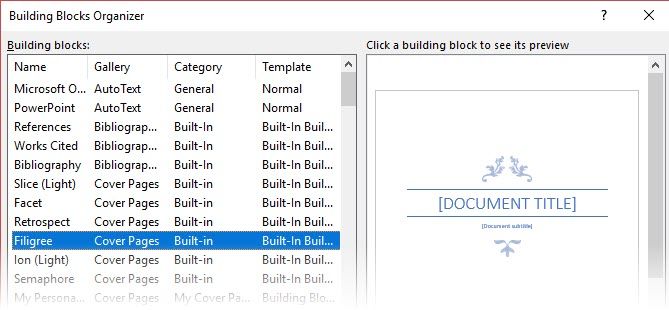
Save and reuse your own Quick Parts in two steps:
- Select the phrase, sentence, or other portion of your document that you want to save to the gallery.
- Go to Insert > Text group > Quick Parts > Save Selection to Quick Part Gallery. Change the name and add a description if you like. Click OK.
Just as easily, you can re-use the saved snippet of content.
Place your cursor where you want to insert a selection from the Quick Parts Gallery. Go to Insert > Text group > Quick Parts. Then click the sentence, phrase, or other saved selection you want to reuse.
You will notice three other categories in the Quick Parts menu.
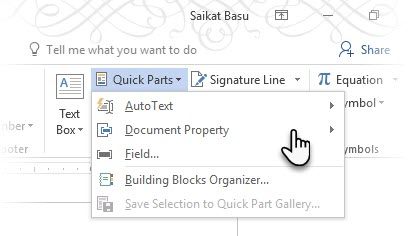
AutoText: Word 2016 has retained the old AutoText feature. It works like Quick Parts for any block of text that you use a great deal. Example: A note you want to use with every document.
Document Property: A set of constant properties that you can include with every document. Example: Company name or author.
Fields: These are predefined elements that update automatically. Example: Date, time, page numbers etc.
Remember, entries for document property can sometimes include information you wouldn’t want to share with everyone. So, keep a close eye on these fields and remove the hidden personal data whenever required.
11. Decorate With Page Borders
Page borders look good not only on flyers and invitations. If done right, they can add a touch of class to a document. A variety of line styles and widths and art borders are available from the Design menu on the Ribbon.
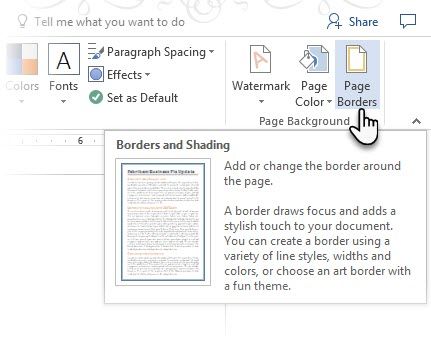
Go to Design > Page Borders.
In the Borders and Shading box, use the Page Border tab to design your border.
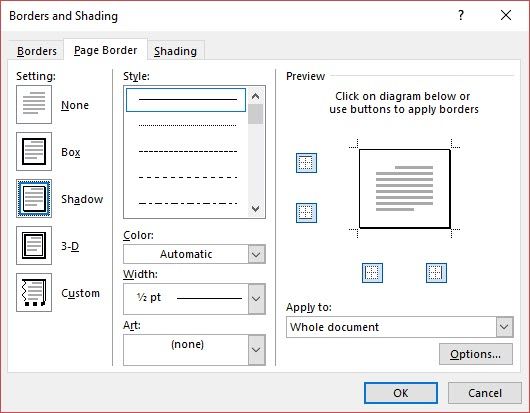
The settings are self-explanatory. Try Shadow or 3-D with the right colors to add a subtle but elegant border. The Art styles with their clip-art borders might be too garish for professional documents.
Use the four corner buttons in the Preview window to select the sides of the page to draw borders. Click these buttons to remove or add borders, as you wish.
Place the cursor on the first page of a document if you want to put a border around only the first page. You can also put borders around certain pages in a section. Place the cursor in the section — either in the first page of that section or in a subsequent page.
References and Collaboration
A Word report can seem like an unmanageable chore. It’s like organizing a million piles of hay into neat little stacks. The idea is to know precisely which stack has the pin you are looking for. These features are meant to make it easier.
1. Create an Index
When writing large documents such as a report that contains a lot of information, a contents page may not be enough. An Index should appear at the end of the document, with page numbers to keywords and information in the report. Create an index to help the reader reference the right information with just the page number.
Make an index if your document has more than 20 pages. Microsoft Word 2016 doesn’t let the process overwhelm you. It basically has two parts:
- Select the words or information you want to include in the index.
- Place the index at the right place in your document.
You can scroll through the finished document and mark the words or phrases you want to include in the index or mark them as you go along. Either way, select the text you’d like to use as an index entry or click where you want to insert the entry.
1. Click References > Mark Entry.
2. Edit the text in the Mark Index Entry dialog box. You can also add a sub-entry which further defines the main word you used in the index. You can add multiple levels and each appears indented under the main entry.
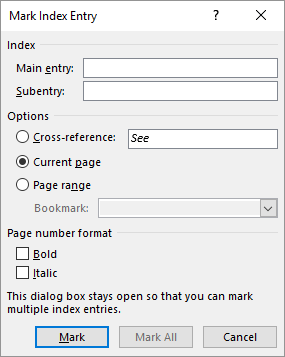
3. Under Options, you can also create a cross-reference to another main entry. A reader can use this to refer related information elsewhere in the same document.
4. Use the Page number format to decide on the appearance of the page numbers in the index.
5. Click Mark to mark the index entry. To mark this text everywhere it shows up in the document, click Mark All.
6. Repeat the process for all the words and phrases you want to include in the index.
You have now built your index. Insert it at the right place towards the end of the document.
1. Click on the page where you want to insert the index.
2. Click References > Insert Index.
3. The Index dialog box is displayed. Here you can choose to format the text entries, page numbers, tabs, and leader characters.
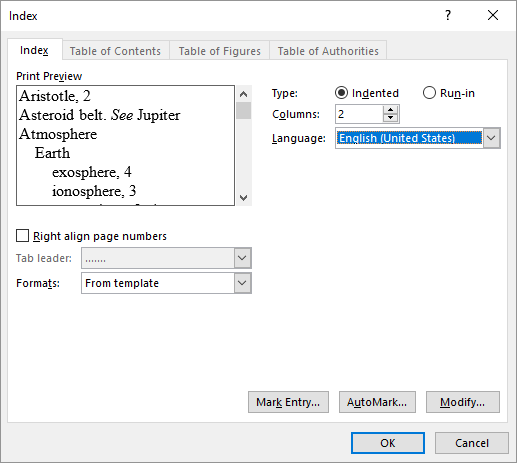
4. Choose the appearance from the different formats in the list and check the Preview window on the right. Remember, the Preview window doesn’t show you actual index. It is just a «simulation» of how it will look like.
5. Click OK. Your Index is now ready.
Sometimes, you may need to add more entries to the index after you have inserted it on the page. Mark the entry and go to References > Update index to include the new mentions.
Also, add a heading for the index because Word doesn’t do it automatically.
2. Creating Bibliographies
Your document is almost done. Now, you need to credit all the other research work and ideas which you have referenced in your document. It’s time for a bibliography.
A company report might not need a bibliography but an academic paper isn’t finished without one. The bibliography is one of the most painstaking jobs in an academic report. You need to have all your citations in order before you sit down to frame the bibliography. Also, decide on the citation style (typically MLA, APA, or Chicago-style) as per the guidelines of your subject.
Don’t hesitate to take advantage of third-party citation and bibliography generators for constructing this section.
But, Microsoft Word 2016 has a complete toolset to make this process as painless as possible. So, go to the point in the document where you would like to place the bibliography. It’s good if you have at least one citation to include, but even if you don’t, Word 2016 lets you use a placeholder citation and fill in the sources later.
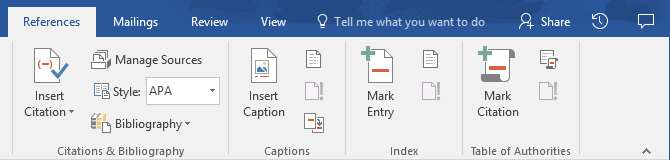
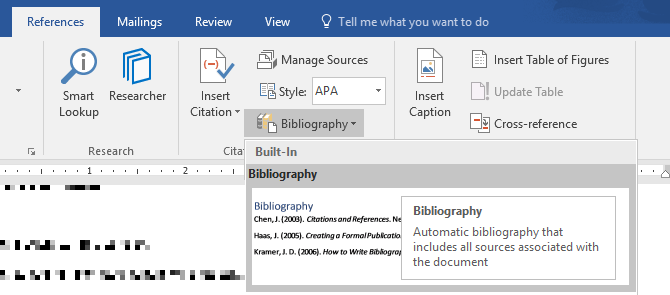
Click References > Bibliography.
Word offers a few bibliography styles that differ only in their heading names. Choose the appropriate style and then insert citations from the button in the Citations & Bibliography group.
The bibliography tool has a few steps to it. For the sake of brevity, I will direct you to the excellent Microsoft Office help page which is a step-by-step guide.
Some academic papers will ask you to create an annotated bibliography. It is a more fleshed out version of a bibliography with a list of citations to journals, books, articles, and other documents followed by a brief paragraph. The paragraph is a description of the source and how it supports your paper.
3. Cross-Referencing
You can use a cross-reference to help the reader navigate through a long document. At any point in a document, you can tell the reader to refer back to a heading, page number, image, chart, footnote, endnote, and paragraph. A cross-reference link is a neat way to connect related information together. The reader just has to click on the link to go that snippet of information.
Here’s how you begin:
1. Select the place for the cross-reference and type the text that tells the reader about it. For instance: «Refer to Chart 3 for future trends.»
2. Go to Insert > Cross-reference.
3. In the Reference type box, click the drop-down list to select what you want to link to.
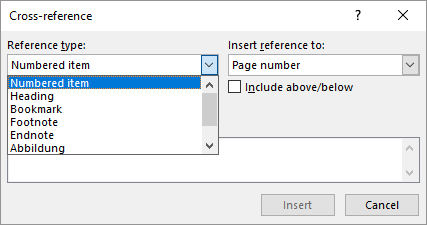
4. The options in the Insert Reference to drop-down will change according to your choice above.
5. In the For Which field, go through the choices and tell Word the exact information to link to.
6. Check the Insert as hyperlink box to create the hyperlink for the referenced information.
7. Click on Insert to include the cross-reference in the document.
Remember, our mention of captions? You can make cross-references to equations, figures, graphs, and tables if you used captions below them.
Word cannot create a cross-reference for something that does not exist. Word will let you know about these errors and also update the cross-references automatically when you change the page number or text of the referenced item.
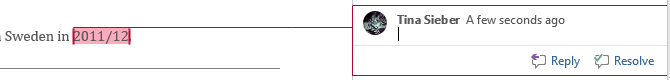
A professional report can be a solitary job or you can take the help of a team to prepare the first draft. The humble Comment is one of the most underused tools of a Word document. It is displayed as a rectangular colored balloon in the margin or in the Reviewing Pane.
You can use comments as small «stickies» or self-notes. Leave little notes to yourself in the margins as you write, edit, and revise your way through a report or a manuscript. Be creative – add extra links to other resources, use them for tips and pointers, link to different parts of a document, or set up a feedback link for your readers. And when you finalize, you can easily remove all comments in Word.
Microsoft Word 2016 is also an enhanced collaborative writing tool. Comments play a huge role in communicating feedback across a team. Here’s how the comment system works…
1. Highlight the text you want to add a comment to or click at the end of a text block.
2. Go to Insert > Comment. Type your comment in the box. The comments appear in the markup area on the right. The Print Layout view is usually the best way to see the comments alongside the text.
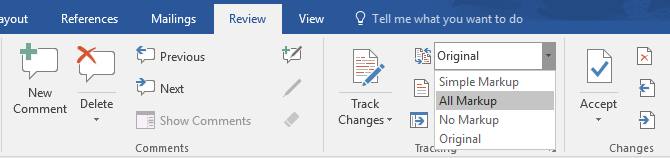
3. Go to the Review tab and see more options for comments. This tab also shows all the controls for tracking changes and comments in a collaborative document. Use the Markup options to display or hide the comments. For instance: No Markup will hide the comments and the markup area on the right.
Finalize Your Report
Once the bulk of your report is completed and saved, it is time to finalize your report. When I say finalize, I don’t mean proofread it. That should be done too. Now, you have to take the security measures to protect the report from unauthorized changes and plagiarism.
These security measures will give an extra level of authenticity to your electronic file before you share it.
This section will cover:
- Signatures
- Insert watermarks
- Make the document ‘read only’
- Password protect your document
- Print your document to PDF
1. Signatures
You can add text signature for a personal touch to the report. But a simple text signature does not need any authentication. A digital signature is the better way to protect your document from unauthorized access. A digital signature confirms that the document came from the signer and hasn’t been tampered in any way.
Let’s create a signature line in Microsoft Word 2016.
In the document, place your cursor where you want to create a signature line.
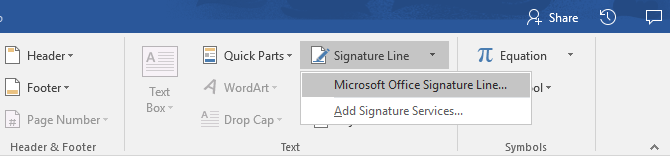
1. Go to Insert > Text group > Signature Line and click Microsoft Office Signature Line.
2. The Signature Setup dialog box is displayed. Fill the fields as indicated. If you are sending the document to someone else for signing, add instructions for the signer in the field reserved for it (Instructions to the signer). The signer can also add give the purpose for the signing if the Allow the signer to add comments in the Sign dialog box is checked.
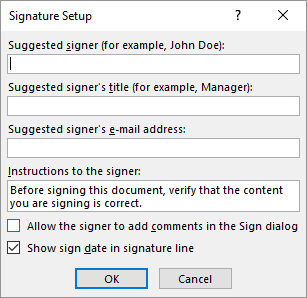
3. Click on OK and the document will now display a placeholder for the signature.
Enter a signature:
When you need to sign a document with a digital signature, go to the signature line and right-click on it.
You will be prompted to sign with a digital ID. If you don’t have one, Microsoft will tell you to get one from a signature service partner.
If you don’t have a digital ID, you can just insert a textual representation of a signature line. You can use a written signature or an image that doesn’t require authentication.
2. Insert Watermarks
A Microsoft Word watermark is a «fake» but still useful visual indicator for the status of the document. For instance, you can use a watermark that says «Drafts» to differentiate it from the final version of the document. Or, use the watermark to suggest the document is «Copyrighted» or «Confidential».
The «Draft» mark is the most common. But, Microsoft Word gives you several other watermarks to choose from.
1. Go to Design > Page Background and choose Watermark. The Watermark button will be enabled in the Print view only.
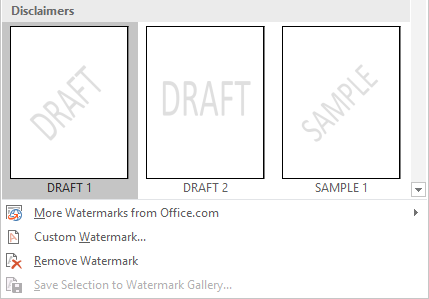
2. You can choose a picture or a text watermark from the gallery. Both horizontal and diagonal versions are available. The dialog box gives you all the customization options for the final look of the watermark. Try different fonts, layouts, sizes, and colors.
3. You can type your own text in the Text field to create your custom watermark.
4. Choose OK to apply the watermark to your document. Word automatically applies the watermark to every page except the title page.
3. Make Documents «Read Only»
A professional report by its nature should not need to be edited by its readers. Converting the document to a PDF is one way. But, you can also apply a few more restrictions in Microsoft Word and prevent accidental modification or omission of any kind.
There are three ways to protect a document.
First — Make your document «read only».
This ensures that your document can only be read or copied. It won’t prevent anyone from copying the file and making changes to the copy.
1. Go to the File tab > Info > Protect Document > Mark as Final.
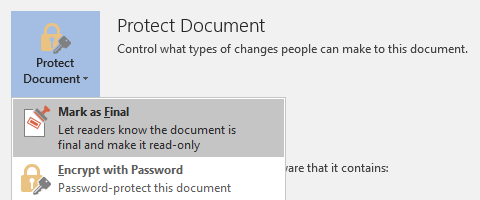
2. When readers open a document, a bar on top will prompt readers to treat this document as read only. But, they can click on «Edit Anyway» to open the document in Edit mode.
Second — Password Protect Your Document.
Protect your document from unwanted edits with a password barrier.
1. Under Protect Document, choose Encrypt with Password. Type a password and click OK.
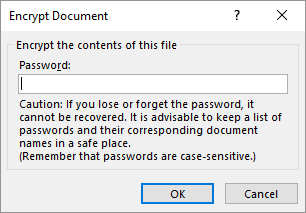
2. In the Confirm Password box, type the password again, and then click OK. The document will open with the reader prompted for a password.
Microsoft uses the AES (Advanced Encryption Standard), 128-bit key length, SHA1 (a cryptographic hashing algorithm which generates an almost unique 160-bit key to replace the plaintext), and CBC (cipher block chaining) to give a hacker a well-deserved headache.
Third — Restrict Editing.
This control feature helps you as the author decide which parts of the document others can edit and which will be locked out. Think of it as the bouncer who lets the VIPs in but otherwise bars the door for the common folk.
1. Go to Review > Restrict Editing.
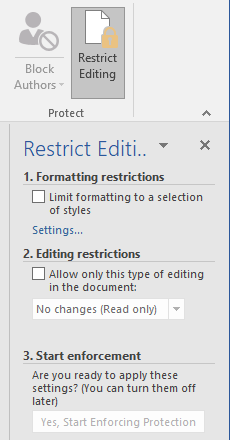
2. Under Editing restrictions, check Allow only this type of editing in the document, and make sure the list says No changes (Read only).
No changes (Read only) is the default restriction type. For a different restriction level for the document, click the menu and select from Tracked changes, Comments, or Filling in forms.
3. To free some sections from the editing blockade, select the sections for editing without restrictions. To select more than one area, click CTRL while selecting the area using the mouse.
4. You can check Everyone under Exceptions (optional) in the Restrict Editing panel. Or, click More users… and allow only specific users to modify the sections. The allowable areas will be marked with square brackets.
5. Click Yes, Start Enforcing Protection.
Now, type a unique password in the box that opens. You have to type it again to confirm it.
The password is optional. But it ensures that no one can just click Stop Protection and edit the document. If you are still paranoid, go ahead and encrypt your Microsoft Word document as we did in the second process above.
4. Print Your Report to PDF
The Portable Document Format comes with many advantages. Not least is its cross-platform compatibility across all computers. Your document is ready and now you need to share it or send it across to be printed. Many professional reports — for instance, a legal document — need to retain the format as intended.
Save or convert a copy to PDF. Microsoft Word 2016 does not need any third-party add-ins.
Go to File > Export > Create PDF/XPS.
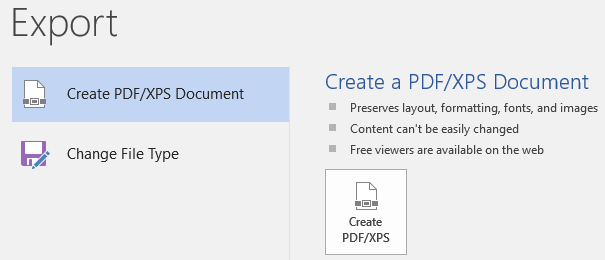
Remember, your Word document may contain sensitive information that you do not want to be included in the PDF. Remove it before you publish to PDF. In the Publish as PDF or XPS window, choose Options. Then select Document and clear Document properties. Set any other options you want and choose OK.
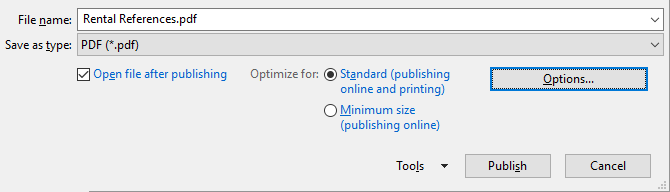
Browse to where you want to save the file and click on Publish.
The Next Step…
You are close to the finishing line. The report is ready to be handed over to your readers. But there’s one last job left.
Turn the pages and make sure (again) that your report is reader-friendly. Approach it with the eye of the reader. Have you organized your thoughts and written persuasively? Does the information flow well with the charts and illustrations? Can they skim through and find the information quickly? Is the text readable? Use the readability score to gauge the readability level of your documents as a final step.
You also might have noticed we didn’t cover some aspects of Microsoft Word. For instance, Microsoft Word Tables are an important tool for data display. Or, the power of lists in information management.
Microsoft Word is more than a quarter of a century old, and packed with little features. At MakeUseOf, we have covered every nook and cranny of this beast. So, do use our resources to learn more about this software for free. Each new feature of Microsoft Word learned will make your life easier.
Make Your Report Shine
As author Nathaniel Hawthorne said,
Easy reading is damn hard writing
Isn’t this true for professional report writing too? After all, if given a choice, no one may want to read it. Writing a business report and using it to communicate are two different things. Microsoft Word is just a tool — it’s your job to engage.
For some alternatives, check out the best online word processors. And for more help with professional writing, take a look at how to apologize in an email and mean it.
What are the best practices for writing professional business reports? Tell us in the comments.
Как должна выглядеть курсовая работа по ГОСТу
Основной стандарт, регламентирующий оформление статей, рефератов, курсовых работ и прочего − это ГОСТ 7.32–2017. Курсовая работа по ГОСТу должна содержать следующие разделы:
- Титульный лист.
- Содержание (план).
- Введение.
- Основная часть.
- Заключение (выводы).
- Список используемых источников.
- Приложения.
Основные требования к оформлению курсовых работ по ГОСТу:
- Шрифт Times New Roman, не менее 12 пт.
- Межстрочный интервал − 1,5.
- Каждый новый абзац начинают с красной строки, выбирая отступ, равный 1,25 см.
- Весь основной текст выравнивается по ширине.
- Важно выставить правильные поля документа: у левого ширина должна быть не менее 3 см, у правого − 1 см, у верхнего и у нижнего − по 2 см.
Основные требования к написанию курсовых работ:
- На титульном листе прописываются все сведения об учебном заведении и кафедре, дисциплине и названии курсовой, о себе и преподавателе, годе и городе издания. На таком листе запрещена нумерация страницы.
- Оглавление является указателем всех заголовков и подпунктов. Обязательно, чтобы около каждого заголовка была указана страница, на которой его можно будет найти внутри текста.
- Во введении должны быть обозначены актуальность, цели и задачи, предмет и объект, обзор литературы, а также гипотеза и перспективность научного исследования. Важно, чтобы объем введения составлял примерно 10 % от масштабов курсовой работы.
- Каждая глава и подраздел оформляется своим порядковым номером арабскими цифрами, причем разделы важно начинать с нового листа. Не нумеруются только «Введение», «Оглавление», «Заключение», «Список используемой литературы», а также «Приложения», но при этом они пишутся по центру с заглавной буквы. Подразделы нумеруются в строгом порядке внутри своего раздела, причем номер состоит сначала из цифры раздела, а дальше идет цифра непосредственно подраздела, между ними ставится точка. Если внутри подразделов есть пункты, номер состоит из 3 цифр – раздела, подраздела, пункта, между ними также ставятся точки. Пункты не выделяются заголовками и идут обычным текстом.
- Если предусмотрен числовой материал, он может быть выражен в виде таблицы. Ее в обязательном порядке нумеруют, располагая надпись «Таблица» и номерной знак над ее правым верхним углом. Все таблицы, кроме тех, что располагаются в папке с приложениями, нумеруют сквозной нумерацией арабскими символами в пределах раздела (ставится номер раздела, точка, номер таблицы).Максимально допустимый размер шрифта в таблицах – 12 кеглей. Допускается деление таблицы между страницами. К каждой новой части таблицы добавляется строка с нумерацией столбцов или строк, но на 2 кегля меньше, чем первоначально. Если на странице остается меньше 3 строк кроме заголовков, тогда разрыв недопустим. На второй странице пишут «продолжение табл. …» или «окончание табл. …».
- Если в тексте предусмотрены формулы, их печатают на отдельной строке от текста. Нумерация арабскими цифрами сквозным методом либо по всему тексту, либо внутри раздела. Номер указывается внутри круглых скобок справа от формулы. Внутри текста располагаются ссылки на формулы, причем между словом «формула» и ее номером ставят неразрывный пробел комбинацией Ctrl+Shift+Пробел.
- Если автор использует наглядные материалы, в частности, рисунки и иллюстрации, они могут присутствовать как в папке с приложениями, так и внутри текста. Приветствуется сквозная нумерация арабскими цифрами, если же это иллюстрации в приложениях, их нумеруют в пределах раздела, например, «Рис. 1.3».
- Правила оформления библиографического списка указываются в ГОСТ 7.1-2003. Этот раздел проекта располагается после заключения, но перед папкой с приложениями. Все источники указываются в алфавитном порядке, либо в групповом порядке – сначала нормативные акты, далее основные источники, а после электронные ресурсы.
- Приложения – это вспомогательные наглядные материалы. Каждый отдельный элемент, будь то таблица, схема, диаграмма, рисунок, располагается на отдельном листе. Наверху справа пишется «Приложение №», если их предусмотрено несколько. Кроме того приложение имеет и заголовок симметрично тексту отдельной строкой с заглавной буквы.
Порядок оформления курсовой работы в Ворде
Первый шаг: создание файла
1. Выполните команду «Пуск» – «Все программы» − «Microsoft Office» − «Word».(рисунок 1)
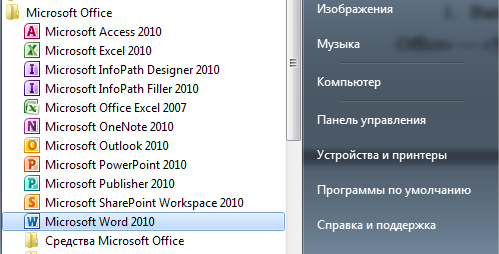
Рисунок 1. «Пуск» – «Все программы» − «Microsoft Office» − «Word»
2. Щелкните мышкой по кнопке «Файл», в появившемся меню наведите указатель мыши на команду «Сохранить как», настройте место сохранения документа на компьютере, а затем укажите, в виде чего хотите сохранить документ «Документ Word». В диалоговом окне «Сохранение документа» в поле «Имя файла» укажите название. Нажмите кнопку «Сохранить». (рисунок 2)
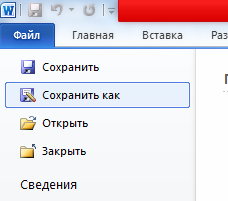
Рисунок 2. Файл — Сохранить как
Второй шаг: параметры страницы
1. Установите параметры форматирования документа. На вкладке «Главная» выберите инструменты: шрифт – TimesNewRoman, размер − 14 пт. (рисунок 3)
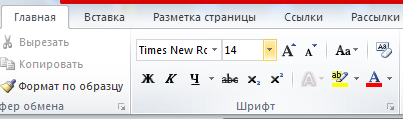
Рисунок 3. Шрифт – Times New Roman, размер − 14 пт
2. На вкладке «Главная» выберите «Абзац», нажмите кнопку «Интервал» и выберите полуторный межстрочный интервал – 1,5. (рисунок 4)
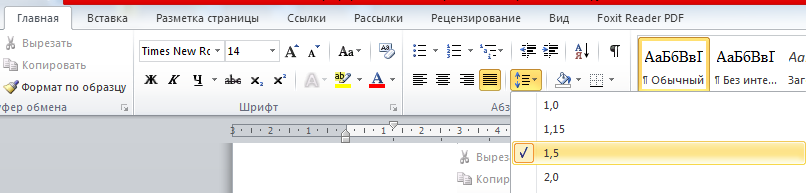
Рисунок 4. «Главная» — «Абзац» — «Интервал
3. На вкладке «Главная» установите выравнивание текста. Правильное выравнивание − по ширине страницы. (рисунок 5)
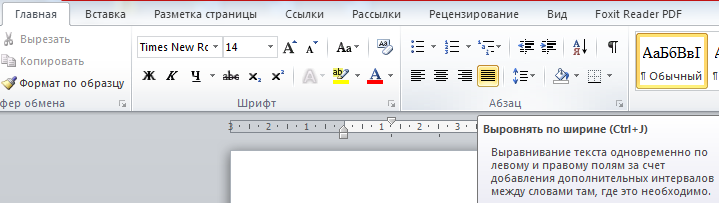
Рисунок 5. Выравнивание − По ширине страницы
4. Задайте вид красной строки. На вкладке «Главная» выберите «Абзац», нажмите кнопку «Первая строка» и отредактируйте значение «Отступ», укажите величину смещения в поле на 1,25 см, нажмите «Ок». (рисунок 6)
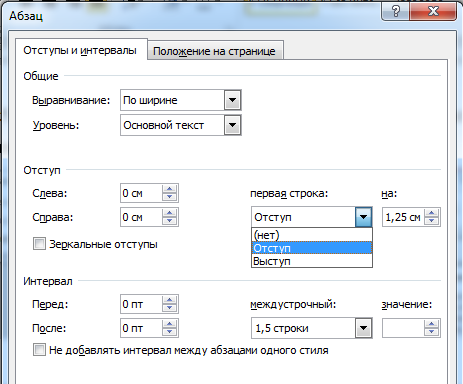
Рисунок 6. Отступы и интервалы
5. Установите поля страницы. Для этого перейдите во вкладку «Разметка страницы» – «Поля» − «Настраиваемые поля». Выберите «Обычные». (рисунок 7)
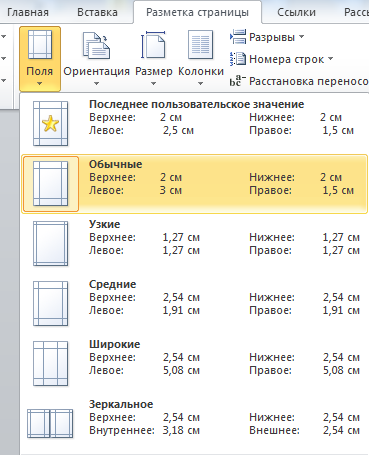
Рисунок 7. «Поля» — «Настраиваемые поля» — «Обычные»
6. Каждую новую главу начинайте с новой страницы, выполнив вставку разрывов страниц. В группе «Параметры страницы» во вкладке «Разметка страницы» нажмите кнопку «Разрывы», далее «Разрывы страниц». (рисунок 
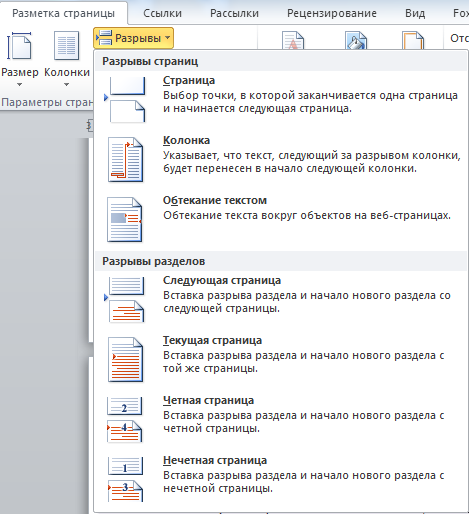
Рисунок 8. «Параметры страницы» — «Разметка страницы» — «Разрывы» — «Разрывы страниц»
Третий шаг: нумерация страниц
1. Пронумеруйте страницы документа, разместив номер в нижнем поле по центру и исключив номер на титульной странице. Для вставки номеров страниц нажмите «Вставка» − «Колонтитулы» − «Номер страницы» и выберите нужное место расположения номеров страниц «Внизу страницы». (рисунок 9)
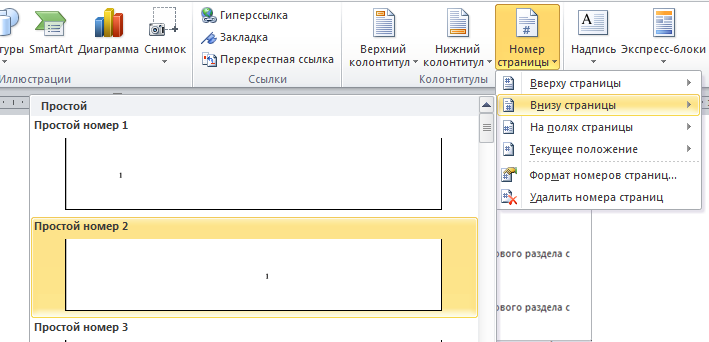
Рисунок 9. «Вставка» − «Колонтитулы» − «Номер страницы»
2. Установите особый колонтитул для первой страницы. Для этого выберите «Вставка» − «Колонтитулы» − «Нижний колонтитул» − «Изменить нижний колонтитул». Откроется окно «Работа с колонтитулами», где нужно установить галочку «Особый колонтитул для первой страницы». Затем нажмите на красный крестик «Закрыть окно колонтитулов». (рисунок 10)
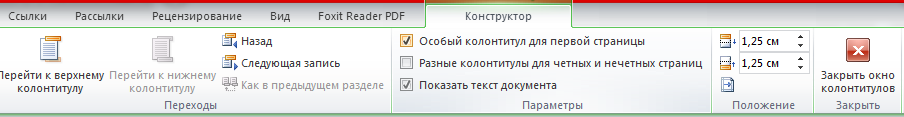
Рисунок 10. «Вставка» − «Колонтитулы» − «Нижний колонтитул» − «Изменить нижний колонтитул»
Четвертый шаг: титульный лист
Подготовьте титульную страницу реферата. Для этого введите необходимые атрибуты титульного листа. Образец правильного оформления титульного листа представлен на рисунке ниже.
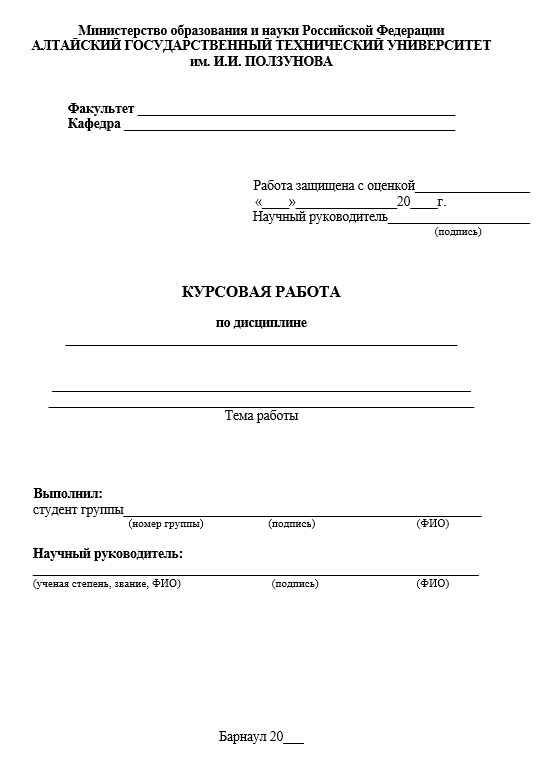
Рисунок 11. Образец правильного титульного листа
Пятый шаг: оглавление
Создайте автособираемое оглавление. Установите курсор мыши на чистом листе. Перейти к новой странице можно, нажав на «Разрыв страницы». Во вкладке «Ссылки» щелкните мышью по «Оглавлению» и в перечне выберите одно из подходящих содержаний. (рисунок 11).
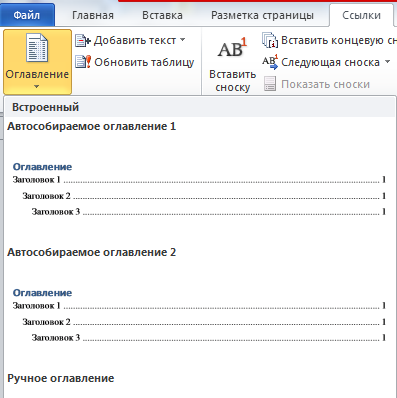
Рисунок 12. «Ссылки» — «Оглавление»
Примеры и образцы оформления курсовой работы
Рисунок 13. Образец титульного листа
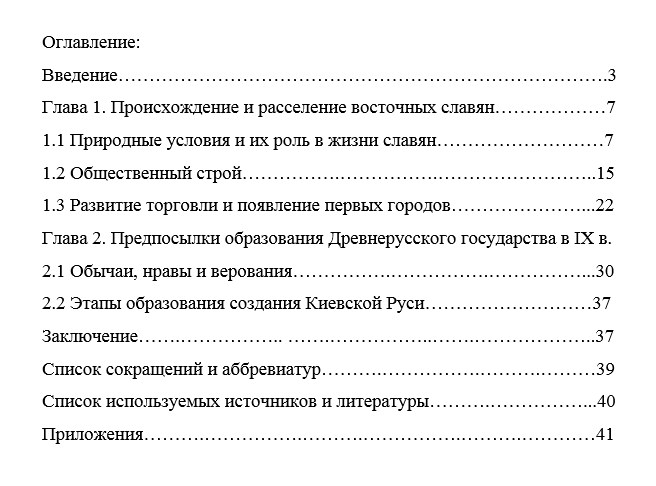
Рисунок 14. Пример оглавления
Рисунок 15. Образец основной части
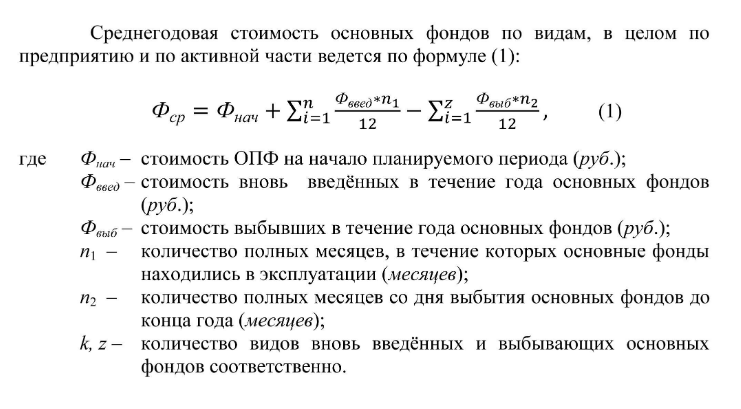
Рисунок 16. Пример оформления формулы
Ответы на вопросы
Какой стандарт регламентирует оформление курсовых работ?
Основной стандарт, регламентирующий оформление любого текстового документа, в том числе и составление курсовой работы − это ГОСТ 7.32–2017.
Как должна выглядеть структура курсовой работы согласно ГОСТу?
Структура курсовой работы включает следующие элементы: титульный лист, содержание, введение, основная часть, заключение, список использованной литературы, приложения.
Что должно быть во введении?
Во введении должны быть обозначены актуальность, цели и задачи, предмет и объект, гипотеза и перспективность научного исследования, а также приведен обзор литературы.