
xlsread
(Not recommended) Read Microsoft
Excel spreadsheet file
Syntax
Description
example
num = xlsread(filename)
reads the first worksheet in the Microsoft®
Excel® spreadsheet workbook named filename and
returns the numeric data in a matrix.
num = xlsread(filename,sheet)
reads the specified worksheet.
example
num = xlsread(filename,xlRange)
reads from the specified range of the first worksheet in the workbook. Use
Excel range syntax, such as 'A1:C3'.
example
num = xlsread(filename,sheet,xlRange)
reads from the specified worksheet and range.
num = xlsread(filename,sheet,xlRange,'basic')
reads data from the spreadsheet in basic import mode. If your
computer does not have Excel for Windows® or if you are using MATLAB®
Online™, xlsread automatically operates in
basic import mode, which supports XLS, XLSX, XLSM, XLTX,
and XLTM files.
If you do not specify all the arguments, use empty character vectors,
'' , as placeholders, for example, num =.
xlsread(filename,'','','basic')
example
[num,txt,raw]

= xlsread(___)
additionally returns the text fields in cell array txt, and
both numeric and text data in cell array raw, using any of
the input arguments in the previous syntaxes.
___ = xlsread(filename,-1)
opens an Excel window to interactively select data. Select the worksheet, drag
and drop the mouse over the range you want, and click OK.
This syntax is supported only on Windows computers with Microsoft
Excel software installed.
example
[,num,txt,raw,custom]
= xlsread(filename,sheet,xlRange,'',processFcn)
where processFcn is a function handle, reads from the
spreadsheet, calls processFcn on the data, and returns the
final results as numeric data in array num. The
xlsread function returns the text fields in cell array
txt, both the numeric and text data in cell array
raw, and the second output from
processFcn in array custom. The
xlsread function does not change the data stored in the
spreadsheet. This syntax is supported only on Windows computers with Excel software.
Examples
collapse all
Read Worksheet Into Numeric Matrix
Create an Excel file named myExample.xlsx.
values = {1, 2, 3 ; 4, 5, 'x' ; 7, 8, 9};
headers = {'First','Second','Third'};
xlswrite('myExample.xlsx',[headers; values]);
Sheet1 of myExample.xlsx
contains:
   First    Second    Third
       1         2        3
       4         5    x
       7         8        9
Read numeric data from the first worksheet.
filename = 'myExample.xlsx';
A = xlsread(filename)
Read Range of Cells
Read a specific range of data from the Excel file in the previous example.
filename = 'myExample.xlsx';
sheet = 1;
xlRange = 'B2:C3';

subsetA = xlsread(filename,sheet,xlRange)
Read Column
Read the second column from the Excel file in the first example.
filename = 'myExample.xlsx';

columnB = xlsread(filename,'B:B')
For better performance, include the row numbers in the range, such as
'B1:B3'.
Request Numeric, Text, and Raw Data
Request the numeric data, text data, and combined data from
the Excel file in the first example.
[num,txt,raw] = xlsread('myExample.xlsx')
num =
     1     2     3
     4     5   NaN
     7     8     9

txt =
    'First'    'Second'    'Third'
    ''         ''          ''
    ''         ''          'x'

raw =
    'First'    'Second'    'Third'
    [    1]    [     2]    [    3]
    [    4]    [     5]    'x'
    [    7]    [     8]    [    9]
Execute a Function on a Worksheet
In the Editor, create a function to process data from a worksheet. In this
case, set values outside the range [0.2,0.8] to
0.2 or 0.8.
function [Data] = setMinMax(Data)

minval = 0.2;
maxval = 0.8;

for k = 1:Data.Count
  v = Data.Value{k};
  if v > maxval
    Data.Value{k} = maxval;
  elseif v < minval
    Data.Value{k} = minval;
  end
end
In the Command Window, add random data to
myExample.xlsx.
A = rand(5);
xlswrite('myExample.xlsx',A,'MyData')
The worksheet named MyData contains values ranging from
0 to 1.
Read the data from the worksheet, and reset any values outside the range
[0.2,0.8]. Specify the sheet name, but use
'' as placeholders for the
xlRange and 'basic'
inputs.
trim = xlsread('myExample.xlsx','MyData','','',@setMinMax);
Request Custom Output
Execute a function on a worksheet and display the custom
index output.
In the Editor, modify the function setMinMax from the
previous example to return the indices of the changed elements (custom
output).
function [Data,indices] = setMinMax(Data)

minval = 0.2;
maxval = 0.8;
indices = [];

for k = 1:Data.Count
  v = Data.Value{k};
  if v > maxval
    Data.Value{k} = maxval;
    indices = [indices k];
  elseif v < minval
    Data.Value{k} = minval;
    indices = [indices k];
  end
end
Read the data from the worksheet MyData, and request
the custom index output, idx.
[trim,txt,raw,idx] = xlsread('myExample.xlsx',...
    'MyData','','',@setMinMax);
Input Arguments
collapse all
filename — File name
character vector | string
File name, specified as a character vector or a string. If you do not
include an extension, xlsread searches for a file with
the specified name and a supported Excel extension. xlsread can read data saved in
files that are currently open in Excel for Windows.
Example: 'myFile.xlsx' or
"myFile.xlsx"
Data Types: char | string
sheet — Worksheet
character vector | string | positive integer
Worksheet, specified as one of the following:
-
Character vector or string that contains the worksheet name. The
name cannot contain a colon (:). To determine the
names of the sheets in a spreadsheet file, use
xlsfinfo. For XLS files in
basicmode,sheetis case
sensitive. -
Positive integer that indicates the worksheet index. This option
is not supported for XLS files inbasic
mode.
Data Types: char | string | single | double | int8 | int16 | int32 | int64 | uint8 | uint16 | uint32 | uint64
xlRange — Rectangular range
character vector | string
Rectangular range, specified as a character vector or a string.
Specify xlRange using two opposing corners that define
the region to read. For example, 'D2:H4' represents the
3-by-5 rectangular region between the two corners D2 and
H4 on the worksheet. The xlRange
input is not case sensitive, and uses Excel A1 reference style (see Excel help).
Range selection is not supported when reading XLS files in
basic mode. In this case, use ''
in place of xlRange.
If you do not specify sheet, then
xlRange must include both corners and a colon
character, even for a single cell (such as 'D2:D2').
Otherwise, xlsread interprets the input as a worksheet
name (such as 'sales' or 'D2').
If you specify sheet, then xlRange:
-
Does not need to include a colon and opposite corner to
describe a single cell. -
Can refer to a named range that you defined in the Excel file (see the Excel help).
When the specified xlRange overlaps merged cells:
-
On Windows computers with Excel,
xlsreadexpands the range to
include all merged cells. -
On computers without Excel for Windows,
xlsreadreturns data for the
specified range only, with empty orNaN
values for merged cells.
Data Types: char | string
'basic' — Flag to request reading in basic mode
character vector | string
Flag to request reading in basic mode, specified as the
character vector or a string, 'basic'.
basic mode is the default for computers without
Excel for Windows. In basic mode,
xlsread:
-
Reads XLS, XLSX, XLSM, XLTX, and XLTM files only.
-
Does not support an
xlRangeinput when reading
XLS files. In this case, use''in place of
xlRange. -
Does not support function handle inputs.
-
Imports all dates as Excel serial date numbers. Excel serial date numbers use a different reference date
than MATLAB date numbers.
Data Types: char | string
processFcn — Handle to a custom function
function handle
Handle to a custom function. This argument is supported only on
Windows computers with Excel software. xlsread reads from the
spreadsheet, executes your function on a copy of the data, and returns the
final results. xlsread does not change the data stored in
the spreadsheet.
When xlsread calls the custom function, it passes a
range interface from the Excel application to provide access to the data. The custom function
must include this interface both as an input and output argument. (See Execute a Function on a Worksheet)
Example: @myFunction
Output Arguments
collapse all
num — Numeric data
matrix
Numeric data, returned as a matrix of double values.
The array does not contain any information from header lines, or from outer
rows or columns that contain nonnumeric data. Text data in inner spreadsheet
rows and columns appear as NaN in the
num output.
txt — Text data
cell array
Text data, returned as a cell array. Numeric values in inner spreadsheet
rows and columns appear as empty character vectors, '',
in txt.
For XLS files in basic import mode, the
txt output contains empty character vectors,
'', in place of leading columns of numeric data that
precede text data in the spreadsheet. In all other cases,
txt does not contain these additional columns.
Undefined values (such as '#N/A') appear in the
txt output as '#N/A', except for
XLS files in basic mode.
raw — Numeric and text data
cell array
Numeric and text data from the worksheet, returned as a cell array.
On computers with Excel for Windows, undefined values (such as '#N/A') appear
in the raw output as 'ActiveX. For XLSX, XLSM, XLTX, and XLTM files on other
VT_ERROR:'
computers or in MATLAB
Online, undefined values appear as '#N/A'.
custom — Second output of the function corresponding to processFcn
defined by the function
Second output of the function corresponding to
processFcn. The value and data type of
custom are determined by the function.
Limitations
-
xlsreadreads only 7-bit ASCII characters. -
xlsreaddoes not support non-contiguous ranges. -
If your computer does not have Excel for Windows or if you are using MATLAB
Online,xlsreadautomatically operates in
basicimport mode. -
On Linux® and Mac platforms,
xlsreadcannot open spreadsheet
files written by thewritetablefunction.
Algorithms
-
xlsreadimports formatted text representing dates (such as
'10/31/96'), except when importing in
basicmode.
Version History
Introduced before R2006a
expand all
R2019a: xlsread is not recommended
xlsread is not recommended. Use readtable, readmatrix, or readcell instead. There are no plans to remove
xlsread.
Starting in R2019a, import spreadsheet data as a table, a matrix, or a cell array
by using readtable, readmatrix, or
readcell respectively. The readtable,
readmatrix, and readcell functions have
these advantages over the xlsread function:
-
Better cross-platform support and performance
-
Automatic detection of data format and types
-
Ability to use import options to control the data import process,
including the handling of errors and missing data
This table shows typical usages of xlsread and how to update
your code to use readtable, readmatrix, or
readcell instead.
|
Not Recommended |
Recommended |
|---|---|
|
Read spreadsheet data as a matrix using M = xlsread(filename) |
Read spreadsheet data as a T = readtable(filename) However, M = readmatrix(filename) |
|
Read spreadsheet data as a cell array using [~,~,C] = xlsread(filename) |
Import spreadsheet data as a T = readtable(filename) However, C = readcell(filename) |
|
Read a specific sheet and range as a matrix using M = xlsread(filename,sheet,range) |
Read a specific sheet and range as a T = readtable(filename,'Sheet',sheet,'Range',range) However, M = readmatrix(filename,'Sheet',sheet,'Range',range) |
|
Read a specific sheet and range as a cell array using [~,~,C] = xlsread(filename,sheet,range) |
Read a specific sheet and range as a T = readtable(filename,'Sheet',sheet,'Range',range) However, C = readcell(filename,'Sheet',sheet,'Range',range) |
![]()
ячейки ввода, определяются в строках Width и Height и раскрывающемся списке Units.
Ячейки вывода с окончательными результатами преобразовываются в текст выбором пункта Undefine Cells меню Notebook. Пользователь может переопределить стили шаблона m-book.dot так же, как и любого другого стиля, выбрав в меню Формат пункт Стили и форматирование и произведя нужные установки в появившемся диалоговом окне.
Квадратные скобки, ограничивающие ячейки и группы ячеек, пропадают при выборе пункта Hide Cell Markers меню Notebook. Пункт Show Cell Markers служит для отображения скобок в документе. При печати М- книги скобки не выводятся.
Чтение рабочего листа Excel в числовую матрицу Matlab
Создадим файл Excel с именем myExample.xlsx в рабочем каталоге Matlab. Для этого в окне Matlab выполним следующие команды
Лист с именем Лист1 в файле myExample.xlsx содержит следующие данные:
Прочтем числовые данные с первого рабочего листа Excel.
11

Чтение диапазона ячеек
Прочтем заданный диапазон ячеек из файла Excel определенного в предыдущем примере.
Чтение столбца
Прочтем второй столбец из файла Excel из первого примера.
Для получения лучшего результата рекомендуется в задаваемый диапазон включать номера строк, например, ‘B2:B4’.
Получение числовых, текстовых и необработанных данных
Примерполучениячисловых,текстовыхинеобработанных(комбинированных) данных из файла Excel, созданного в первом примере.
12

Вычисление функции на рабочем листе Excel
В Редакторе Matlab (Editor – New – Function) создадим функцию, оперирующую с данными, расположенными на рабочем листе Excel. Значениям, выходящим за пределы диапазона [0.2,0.8] будем присваивать значения 0.2 или 0.8. Функцию сохраним в файле SetMinMax.m в рабочем каталоге.
13

В Command Window добавим случайные данные к файлу myExample.xlsx.
Порезультатамвыполненияэтихкомандпоявляетсяинформационное предупреждение о том, что к заданному файлу произошло добавление нового рабочего листа и в этот лист занесены определенные нами данные.
Рабочий лист с именем MyData содержит величины в диапазоне от 0
до 1.
14
(Не рекомендуемый)
файл электронной таблицы Read Microsoft Excel
Синтаксис
Описание
пример
num = xlsread(filename)filename и возвращает числовые данные в матрице.
num = xlsread(filename,sheet)
пример
num = xlsread(filename,xlRange)'A1:C3'.
пример
num = xlsread(filename,sheet,xlRange)
num = xlsread(filename,sheet,xlRange,'basic')basic импортируйте режим. Если ваш компьютер не имеет Excel для Windows® или если вы используете MATLAB® Online™, xlsread автоматически действует в basic импортируйте режим, который поддерживает XLS, XLSX, XLSM, XLTX и файлы XLTM.
Если вы не задаете все аргументы, используйте пустые символьные вектора, '' , как заполнители, например, num = xlsread(filename,'','','basic').
пример
[ дополнительно возвращает текстовые поля в массиве ячеек num,txt,raw]
= xlsread(___)txt, и и числовые данные и текстовые данные в массиве ячеек raw, использование любого из входных параметров в предыдущих синтаксисах.
___ = xlsread( открывает окно Excel, чтобы в интерактивном режиме выбрать данные. Выберите рабочий лист, перетащите мышью мышь в области значений, которую вы хотите и нажимаете OK. Этот синтаксис поддерживается только на компьютерах Windows с установленным программным обеспечением Microsoft Excel.filename,-1)
пример
[, где num,txt,raw,custom]
= xlsread(filename,sheet,xlRange,'',processFcn)processFcn указатель на функцию, чтения из электронной таблицы, processFcn вызовов на данных, и возвращает конечные результаты как числовые данные в массиве num. xlsread функция возвращает текстовые поля в массиве ячеек txt, и числовые данные и текстовые данные в массиве ячеек raw, и второй выход от processFcn в массиве custom. xlsread функция не изменяет данные, хранимые в электронной таблице. Этот синтаксис поддерживается только на компьютерах Windows с программным обеспечением Excel.
Примеры
свернуть все
Чтение рабочего листа в числовую матрицу
Создайте файл с именем Excel myExample.xlsx.
values = {1, 2, 3 ; 4, 5, 'x' ; 7, 8, 9};
headers = {'First','Second','Third'};
xlswrite('myExample.xlsx',[headers; values]);
Sheet1 из myExample.xlsx содержит:
   First    Second    Third
       1         2        3
       4         5    x
       7         8        9
Считайте числовые данные из первого рабочего листа.
filename = 'myExample.xlsx';
A = xlsread(filename)
Чтение области значений ячеек
Считайте определенную область значений данных из файла Excel в предыдущем примере.
filename = 'myExample.xlsx';
sheet = 1;
xlRange = 'B2:C3';

subsetA = xlsread(filename,sheet,xlRange)
Чтение столбца
Считайте второй столбец из файла Excel в первом примере.
filename = 'myExample.xlsx';

columnB = xlsread(filename,'B:B')
Для лучшей эффективности включайте номера строк в область значений, такие как 'B1:B3'.
Числовой запрос, текст и необработанные данные
Запросите числовые данные, текстовые данные и объединенные данные из файла Excel в первом примере.
[num,txt,raw] = xlsread('myExample.xlsx')
num =
     1     2     3
     4     5   NaN
     7     8     9

txt =
    'First'    'Second'    'Third'
    ''         ''          ''
    ''         ''          'x'

raw =
    'First'    'Second'    'Third'
    [    1]    [     2]    [    3]
    [    4]    [     5]    'x'
    [    7]    [     8]    [    9]
Выполнение функции на рабочем листе
В Редакторе создайте функцию, чтобы обработать данные из рабочего листа. В этом случае установите значения вне области значений [0.2,0.8] к 0.2 или 0.8.
function [Data] = setMinMax(Data)

minval = 0.2;
maxval = 0.8;

for k = 1:Data.Count
  v = Data.Value{k};
  if v > maxval
    Data.Value{k} = maxval;
  elseif v < minval
    Data.Value{k} = minval;
  end
end
В Командном окне добавьте случайные данные в myExample.xlsx.
A = rand(5);
xlswrite('myExample.xlsx',A,'MyData')
Рабочий лист под названием MyData содержит значения в пределах от от 0 до 1.
Считайте данные из рабочего листа и сбросьте любые значения вне области значений [0.2,0.8]. Задайте имя листа, но используйте '' как заполнители для xlRange и 'basic' входные параметры.
trim = xlsread('myExample.xlsx','MyData','','',@setMinMax);
Запрос пользовательского Вывода
Выполните функцию на рабочем листе и отобразите пользовательский индекс выход.
В Редакторе измените функциональный setMinMax от предыдущего примера, чтобы возвратить индексы измененных элементов (пользовательский выход).
function [Data,indices] = setMinMax(Data)

minval = 0.2;
maxval = 0.8;
indices = [];

for k = 1:Data.Count
  v = Data.Value{k};
  if v > maxval
    Data.Value{k} = maxval;
    indices = [indices k];
  elseif v < minval
    Data.Value{k} = minval;
    indices = [indices k];
  end
end
Считайте данные из рабочего листа MyData, и запросите пользовательский индекс выход, idx.
[trim,txt,raw,idx] = xlsread('myExample.xlsx',...
    'MyData','','',@setMinMax);
Входные параметры
свернуть все
filename FileName
вектор символов | строка
Имя файла в виде вектора символов или строки. Если вы не включаете расширение, xlsread поиски файла с указанным именем и поддерживаемым расширением Excel. xlsread может считать данные, сохраненные в файлах, которые в настоящее время открыты в Excel для Windows.
Пример: 'myFile.xlsx' или "myFile.xlsx"
Типы данных: char | string
sheet — Рабочий лист
вектор символов | представляет в виде строки | положительное целое число
Рабочий лист в виде одного из следующего:
-
Вектор символов или строка, которая содержит имя рабочего листа. Имя не может содержать двоеточие (
:). Чтобы определить имена листов в файле электронной таблицы, используйтеxlsfinfo. Для файлов XLS вbasicрежим,sheetявляется чувствительным к регистру. -
Положительное целое число, которое указывает на индекс рабочего листа. Эта опция не поддерживается для файлов XLS в
basicрежим.
Типы данных: char | string | single | double | int8 | int16 | int32 | int64 | uint8 | uint16 | uint32 | uint64
xlRange — Прямоугольная область значений
вектор символов | строка
Прямоугольная область значений в виде вектора символов или строки.
Задайте xlRange использование двух противостоящих углов, которые задают область, чтобы читать. Например, 'D2:H4' представляет прямоугольную область 3 на 5 между этими двумя углами D2 и H4 на рабочем листе. xlRange вход не является чувствительным к регистру, и использует стиль ссылки Excel A1 (см. справку Excel).
Выбор области значений не поддерживается при чтении файлов XLS в basic режим. В этом случае используйте '' вместо xlRange.
Если вы не задаете sheet, затем xlRange должен включать оба угла и символ двоеточия, даже для отдельной ячейки (такие как 'D2:D2'). В противном случае, xlsread интерпретирует вход как имя рабочего листа (такое как 'sales' или 'D2').
Если вы задаете sheet, затем xlRange:
-
Не должен включать двоеточие и противоположный угол, чтобы описать отдельную ячейку.
-
Может относиться к именованной области значений, которую вы задали в файле Excel (см. справку Excel).
Когда заданный xlRange объединенные ячейки перекрытий:
-
На компьютерах Windows с Excel,
xlsreadрасширяет область значений, чтобы включать все объединенные ячейки. -
На компьютерах без Excel для Windows,
xlsreadвозвращает данные для заданной области только, с пустым илиNaNзначения для объединенных ячеек.
Типы данных: char | string
'basic' — Отметьте, чтобы запросить чтение в basic режим
вектор символов | строка
Отметьте, чтобы запросить чтение в basic режим в виде вектора символов или строки, 'basic'.
basic режим является значением по умолчанию для компьютеров без Excel для Windows. В basic режим, xlsread:
-
Чтения XLS, XLSX, XLSM, XLTX и файлы XLTM только.
-
Не поддерживает
xlRangeвведите при чтении файлов XLS. В этом случае используйте''вместоxlRange. -
Не делает входных параметров указателя функции поддержки.
-
Импорт все даты как Excel последовательные числа даты. Excel последовательные числа даты использует различную ссылочную дату, чем числа даты MATLAB.
Типы данных: char | string
processFcn — Обработайте к пользовательской функции
указатель на функцию
Обработайте к пользовательской функции. Этот аргумент поддерживается только на компьютерах Windows с программным обеспечением Excel. xlsread чтения из электронной таблицы, выполняет вашу функцию на копии данных и возвращает конечные результаты. xlsread не изменяет данные, хранимые в электронной таблице.
Когда xlsread вызывает пользовательскую функцию, она передает интерфейс диапазона из приложения Excel, чтобы обеспечить доступ к данным. Пользовательская функция должна включать этот интерфейс оба как аргумент ввода и вывода. (См., Выполняют Функцию на Рабочем листе),
Пример: @myFunction
Выходные аргументы
свернуть все
num — Числовые данные
матрица
Числовые данные, возвращенные как матрица double значения. Массив не содержит информации от линий заголовка, или из внешних строк или столбцов, которые содержат нечисловые данные. Текстовые данные во внутренних строках и столбцах электронной таблицы появляются как NaN в num вывод .
txt — Текстовые данные
cellArray
Текстовые данные, возвращенные как массив ячеек. Числовые значения во внутренних строках и столбцах электронной таблицы появляются как пустые символьные вектора, '', в txt.
Для файлов XLS в basic импортируйте режим, txt выведите содержит пустые символьные вектора, '', вместо ведущих столбцов числовых данных, которые предшествуют текстовым данным в электронной таблице. Во всех других случаях, txt не содержит эти дополнительные столбцы.
Неопределенные значения (такие как '#N/A') появитесь в txt выведите как '#N/A', за исключением файлов XLS в basic режим.
raw — Числовой и текстовые данные
cellArray
Числовой и текстовые данные из рабочего листа, возвращенного как массив ячеек.
На компьютерах с Excel для Windows, неопределенные значения (такие как '#N/A') появитесь в raw выведите как 'ActiveX VT_ERROR:'. Для XLSX, XLSM, XLTX и файлов XLTM на других компьютерах или в MATLAB Online, неопределенные значения появляются как '#N/A'.
custom — Второй выход функции, соответствующей processFcn
заданный функцией
Второй выход функции, соответствующей processFcn. Значение и тип данных custom определяются функцией.
Ограничения
-
xlsreadчтения только 7-битные символы ASCII. -
xlsreadне поддерживает области значений, состоящие из нескольких несмежных участков. -
Если ваш компьютер не имеет Excel для Windows или если вы используете MATLAB Online,
xlsreadавтоматически действует вbasicимпортируйте режим. -
На Linux® и платформы Mac,
xlsreadне может открыть файлы электронной таблицы, записанныеwritetableфункция.
Алгоритмы
-
xlsreadформатированный текст импорта, представляющий даты (такие как'10/31/96'), кроме тех случаев, когда импорт вbasicрежим.
Вопросы совместимости
развернуть все
xlsread не рекомендуется
Не рекомендуемый запуск в R2019a
xlsread не рекомендуется. Использование readtable, readmatrix, или readcell вместо этого. Нет никаких планов удалить xlsread.
Начиная в R2019a, импортируйте данные об электронной таблице как таблицу, матрицу или массив ячеек при помощи readtable, readmatrix, или readcell соответственно. readtable, readmatrix, и readcell функции имеют эти преимущества перед xlsread функция:
-
Лучше кросс-платформенная поддержка и эффективность
-
Автоматическое обнаружение формата данных и типов
-
Способность использовать настройки импорта, чтобы управлять данными импортирует процесс, включая обработку ошибок и недостающих данных
Эта таблица показывает типичные использования xlsread и как обновить ваш код, чтобы использовать readtable, readmatrix, или readcell вместо этого.
|
Не рекомендуемый |
Рекомендуемый |
|---|---|
|
Считайте данные об электронной таблице как матрицу с помощью M = xlsread(filename) |
Считайте данные об электронной таблице как таблицу: T = readtable(filename) Однако, чтобы продолжить считывать ваши данные как матрицу, используйте: M = readmatrix(filename) |
|
Считайте данные об электронной таблице как массив ячеек с помощью [~,~,C] = xlsread(filename) |
Импортируйте данные об электронной таблице как таблицу: T = readtable(filename) Однако, чтобы продолжить импортировать ваши данные как ячейку arrary, используйте: C = readcell(filename) |
|
Считайте определенный лист и область значений как матрица с помощью M = xlsread(filename,sheet,range) |
Считайте определенный лист и область значений как таблица: T = readtable(filename,'Sheet',sheet,'Range',range) Однако, чтобы продолжить считывать ваши данные как матрицу, используйте: M = readmatrix(filename,'Sheet',sheet,'Range',range) |
|
Считайте определенный лист и область значений как массив ячеек с помощью [~,~,C] = xlsread(filename,sheet,range) |
Считайте определенный лист и область значений как таблица: T = readtable(filename,'Sheet',sheet,'Range',range) Однако продолжать считывать ваши данные как массив ячеек: C = readcell(filename,'Sheet',sheet,'Range',range) |
Представлено до R2006a
MATLAB provides options to write a table, array, or matrix to Microsoft Excel spreadsheets. The function available to do so is the writetable () function. The general syntax for this function is:
Syntax:
writetable(<data>, <filename>, <optional_values>)
Now, in the following sections, we shall see how to write a table, an array, and a matrix into a spreadsheet.
Writing a Table to Excel Spreadsheet:
Firstly, we shall create a table and then write the same to an excel spreadsheet with the help of writetable function.
Example 1:
Matlab
tab = magic(5);
tab = array2table(tab,"VariableNames",
["R1" "R2" "R3" "R4" "R5"]);
disp(tab)
writetable(tab,'new.xls','FileType','spreadsheet')
The output of the above code will create a new excel sheet in the current folder.
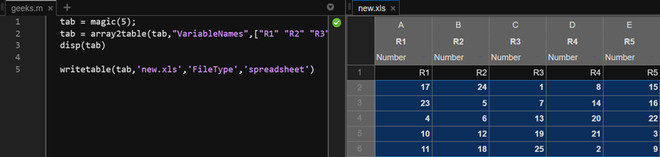
In the above code, we create a table from magic with the variable names or table headers passed as a vector. Then, in the writetable function, we pass the table, and the file name to be used (if present then, it’ll overwrite the data. If not, then it will create a new file and then, it’ll create a new file). The next argument is a field type that decides the file type and the argument following it is the value for the same field; spreadsheet in this case.
Writing a Matrix to Excel Spreadsheet
In the above section, we discussed how to add a table to an excel sheet. In this section, we shall explore the writetable further by adding a matrix at specified cells in a spreadsheet. Let us see the same with the help of an example.
To write numeric data into an excel sheet, we need can use the writetable function. We have to use another function, the writematrix function.
writematrix(<data>, <filename>, <optional_values>)
The syntax is the same as the writetable just the datatype changes to double, float, or int.
Example 2:
Matlab
tab = magic(5);
writematrix(tab,'new.xls','Sheet',2,'Range','C1')
Output:
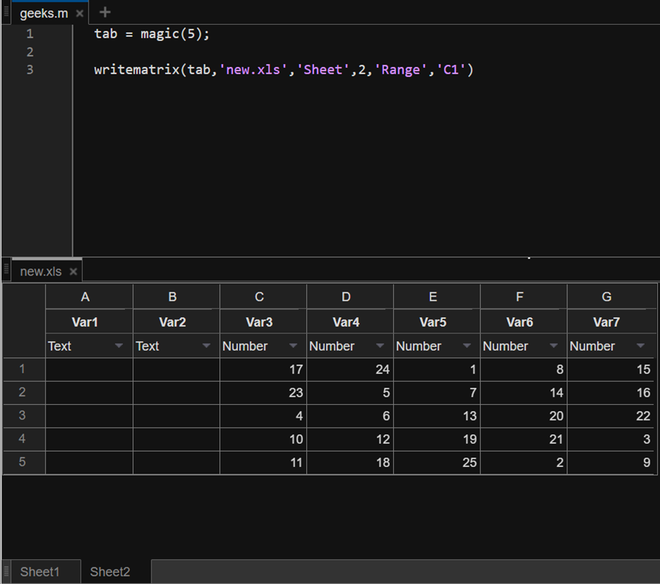
In this code, we write the magic square matrix to an excel spreadsheet named new.xls. The following arguments define the sheet number and the starting cell where we want to write our matrix-formed data.
Writing a cell array (array of multiple data types) to an excel spreadsheet
To write an array with both numeric and text data, we use the writecell() function. The syntax of the same is similar to writematrix and writetable however, the data type then changes to a cell array.
writecell(<data>, <filename>, <optional_values>)
In the following example, we will write a cell array to a new sheet in our new.xls spreadsheet.
Example 3:
Matlab
arr = {'cell', 'array'; 1, 2; 23, 31};
writecell(arr,'new.xls','Sheet',3,'Range','C1:E2')
Output:
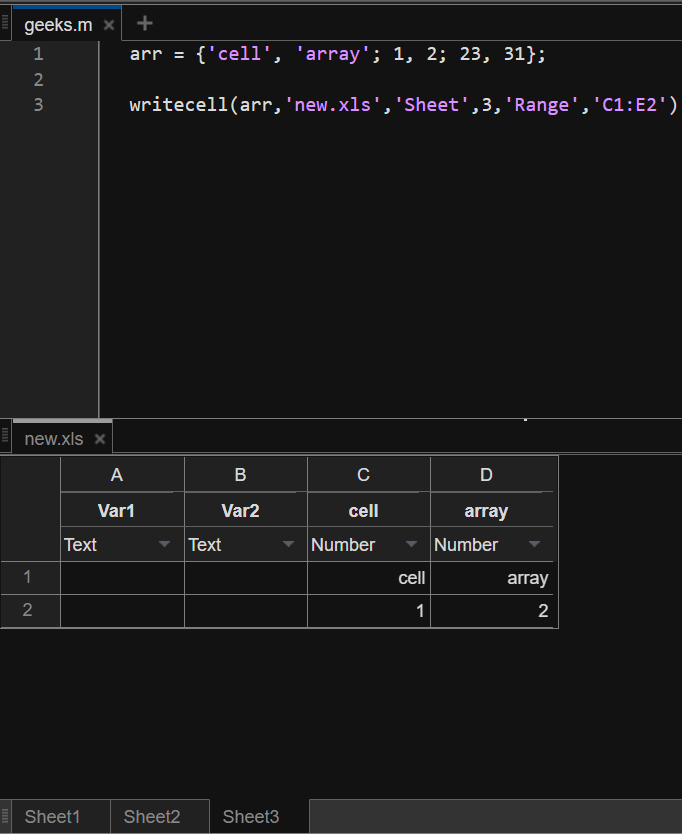
In this code, we are writing a 3×3 cell array to the spreadsheet in sheet 3 from a range of cells C1 to E2, this means that only as many elements as are specified in the range C1:E2.
![]()
Download Article
![]()
Download Article
Whether you are an experienced MATLAB user or a novice, you may not be fully aware of MATLAB’s graphing abilities. MATLAB allows you to easily customize, label, and analyze graphs, giving you more freedom than the traditional Excel graph. In order to utilize MATLAB’s graphing abilities to the fullest, though, you must first understand the process for importing data. This instruction set will teach you how to import and graph excel data in MATLAB.
-

1
Open a fresh MATLAB Screen. To make the process of importing and graphing data easier, clear any text in the command window with the command clc.
-
2
Open your desired Excel file. Be sure to record the name of the Excel file for later use.
Advertisement
-
3
Save the Excel file into your MATLAB folder. The pathway for the folder typically is: C:Users[your account name]DocumentsMATLAB. Be sure you save the file as an Excel Workbook in order to have the proper file format for the import. Once this step is complete, you should see your Excel file in the current folder section in MATLAB.
-
4
Locate the columns that will be exported. Identify the range of each column to be exported. The range of the column is the first cell in a column to the last cell in a column. The proper format for this range is the first cell followed by a colon followed by the last cell (I.e. “B1:B30”)
-
5
Import the data columns to MATLAB. Enter the command var = xlsread(‘filename’, ‘xlrange’); into the command window for each column you want to import. In this command:
- Var is a variable name of your choice (Example: “x” or “y”)
- Filename is the name of your excel spreadsheet
- Xlrange is the range of the desired column in the form “X—:X—“,with X being the letter of the column followed by the cell number.


Advertisement
-
1
Create a graph. Enter the command p = plot(indep, dep1, indep, dep2) in the command window. In this command, indep is the independent variable and dep1 and dep2 are the dependent variables. If you wish to graph more than two dependent variables, follow the same format and add a dep3 variable. If you wish to graph only one dependent variable, only graph the first pair of x and y values (Example: plot(x, y1)).

-
1
Change the line color. Enter the command set(p,’color’,’[Desired Color]’); into the command window to change all the graphed lines to the same color. In this command, p is a reference to the variable you set your plot equal to in step 6. If you wish to change the color of only one line enter set(p(x),’color’,’[Desired Color]’); into the command line. The x in p(x) is the number that corresponds to the order that the lines are plotted in (Example: y1 = p(1), y2 = p(2)).
-
2
Change the line style. Enter the command set(p,’LineStyle’,’style’); into the command window to change all of the graphed lines to the same style. If you wish to change the style of one line only, enter the command set(p(x),’LineStyle’,’style’); into the command line. In this command, the x in p(x) corresponds to the number in which the lines were graphed (Example: y1 = p(1), y2 = p(2)). Common line styles include:
- dashed lines= ‘—‘
- dotted lines = ‘:’
- solid line = ‘-‘
- dash-dot line = ‘-.’
-
3
Label your axis. To label the x-axis, enter the command xlabel(‘text’) in the command window. To label the y-axis, enter the command ylabel(‘text’) in the command window.
-
4
Add a title to your graph. Enter the command title(‘text’) in the command window. The title will display at the top of your graph.
-
5
Add text within the graph. If you wish to enter text near your graphed lines, enter the command gtext(‘text’). Once you enter the command, a cursor will appear on the graph allowing you to click the area you wish to apply the label. The label can be put anywhere in the graph space.
-
6
Add grid lines to the graph. If you wish to put grid lines in your plot for easier reading, enter the command grid into the command window. Entering the command again will remove the grid lines.
-
7
Save your graph. Click file on upper right hand side of the MATLAB graph screen followed by save as in the menu. Save the graph to the desired location.


Advertisement

Ask a Question
200 characters left
Include your email address to get a message when this question is answered.
Submit
Advertisement
Thanks for submitting a tip for review!
About This Article
Thanks to all authors for creating a page that has been read 65,042 times.