Код курса: Т-ЭКСЕЛЬ-Н
Бизнес-аналитика
Пользователь ПК
Microsoft Excel
Офис-менеджмент
Эту Программу повышения квалификации
в нашем Центре успешно закончили
4260 человек!
09.01.03 Мастер по обработке цифровой информации
Центр «Специалист» представляет комплексную программу обучения «Магистр Microsoft Excel».
Microsoft Excel — многофункциональная программа, владение которой является важнейшим требованием в современном офисе. Мощные средства для вычислений, анализа и представления информации делают Excel незаменимым инструментом.
После обучения Вы сможете уверенно использовать Microsoft Excel в работе с документами и расчетами: проводить сложные вычисления, анализировать данные, визуализировать их в таблицах и диаграммах. Эти навыки помогут оперативно обрабатывать большие объемы данных и использовать все встроенные функции Excel и макросы.
Вы освоите современные инструменты для анализа данных: PowerPivot, PowerQuery и PowerMap. Вы сможете загружать данные из внешних источников, создавать связи между таблицами, выполнять расчеты и строить DAX-формулы. Вы изучите инструменты оптимизации, программирование на VBA, средства и способы прогнозирования, проверку вариантов развития событий (сценариев).
Обучение по комплексной программе «Магистр Microsoft Excel» позволит сэкономить время на проведении однотипных вычислений. Вы научитесь управлять файлами из Excel, передавать данные в другие программы и обрабатывать данные в рабочих книгах в один клик.
Комплексная программа обучения — уникальное предложение Центра «Специалист» именно для Вас! Оплата комплексной программы обучения даст Вам заметную экономию по сравнению с оплатой входящих в нее курсов по отдельности. Получайте знания и экономьте деньги!
Обучение по программе «Магистр Excel» даст Вам уникальные преимущества:
- По окончании курса «Microsoft Excel. Уровень 2» вы получите международный сертификат Microsoft, признанный работодателями во всем мире.
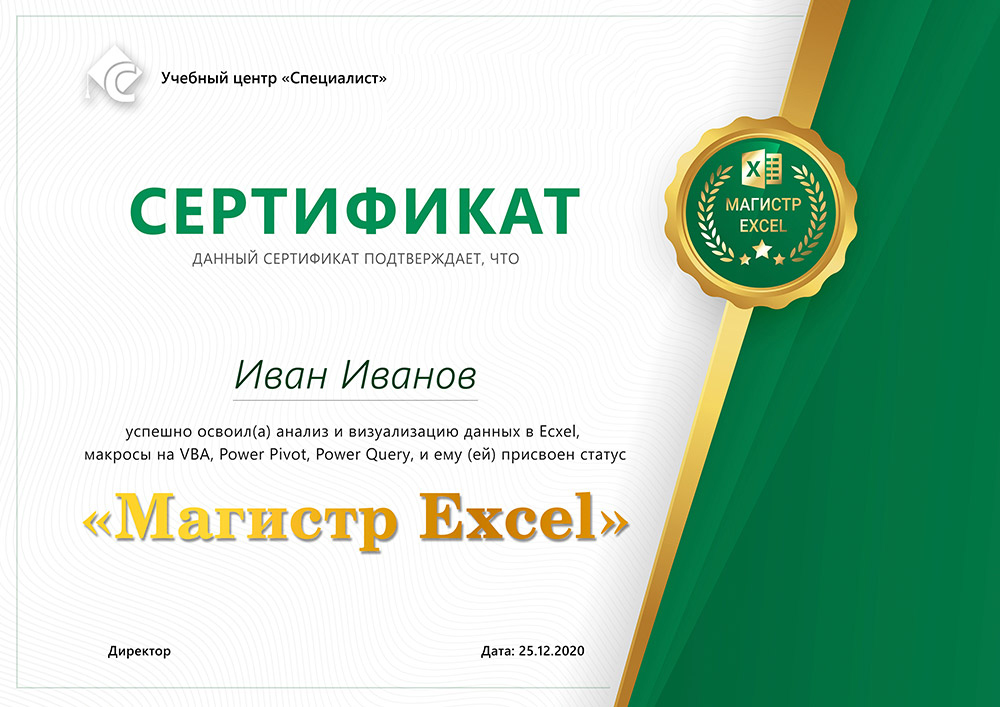
- Вы получите сертификат «Магистр Excel» Центра «Специалист» – золотого партнера компании Microsoft.
- Количество часов в программе позволяет получить удостоверение о повышении Вашей квалификации.
- В рамках данной комплексной программы Вы сможете подготовиться к международной сертификации MOS: Microsoft Office Excel 2019/2016 Expert.
А главное – Вы станете настоящим гроссмейстером таблиц, формул и диаграмм!
-
Обучение в рассрочку для дипломных программ — это выгодно и удобно!
Не ломайте голову, где взять всю сумму на обучение по дипломной программе,
у нас Вы можете оплачивать его частями. Мы предлагаем Вам рассрочку на оплату обучения! -
Оплата обучения в кредит: учеба сразу, а деньги потом!
Потребительский кредит от Тинькофф-банка (не менее 5 рабочих дней до старта группы, сумма кредита 3-200 тыс. рублей, без первоначального взноса). От От 4 669 руб./месяц. Начните обучение сейчас!
| с 10:00 до 17:00 | Вечер или Выходные Стандартная цена |
Очно-заочно | Онлайн | Записаться | |||
|---|---|---|---|---|---|---|---|
| Частные лица | 87 490 | 87 490 | 71 990 | 87 490 | |||
| Организации | 94 290 | 94 290 | 77 590 | 94 290 | |||
| Первый взнос(для частных лиц) | 17 450 | 17 450 | 14 350 | 17 450 |
Документы об окончании
В зависимости от программы обучения выдаются следующие документы:
Удостоверение о повышении квалификации
Свидетельство выпускника
Cертификат международного образца
Международный сертификат Microsoft
По окончании каждого отдельного курса, входящего в Программу повышения квалификации, в вашем личном кабинете формируются электронные сертификаты об обучении по каждому отдельному курсу. По окончании обучения по Программе повышения квалификации вы получаете Удостоверение о повышении квалификации по этой программе. Если вы проходили курсы, входящие в Программу повышения квалификации, по отдельности, то вы получите Удостоверения за каждый пройденный курс.
Обязательно уточняйте перед заключением договора, какой документ Вам будет выдан после окончания обучения!
Все документы Центра
Содержание
- Работа Мастера функций
- Переход в Мастер функций
- Категории элементов в Мастере
- Выбор функции
- Аргументы функции
- Выполнение функции
- Вопросы и ответы
Функции в программе Excel позволяют выполнять различные, довольно сложные действия вычислительного характера буквально в несколько кликов. Ещё больше упрощает работу с ними такой удобный инструмент, как «Мастер функций». Давайте рассмотрим, как он устроен и что с его помощью можно делать.
Работа Мастера функций
Мастер функций представляет собой инструмент в виде небольшого окошка, в котором все имеющиеся функции в Excel упорядочены по категориям, что делает доступ к ним проще. Также, он предоставляет возможность ввести аргументы формулы через интуитивно понятный графический интерфейс.
Переход в Мастер функций
Мастер функций можно запустить сразу несколькими способами. Но прежде, чем активировать этот инструмент, нужно выделить ту ячейку, в которой будет находиться формула и, следовательно, выводиться результат.
Проще всего перейти в него, нажав на кнопку «Вставить функцию», расположенную слева от строки формул. Этот способ хорош тем, что им воспользоваться можно, находясь в любой вкладке программы.
Кроме того, нужный нам инструмент можно запустить, перейдя во вкладку «Формулы». Затем следует нажать на самую крайнюю слева кнопку на ленте «Вставить функцию». Она располагается в блоке инструментов «Библиотека функций». Это способ хуже предыдущего тем, что если вы не находитесь во вкладке «Формулы», то придется выполнять дополнительные действия.
Можно также кликнуть на любую другую кнопку блока инструментов «Библиотека функций». При этом, в выпадающем меню появится список, в самом низу которого есть пункт «Вставить функцию…». Вот по нему и нужно кликнуть. Но, данный способ является ещё запутаннее предыдущего.
Очень простым способом перехода в режим Мастера является нажатие комбинации горячих клавиш Shift+F3. Этот вариант предусматривает быстрый переход без дополнительных «телодвижений». Главный недостаток его состоит в том, что далеко не каждый пользователь способен удержать у себя в голове все комбинации горячих клавиш. Так что для новичков в освоении Excel этот вариант не подходит.
Категории элементов в Мастере
Какой бы способ активации из вышеуказанных вы не выбрали, в любом случае, после данных действий запускается окно Мастера. В верхней части окна расположено поле поиска. Сюда можно ввести наименование функции и нажать кнопку «Найти», чтобы быстрее отыскать нужный элемент и получить доступ к нему.
Средняя часть окна представляет выпадающий список категорий функций, которые представляет Мастер. Чтобы просмотреть данный перечень, жмем на пиктограмму в виде перевернутого треугольника справа от него. Таким образом открывается полный список доступных категорий. Прокручивать вниз его можно с помощью боковой полосы прокрутки.
Все функции разделены на следующие 12 категорий:
- Текстовые;
- Финансовые;
- Дата и время;
- Ссылки и массивы;
- Статистические;
- Аналитические;
- Работа с базой данных;
- Проверка свойств и значений;
- Логические;
- Инженерные;
- Математические;
- Определенные пользователем;
- Совместимость.
В категории «Определенные пользователем» находятся функции, составленные самим юзером или загруженные из внешних источников. В категории «Совместимость» расположены элементы из старых версий Excel, для которых уже существуют более новые аналоги. Они были собраны в эту группу для поддержки совместимости работы с документами, созданными в старых версиях приложения.
Кроме того, в этом же списке находятся две дополнительные категории: «Полный алфавитный перечень» и «10 недавно использовавшихся». В группе «Полный алфавитный перечень» располагается полный список всех функций в независимости от категории. В группе «10 недавно использовавшихся» находится список десяти последних элементов, к которым пользователь прибегал. Этот перечень постоянно обновляется: использовавшиеся раньше элементы убираются, а новые добавляются.
Выбор функции
Для того, чтобы перейти к окну аргументов, прежде всего необходимо выбрать нужную категорию. В поле «Выберите функцию» следует отметить то наименование, которое требуется для выполнения конкретной задачи. В самой нижней части окна находится подсказка в виде комментария к выделенному элементу. После того, как конкретная функция выбрана, требуется нажать на кнопку «OK».
Аргументы функции
После этого, открывается окно аргументов функции. Главным элементом этого окна являются поля аргументов. У различных функций аргументы отличаются, но принцип работы с ними остается одинаковыми. Их может быть несколько, а может быть и один. В качестве аргументов могут выступать числа, ссылки на ячейки или даже ссылки на целые массивы.
- Если мы работаем с числом, то просто вводим его с клавиатуры в поле, таким же образом, как вбиваем цифры в ячейки листа.
Если же в качестве аргумента выступают ссылки, то их также можно прописать вручную, но намного удобнее поступить иначе.
Установите курсор в поле аргумента. Не закрывая окно Мастера, выделите курсором на листе ячейку или целый диапазон ячеек, которые вам нужно обработать. После этого в поле окна Мастера автоматически заносятся координаты ячейки или диапазона. Если у функции несколько аргументов, то аналогичным образом можно занести данные и в следующее поле.
- После того, как все нужные данные введены, жмем на кнопку «OK», тем самым запуская процесс выполнения задачи.
Выполнение функции
После того, как вы нажали на кнопку «OK» Мастер закрывается и происходит выполнение самой функции. Результат выполнения может быть самый разнообразный. Он зависит от тех задач, которые ставятся перед формулой. Например, функция СУММ, которая была выбрана в качестве примера, производит суммирование всех введенных аргументов и показывает результат в отдельной ячейке. Для других вариантов из списка Мастера результат будет абсолютно иным.
Урок: Полезные функции Excel
Как видим, Мастер функций является очень удобным инструментом, который значительно упрощает работу с формулами в Excel. С его помощью можно производить поиск нужных элементов из списка, а также вводить аргументы через графический интерфейс. Для начинающих пользователей Мастер особенно незаменим.
We select and review courses independently. This post may contain affiliate links. If you buy through these links, we may earn a commission, which helps to support our website.
Microsoft Excel is the most widely used software within business community. Whether it is bankers or accountants or business analysts or marketing professionals or scientists or entrepreneurs, almost all professionals use Excel on a consistent basis. So given how Excel is so widespread in workforce, it helps to be proficient at it. Having Excel skill set on your resume can greatly increase your employability. The best part is that you can develop your Excel skills using online resources at the convenience of your own home, without having to spend any money on college courses. Upon completing the right Excel training course, and mastering the excel basics, you can improve your employment and career prospects and prove to be a valuable asset to your organization. Microsoft Excel can also be a very useful tool to analyse data in your day-to-day life such as managing personal finances. Thus Excel skills are quiet critical for personal development.
Our global experts have compiled a list of 10 Best Excel Trainings, Courses, Classes and Tutorials Online for 2023. These resources are great to brush up your Excel skills or even earn Excel certification to bolster your resume. These provide for all beginner, intermediate and advanced level learners.
1. Microsoft Excel – Excel from Beginner to Advanced (Udemy)

This course is very in-depth and combines 4 different Excel courses:
- Microsoft Excel 101 (Introduction) – covers the fundamentals of Excel, like, excel interface, creating spreadsheets, entering/editing data, working with formulas, formatting data, excel print options, common excel shortcuts, and visualize data with charts
- Microsoft Excel 102 (Intermediate level) – covers topics like working with excel lists/tables, sorting and filtering data, working with list functions, data validation, importing and exporting data, pivot tables, and managing large sets of data
- Microsoft Excel 103 (Advanced level) – covers topics like, creating advanced excel formulas, lookup functions, text based functions, auditing excel formulas, protecting excel sheets, what if analysis and introduction to macros
- Master Microsoft Excel Macros and VBA in 6 Simple Projects – covers macros and VBA in detail so you learn how to automate excel tasks and how to create VBA procedures etc.
This course was created with Excel 2013. But all features work in Excel 2010, 2013 and 2016. You get lifetime access to 16 hours of video content, 4 articles and 37 downloadable resources.
Key Highlights
- Learn to create effective spreadsheets
- Master Excel’s most popular functions like, SUM, VLOOKUP, IF, AVERAGE, INDEX/MATCH and more
- Learn Microsoft Excel’s AddIn, PowerPivot tools
- Learn to create dynamic reports with Excel PivotTables
- Learn to automate day to day Excel tasks using Macros and VBA
Duration : 16 hours on-demand video
Rating : 4.6
Sign up Here
2. Excel Skills for Business Specialization by Macquarie University (Coursera)

You will also acquire the skills to manage large datasets efficiently, present data effectively and extract meaningful information from datasets. In addition, you will be able to validate data and prevent errors in spreadsheets, create automation, apply advanced formulas and conditional logic to make informed business decisions.
Key Highlights
- Best Microsoft Excel Certification online course for self-learners and business users
- Learn to navigate the Excel user interface, entering, manipulating and formatting data
- Learn to create spreadsheets that help forecast and model data
- Learn efficient techniques and tools that allow automation of everyday tasks in Excel
- Understand how to clean and prepare data for analysis
- Learn to create charts and tables to effectively summarize raw data in a user-friendly way
- Learn how to work with dates and financial functions
- Build professional dashboards in Excel
- Learn to create navigation aids for large workbooks
- Includes a broad range of practice quizzes and challenges that provide great opportunities to build up your skill set
- Great teaching team to help you every step of the way
Duration : Approx. 3 months, 11 hours per week
Rating : 4.9
Sign up Here
3. Excel 2016 Essential Training (LinkedIn Learning – Lynda)

Key Highlights
- Understand Excel’s Menu system and perform simple to complex calculations easily
- Get time saving tips and tricks to improve efficiency like entering data with AutoFill
- Work with dates and times
- Learn how to use printing and charting capabilities of Excel
- Learn to work with multiple worksheets and workbooks
- Understand security and sharing of workbooks
- Learn data management features of Excel like sorting, using filters, validation tools etc.
- Understand how to create PivotTables and use PivotCharts
Duration : 8 hours 53 minutes
Rating : 4.6
Sign up Here
4. Microsoft Excel – From Beginner to Expert in 6 Hours (Udemy)

You will learn how to navigate around Excel, enter and edit data, write formulas, perform calculations using Excel functions, work with charts and graphs, use Excel data tools, use Pivot Tables and Pivot Charts, how to automate tasks with time saving macros and much more.
This Microsoft Excel training uses Excel 2013 for Windows and comes with lifetime access that allows you to review material and continue learning new material. Every video lecture is followed by a quiz that helps you to review and reinforce your learning from the video. You will also get a certificate of Completion at the end of the class.
Key Highlights
- Perfect for all skill levels from beginner to advanced
- Presented with high-quality video lectures, that visually demonstrate how to easily do everything in Excel
- Excel Project Files and Excel Templates are included allowing for enhanced learning through hands-on activities
- Learn how to find and download free Excel templates that you can use like budget templates or a calendar template or a schedule template
- Learn tips and tricks about Excel, as well as Excel secrets and shortcuts
- Learn how to use passwords in Excel to protect your work in multiple scenarios
- Learn how to integrate Microsoft Excel with Microsoft Word
Duration : 6.5 hours on-demand video
Rating : 4.4
Sign up Here
5. Microsoft Excel – Advanced Excel Formulas & Functions (Udemy)

The course begins with a quick review of the fundamentals, then dive into each formula category from basic stats functions, conditional statements to more advanced array formulas, named ranges, and data tools like WebService and FilterXML. You will also learn to work with texts, dates, times and arrays and build custom interactive dashboards.
With this bestselling course you get 7 hours of video content, downloadable project files, quizzes and homework assignments and one-on-one instructor support.
Key Highlights
- Learn to write powerful and dynamic formulas from scratch
- Master unique tips, tools and case studies that you won’t find in any other course
- Learn to build dynamic tools & Excel dashboards to filter, display and analyze your data
- Learn to pull real-time data from APIs directly into Excel (weather, stock quotes, directions, etc.)
- Understand how to join datasets from multiple sources with Excel’s LOOKUP, INDEX & MATCH functions
- Learn to automate tedious and time-consuming tasks using cell formulas and functions in Excel
Duration : 7 hours on-demand video
Rating : 4.6
Sign up Here
6. Introduction to Data Analysis Using Excel by Rice University (Coursera)

The instructor Sharad Borle has structured the course very well and uses easy to understand examples that make learners understand everything quickly and be able to apply them in real life scenarios. There are plenty of quizzes and assignments in the course which will require access to Windows Microsoft Excel 2010 or later to complete.
The details of course modules are as follows:
1. Module 1: Introduction to Spreadsheets – Introduction to Excel spreadsheets and basic data functions and formulas
2. Module 2: Spreadsheet Functions to Organize Data – Introduction to Excel functions to organise and query data, like, IF, nested IF, VLOOKUP, HLOOKUP and RANDBETWEEN
3. Module 3: Introduction to Filtering, Pivot Tables, and Charts – Introduction to data filtering capabilities of Excel and Pivot Tables
4. Module 4: Advanced Graphing and Charting – Introduction to advanced graphing and charting techniques available in Excel
Key Highlights
- Learn to use formulas in Excel using absolute and relative referencing
- Learn to use Pivot Tables with categorical as well as numerical data
- Understand various line, bar and pie charts and get to build them on your own
- Understand Pivot Charts, Scatter Plots and Histograms
- Prepares learners for more advance topics in Business Statistics
Duration : 4 weeks, 1-2 hours per week
Rating : 4.7
Sign up Here
7. Microsoft Excel – Data Analysis with Excel Pivot Tables (Udemy)

This Excel course has been developed by Chris Dutton who is a Microsoft Certified, best-selling Excel instructor and teaches the course in a fun, interactive and effective style. It is compatible with Excel 2007, Excel 2010, Excel 2013, Excel 2016, Excel 2019, or Office 365. It includes Excel project files, 6 downloadable resources, 22 articles, homework assignments and quizzes and lifetime access to course material.
Key Highlights
- Gain 100% comprehensive understanding of Excel Pivot Tables and Excel Pivot Charts to streamline your workflow in Excel
- Master unique Pivot Table tips, tools and case studies
- Learn about Excel Calculated fields, items & values
- Learn to build Interactive Excel dashboards
- Test your skills with 10 real-world Pivot Table case studies (weather, shark attacks, wine tastings, burrito ratings, major league baseball, stock market, and more)
- Interactive, hands-on demos and Excel exercises throughout the course
- Requires learners to have basic functional experience with Excel
Duration : 6.5 hours on-demand video
Rating : 4.6
Sign up Here
8. Data Visualization with Advanced Excel by PwC (Coursera)

The Course modules are:
1. Preparing a Professional excel – Covers data models and databases, PowerPivot tool
2. Advanced Scenario Analysis – Explores different analytical methods and how to use them
3. Data Visualization – Covers elements of data visualization like charts and graphs in details
4. Dashboarding – Details design principles and requirements for building a dashboard
The course is taught by Alex Mannella and contains several graded quizzes and assignments with peer feedback. You will earn an electronic Certificate at the end of the course.
Key Highlights
- Master Advanced Excel functions
- Learn 3 different analytical methods – Scenario Analysis, Sensitivity Analysis and Simulation
- Learn how to create detailed graphs and charts to effectively tell a story about your data
- Perform different types of scenario and simulation analysis using Excel’s set of built in tools
- Create your own functional dashboard in Excel
Duration : 4 weeks, 3-4 hours per week
Rating : 4.8
Sign up Here
9. Excel Essentials: The Complete Excel Series – Level 1, 2 & 3 (Udemy)

You will cover the following in three levels:
1. Level 1 – Learn Excel basics, entering & editing data, formulas, functions
2. Level 2 – Learn to use Excel like professionals using advanced functions, conditional formatting, custom formatting, calculations with time and dates, macros, creating databases, Gantt charts etc
3. Level 3 – Learn to program in VBA and automate routine tasks like report generation, even automate Outlook, Word & PowerPoint
The course has been designed and is instructed by Alan Jarvis who has been teaching Microsoft Excel for over 20 years. He has created this all-in-one Excel master course for anybody who is a complete beginner, or someone who wants to take their Excel skills a notch higher, or someone who wants to create efficient business solutions using Excel. Upon enrolling for the course, you get access to all the video lectures, articles, quizzes, projects, and 116 downloadable resources for lifetime.
Key Highlights
- Learn to create a fully functioning relational database using Excel
- Build Gantt charts in Excel for project planning
- Understand how to import data from multiple sources
- Create a simple data entry screen to auto-populate complex templates
- Build Powerful Advanced Excel Projects & Complex applications from scratch
- Learn how to fully automate report generation
- Learn to program simple “helper” solutions
- Learn through multiple in-depth step-by-step projects
- Control other Microsoft applications like Outlook, Word, PowerPoint and even Windows itself
Duration : 26.5 hours on-demand video
Rating : 4.6
Sign up Here
10. Master Microsoft Excel Macros and Excel VBA (Udemy)

The course contains detailed instructions in the form of video lectures and PDF documents that you can reference for lifetime. It is designed for those who use Excel for business and want to automate their daily tasks or build small applications using Excel. The Course Material Works in Microsoft Excel 2007, 2010, 2013 and 2016.
Key Highlights
- Master the process of automating routine tasks through the use of Excel Macros and Excel VBA
- Determine when it’s best to use the Macro Recorder versus VBA
- Learn to apply VBA concepts to real world scenarios
- Learn how to write custom VBA Macros to create more robust automation
- Learn to import data from external text files
- Learn to work with Excel VBA user forms
- Complete real world Macro/VBA projects from beginning to end
Duration : 5 hours on-demand video
Rating : 4.5
Sign up Here
Microsoft Office Specialist—Pass an exam in a specific Office program to earn a Microsoft Office Specialist certification. Being certified as a Microsoft Office Specialist demonstrates you have the skills needed to get the most out of Office. Find training and earn a MOS certification in:
-
Microsoft Word 2013 (Exam 418)
-
Microsoft Excel 2013 (Exam 420)
-
Microsoft PowerPoint 2013 (Exam 422)
-
Microsoft Outlook 2013 (Exam 423)
-
Microsoft Access 2013 (Exam 424)
-
Microsoft SharePoint 2013 (Exam 419)
-
Microsoft OneNote 2013 (Exam 421)
-
Other versions of Microsoft Office
MOS Expert—Pass exams in Word or Excel to earn a Microsoft Office Specialist Expert certification. Being certified as an MOS Expert demonstrates you have advanced skills in key Office programs.
-
Find training and earn an MOS Expert certification
MOS Master—Pass exams in Word or Excel to earn a Microsoft Office Specialist Master certification. Being certified as an MOS Master demonstrates you have the deepest level of skills needed to proficiently use key Office programs.
-
Find training and earn an MOS Master certification
Learn more about MOS certification
Need more help?
Microsoft Excel is one of the world’s most popular business software packages. It is incredibly powerful, with more features added to it continuously.
You may, therefore, have a desire to learn how to master Excel so that you can work quicker, easier and with more efficiency.
This article will guide you through 11 of the best tips and tricks to help you harness the power of Excel and impress your boss and work colleagues.
How to master Excel quickly in 11 steps
1. How to navigate the interface
A good start is to be efficient at navigating the Excel interface. Let’s start with the basics.
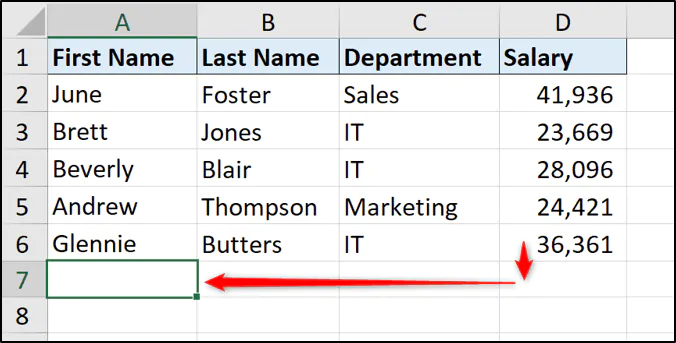
When typing data into Excel you can use the Tab key to move to the next cell in the column to the right.
The Enter key can be used to move to the cell in the next row down. If you have been using tab to move through the columns, pressing Enter will take you one row down and back to the cell in the column you started in.
Pressing the Ctrl key and the Up, Down, Left or Right directional arrow keys together will take you to the last used cell in that direction.
This is very useful to navigate large lists.
Pressing the Ctrl and the Home key together will take you to the first cell in your data range.
2. Learn some useful shortcuts
The best way to speed up your day-to-day Excel work is to learn some useful shortcuts both with the keyboard and your mouse or touchpad.
If you are a beginner, then start by learning the general keyboard shortcuts. Good ones to learn include Ctrl + C and Ctrl + V to copy and paste. And Ctrl + Z to undo the last action.
As you begin to use these shortcuts in your daily work, push yourself to learn more.
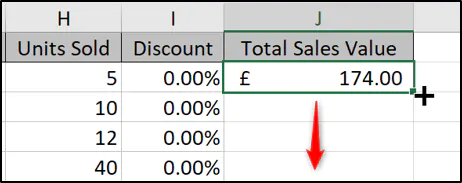
Two of my favorite shortcuts are Ctrl + ; to enter today’s date in a cell. And double-clicking the fill handle (the square in the bottom right corner of the cell) to copy to the bottom of a list.
Excel has over 500 keyboard shortcuts and a whole bunch of useful tricks for speeding up how you work.
Although you won’t need them all, learning some to make your Excel work easier is a great idea.
Ready to start using Excel shortcuts?
Download our printable shortcut cheatsheet for Excel.
3. Freeze panes
This wonderful feature keeps your headings and other labels visible at all times as you scroll around the spreadsheet. It is an essential Excel skill to know.
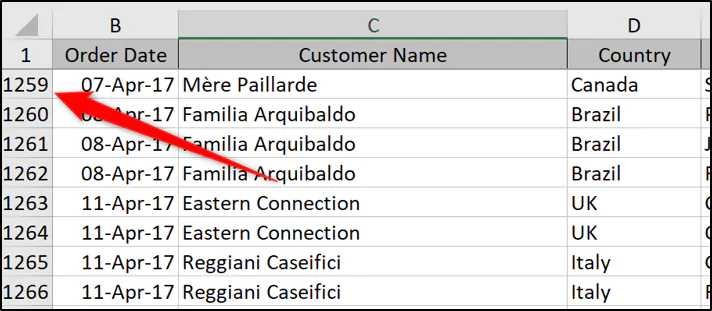
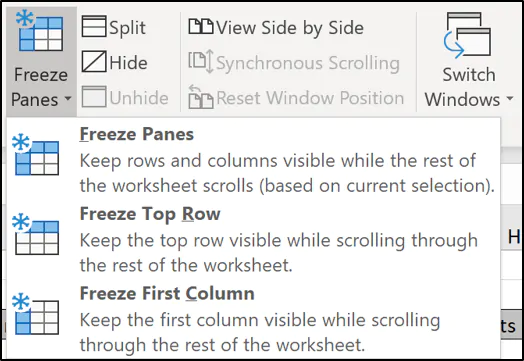
The headings for a spreadsheet are usually just in the top row. So to freeze this area, click View > Freeze Panes > Freeze Top Row.
In the image below, we are looking at row 1259 but the headings are still visible on screen.
You can freeze as many rows, and columns, as you need.
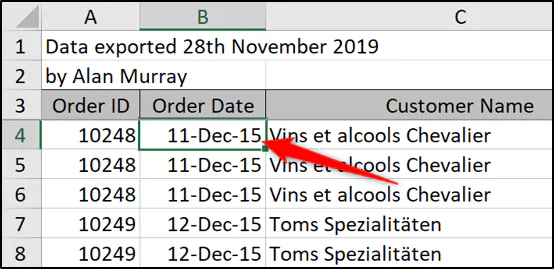
Click in the first cell after the rows and columns you want to freeze. For example, if you want to freeze 3 rows and 1 column, click on cell B4.
Click View > Freeze Panes > the first Freeze Panes option.
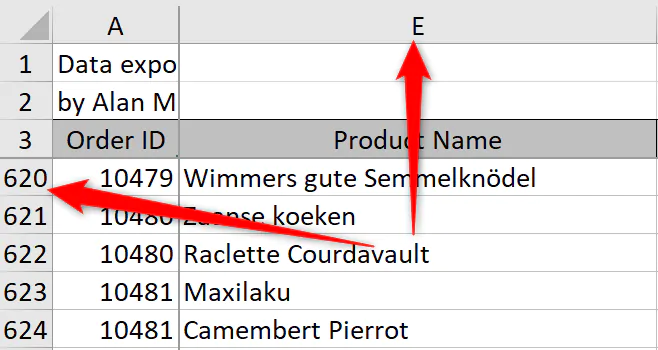
Now when you scroll down, the first 3 rows remain visible. And if you scroll to the right, column A remains visible.
4. Learn how to master Excel formulas
One of the main ways to master Excel is to be accomplished at writing formulas. These are the muscles of Excel.
From performing basic calculations in cells to using more advanced formulas — you will stand head and shoulders above the rest if you have this skill.
If you are new to formulas, start with creating basic calculations that add, subtract, multiply and divide values.
Then begin to learn some of the more commonly used functions. These include SUM, IF, VLOOKUP, COUNTIF, and CONCATENATE.
When you are comfortable writing formulas, you can do almost anything. You can even use formulas within Conditional Formatting rules, charts and other Excel features to make them more powerful.
Check out some of our favorite Excel formulas and functions.
5. Create a simple drop-down list
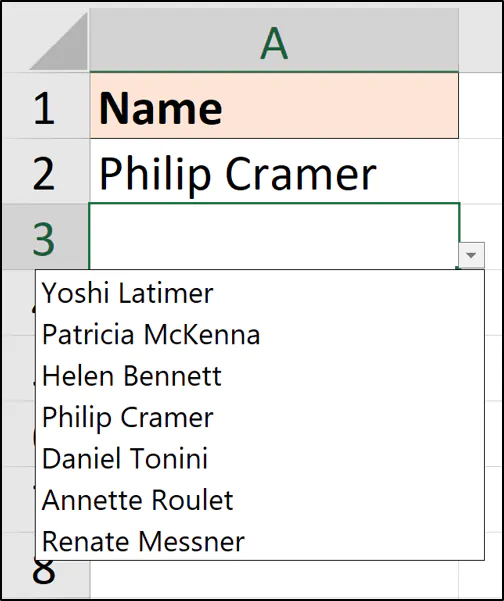
A simple drop-down list on a spreadsheet can make entering text much easier, and more importantly ensure it is accurate.
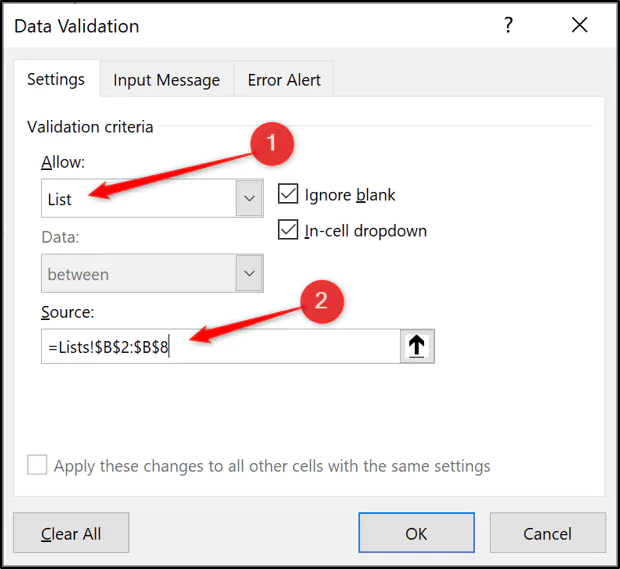
To create a drop-down list;
1. Select the range of cells you want the list to appear in.
2. Click Data > Data Validation.
3. Select List from the Allow list.
4. Then either type the list items into the source box separating each one with a comma. Or select a range of cells that contain the list items.
Now you have a drop-down list, making data entry simple and reliable.
6. Visualize key data with conditional formatting
Conditional Formatting is one of the most popular features of Excel. It helps the user get a quick understanding of the data they are looking at.
You can create simple conditions to automatically format cells if a target is reached, a deadline has passed or maybe sales have decreased below a certain threshold.
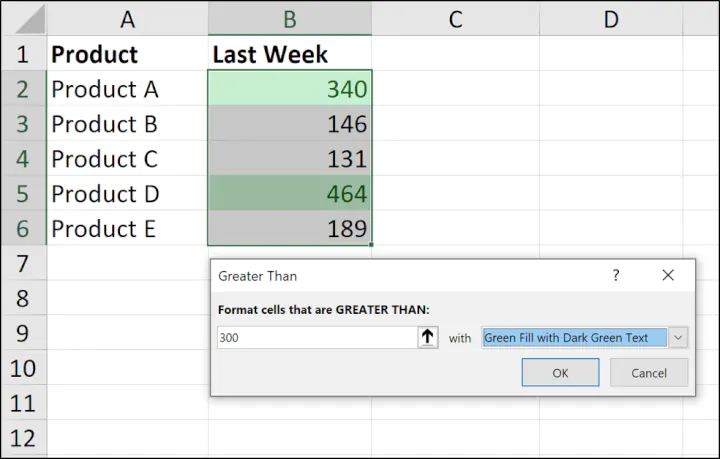
For a quick example, if a value is larger than 300 we want to change the cell color to green.
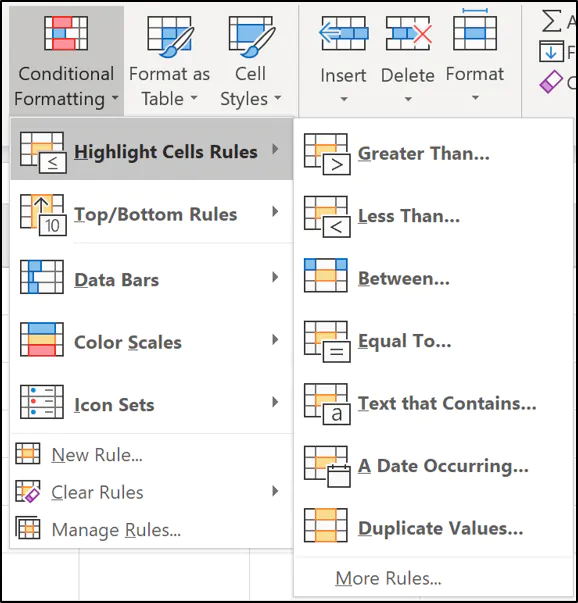
1. Select the range of cells that you want to apply Conditional Formatting to.
2. Click Home > Conditional Formatting > Highlight Cells Rules > Greater Than.
3. Enter 300 and select the formatting you want to apply.
A green fill and font color are used here, but there are lots of formatting options available.
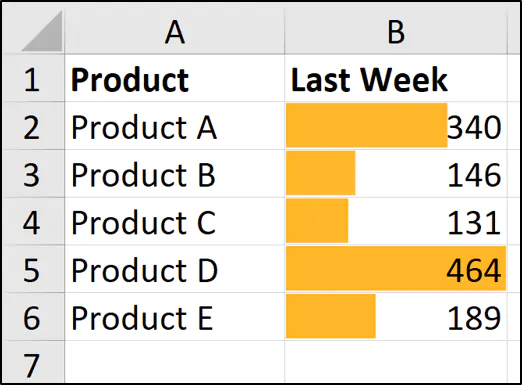
With conditional formatting, there is also the ability to apply data bars and icon sets. These visuals can be very effective. The image below shows data bars applied to the same range of values.
7. Flash fill
Flash Fill is an awesome feature that quickly manipulates data. This feature can greatly reduce the time taken doing regular data cleansing tasks, that previously we relied on formulas and macros to do.
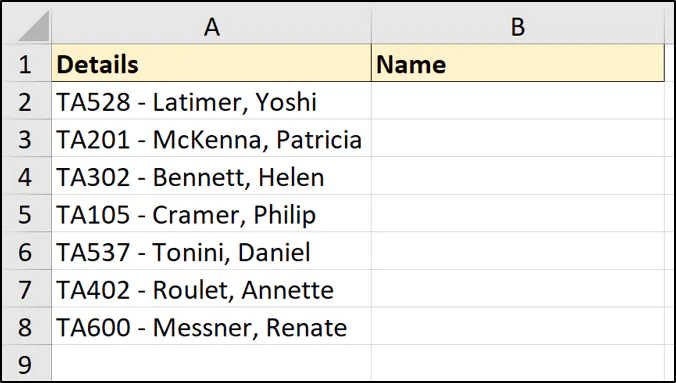
Take, for example, the list below. We want to extract the name from the list in column A.
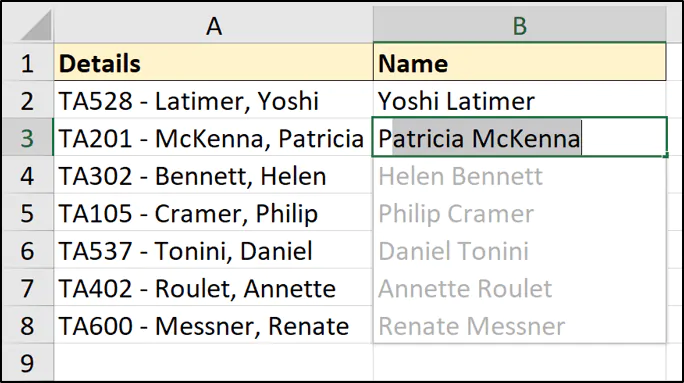
Enter the first name in cell B2 and then the second name in cell B3 and as you type Flash Fill picks up the pattern in your behavior asks if you would like it repeated over the rest of the rows. This is amazing!
Press Enter and voilà the data is extracted.
There are several ways of running Flash Fill. You can also find the button on the Data tab of the Ribbon, and you can operate it with the shortcut Ctrl + E.
8. Summarize data with PivotTables
PivotTables are one of the most amazing tools in Excel. They make summarising large datasets as easy as 1, 2, 3.
A PivotTable could be used to break down a large list of sales to see the sales by region or even sales of particular products in each region.
They are extremely powerful, but also simple to use. A PivotTable is a tool to make creating reports more straightforward and doesn’t require writing any complex formulae.
To create a PivotTable;
1. Click in the list of data you want to summarize.
2. Click Insert > PivotTable.
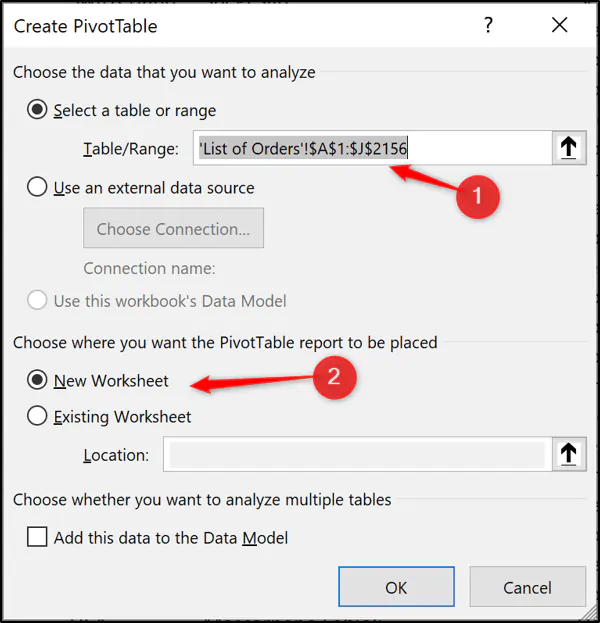
3. In the Create PivotTable dialog, ensure the range being used is correct and specify whether you want the PivotTable or a new or existing worksheet.
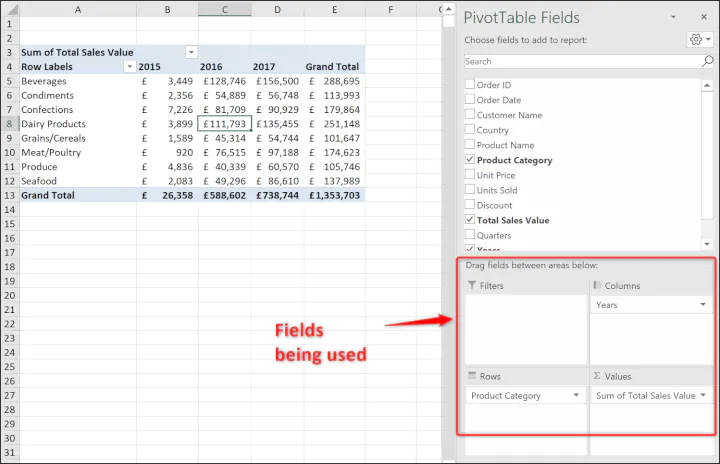
4. Drag and Drop fields from the field list into the four areas to create your PivotTable.
In the image below, the years is in Columns, the product category in Rows and the total sales value in the Values area.
The Values area is where the calculations such as sum, count and average are performed.
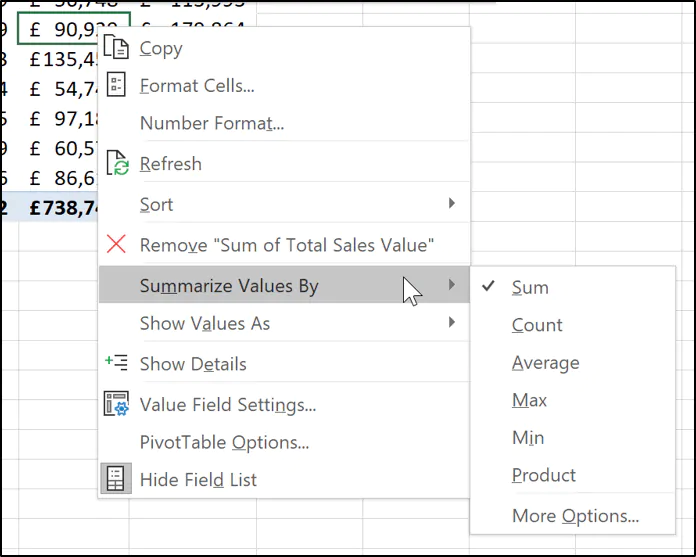
The calculation can be changed by right-clicking a PivotTable value, selecting Summarize Values By and selecting the function you want to use.
There is plenty more that PivotTables offer but that is beyond the scope of this article.
With PivotTables, I encourage you to grab some spreadsheet data, insert a PivotTable and start to drag fields into the areas and explore the options available. It really is a tool that you learn by doing.
9. Protect Excel data
Excel features such as PivotTables, formulas and Conditional Formatting will only work if the data is accurate.
A few of the tips in this article demonstrate ways to maintain this accuracy including creating drop-down lists and using Flash Fill. Protecting your Excel data is another important step to take.
Excel has a few different types of protection that can be applied, but the most popular one is to protect the sheet.
Protecting a sheet is performed in two stages. Firstly you specify which cells on the worksheet, you do not want to lock. This ensures that users can still edit these cells. Then you apply the protection.
- Select the range(s) of cells that you want to unlock (hold down the Ctrl key to select multiple ranges at the same time).
- Press Ctrl + 1 to open the Format Cells dialog.
- Click the Protection tab, uncheck the Locked box and click Ok.
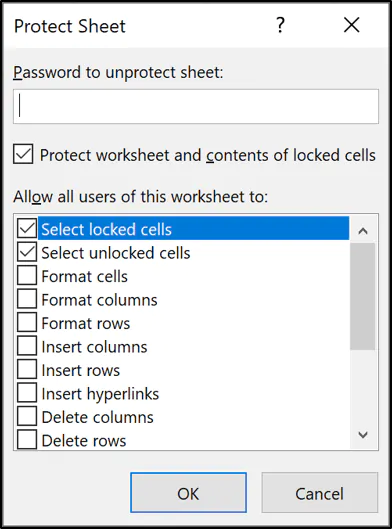
- Click Review > Protect Sheet.
- You can enter a password for extra security, but it is optional (this is typically omitted as you are normally protecting against accidents and a password is unnecessary). Check the boxes of any functionality users will need to perform and click Ok.
The unlocked cells can still be changed, but with limited functionality. If you try and edit a locked cell, a message will appear telling you that the sheet is protected.
10. Power up with Power Query and Power Pivot
Having knowledge of these two Power tools will take you beyond the regular user.
Power Query is a tool used to import and shape data ready for analysis. It is found on the Data tab of the Ribbon.
With Power Query, you can import data easily from a variety (and constantly evolving) of places including CSV, the web and from a folder.
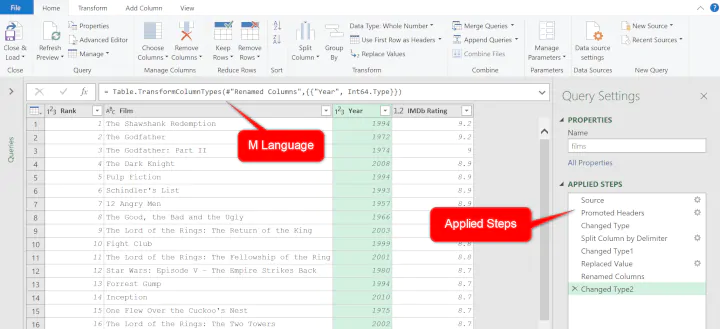
The Power Query Editor then provides a user-friendly environment to perform a number of cleaning and shaping operations such as splitting columns, formatting, removing duplicates and unpivoting data.
Power Query uses a language called M. This is difficult to master and fortunately not needed for 99% of Excel users. The editor provides everything that a user would need.
Every edit that is made is stored as a step and can be refreshed in the future with the click of a button.
Power Pivot (also known as the data model) is a tool that enables the storage of huge volumes of data. Storing data in Power Pivot enables us to go beyond the physical limitations of Excel.
In Power Pivot you can also create relationships between multiple tables of data and write functions known as DAX function.
The ability to create these models and use DAX provides far more power than you can get more a spreadsheet.
This is an important tool to understand for anyone involved in analyzing huge quantities of data or needs to perform complex analysis.
Bonus: Check out Ken Puls’ lesson from his Power Pivot course which explains what Power Pivot is, and how it can streamline your workflow with Excel.
11. Create Macros with VBA
Macros enable you to automate repetitive tasks to supercharge your productivity.
These tasks can be complex, but for most users, they are reasonably simple tasks that are repeated often. Macros provide a way to perform the tasks quicker and more reliably.
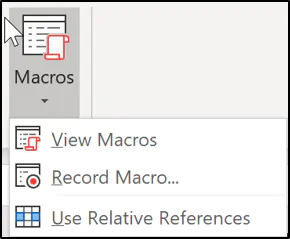
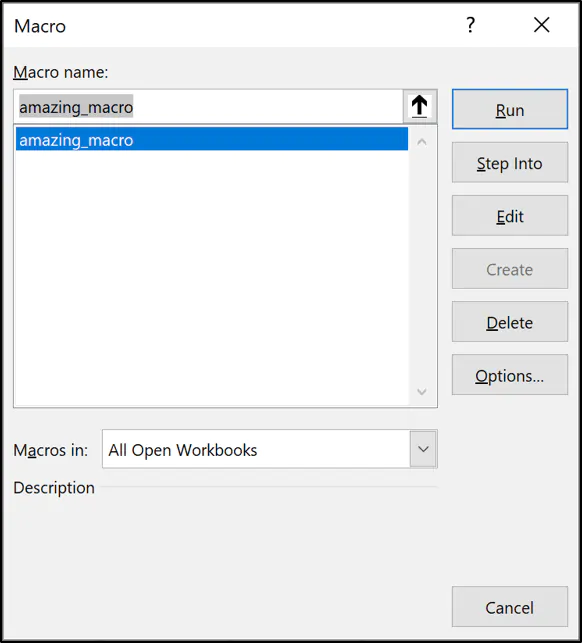
You can get started with macros by recording yourself performing Excel tasks. This will generate the VBA code and produce a macro.
You can find the macro recorder on the View tab of the Ribbon. It is the last button.
Recording macros can save you and your colleagues a great deal of time.
If you want to take things further, you can learn Excel VBA and edit your macros.
With VBA you can make your macros do things way beyond recording and create functionality that Excel does not offer itself.
To see the VBA code created by a recording;
Click View > Macros, select the macro in the list and click Edit.
Want to master Excel today?
Of all the tips on how to master Excel, the best way is to take a structured online Excel course that teaches you everything you need to know. Practice alongside a Microsoft MVP and learn the latest skills to boost your workplace efficiency today!
Level up your Excel skills
Become a certified Excel ninja with GoSkills bite-sized courses
Start free trial

