
Excel for Microsoft 365 Excel for Microsoft 365 for Mac Excel 2021 Excel 2021 for Mac Excel 2019 Excel 2019 for Mac Excel for iPad Excel for iPhone Excel for Android tablets Excel for Android phones Excel Mobile More…Less
You can use a map chart to compare values and show categories across geographical regions. Use it when you have geographical regions in your data, like countries/regions, states, counties or postal codes.

Download our examples
You can download a workbook with several map chart examples like the ones in this article.
Map charts can display both values and categories, and they each have different ways of displaying color. Values are represented by slight variations of two to three colors. Categories are represented by different colors.
For example, the Countries by Tax Revenue % chart below uses values. The values represent tax revenue in each country with each portrayed using a gradient spectrum of two colors. The color for each region is dictated by where along the spectrum its value falls. By default, the higher the value is, the darker its corresponding color will be.

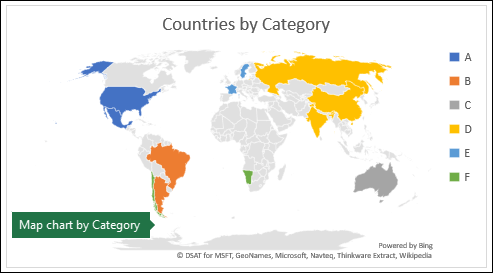
In the following example, Countries by Category, the categories are displayed using a standard legend to show groups or affiliations. Each country is represented by a different color.
Create a Map chart with Data Types
-
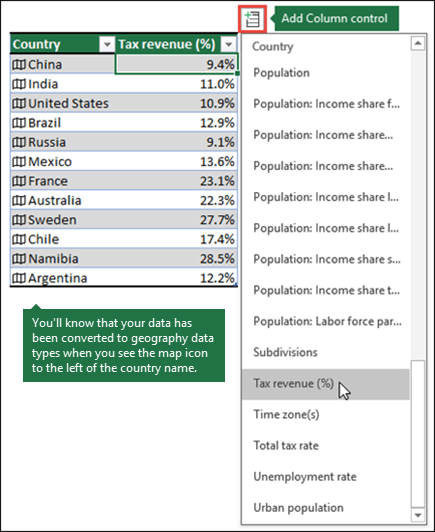
Map charts have gotten even easier with geography data types. Simply input a list of geographic values, such as country, state, county, city, postal code, and so on, then select your list and go to the Data tab > Data Types > Geography. Excel will automatically convert your data to a geography data type, and will include properties relevant to that data that you can display in a map chart. In the following example, we’ve converted a list of countries to geography data types, then selected the Tax revenue (%) field from the Add Column control to use in our map.

-
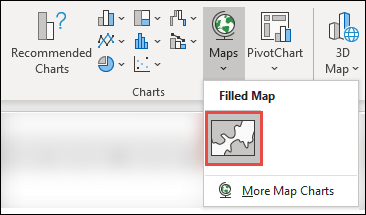
Now it’s time to create a map chart, so select any cell within the data range, then go to the Insert tab > Charts > Maps > Filled Map.
-
If the preview looks good, then press OK. Depending on your data, Excel will insert either a value or category map.
Tip: If your data is set up as an Excel table, and then you add a country to the list, Excel will automatically update it as a geography data type and update the linked map chart. Similarly, if you remove a country, then Excel will also remove it from the chart.
Formatting your Map chart
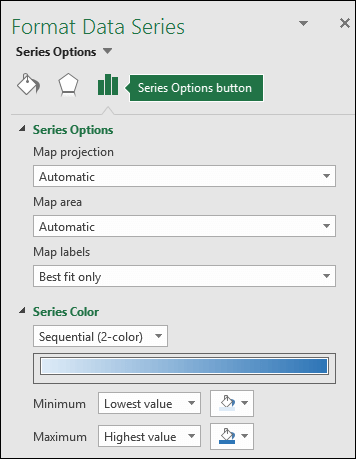
Once your map chart has been created you can easily adjust its design. Just click on the map, then choose from the Chart Design or Format tabs in the ribbon. You can also double-click the chart to launch the Format Object Task Pane, which will appear on the right-hand side of the Excel window. This will also expose the map chart specific Series options (see below).
Notes:
-
There are several map chart specific Series options, however they are not supported in Android devices or Excel Mobile. If you need some of the map Series options, then you can build your chart in Excel for Windows or Mac and view it on an Android device or Excel Mobile.
-
-
Learn more about Formatting Map Charts.
-
Map projections — Change the map’s projection style. By default, Excel will display the most efficient style.
-
Map area — Change the map’s Zoom level, ranging from a state/province view, all the way to the world view.
-
Map labels — Show geographic names for your countries/regions. Chose to show names based on fit, or show all labels.
Frequently Asked Questions
Question: When I use certain text-based locations, I end up with a blank map and an error, or some of my points map in other countries.
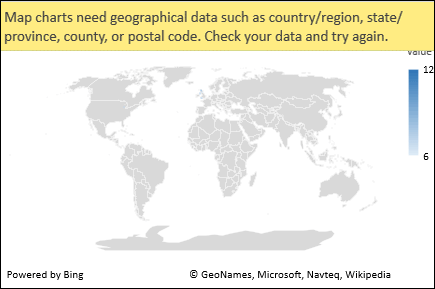
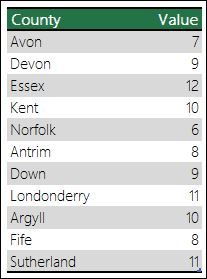
Answer: If you use data where there might be more than one similar location in the world, map charts can’t necessarily tell the difference without more guidance. If possible, add a higher-level detail column to your data. For example, the following locations won’t necessarily map the way you expect since there are many places in the world where these are valid county names:
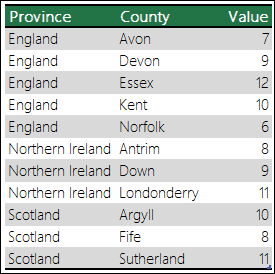
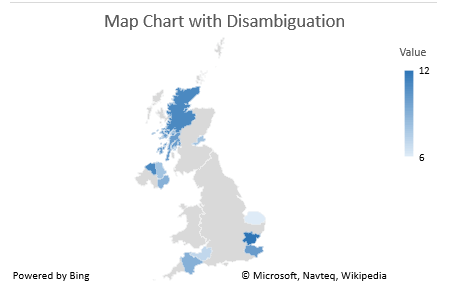
But the data should map correctly if you add another column for higher-level detail, in this case, Province – This is called Disambiguation:
When there are multiple levels of geographic details, you must separate each level into its own cell/column. For example, “Washington, United States” (State, Country) will not successfully generate a map. In this instance, the data will map successfully when placing “Washington” and “United States” into separate columns.

Data that won’t map (State and Country are combined)

Data that will create a map of Washington State
Limitations
-
Map charts can only plot high-level geographic details, so latitude/longitude, and street address mapping isn’t supported. Map charts also support one-dimensional display only, but if you need multi-dimensional detail you can use Excel’s 3D Map feature.
-
Creating new maps, or appending data to existing maps requires an online connection (to connect to the Bing Map service).
-
Existing maps can be viewed without an online connection.
-
There is a known issue where Map Charts which make use of Geography Data Types can sometimes map incorrectly. Please try to include Admin Fields, such as Province or Country when attempting to plot these until the problem is fixed.
Need more help?
You can always ask an expert in the Excel Tech Community or get support in the Answers community.
Need more help?
Want more options?
Explore subscription benefits, browse training courses, learn how to secure your device, and more.
Communities help you ask and answer questions, give feedback, and hear from experts with rich knowledge.
Содержание
- Начало работы с Power Map
- Создание первой карты Power Map
- Изучение примеров наборов данных в Power Map
- Map XML elements to cells in an XML Map
- Locate or create XML schema and XML data files
- Use sample XML schema and XML data files
- Create an XML Map
- Map XML elements
- Show the Developer tab
- Get started with Power Map
- Create your first Power Map
- Explore sample datasets in Power Map
Начало работы с Power Map
Microsoft Power Map для Excel — это инструмент для трехмерной визуализации данных, который позволяет взглянуть на информацию по-новому. Вы можете получить результаты, которые недоступны при использовании традиционных двухмерных таблиц и диаграмм.
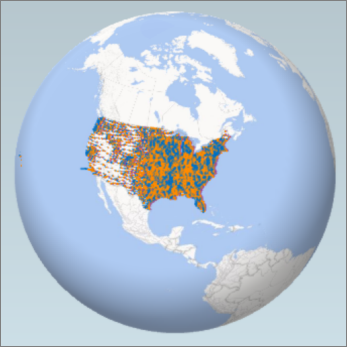
В Power Map можно отображать географические и временные данные на глобусе или пользовательской карте, показывать их изменение со временем, создавать наглядные туры и делиться ими с другими людьми. С помощью Power Map можно:
Карта данных Отобразить на картах Bing более миллиона строк данных в объемном формате из таблицы или модели данных Excel.
Обнаружение информации Повысьте понимание, просматривая данные в географическом пространстве и просматривая изменение данных с отметками времени с течением времени.
Делитесь историями Сделайте снимки экрана и создайте кинематографические управляемые видеотуры, которые можно сделать более интересными для широкой аудитории, как никогда раньше. Или экспортировать туры в видео и поделиться ими таким же образом.
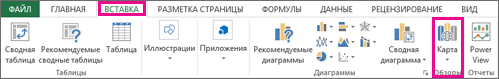
Кнопка Карта находится в группе Туры на вкладке Вставка ленты Excel, как показано на этом рисунке.
Если вы не нашли эту кнопку в своей версии Excel, см. раздел Я не вижу кнопку Power Map в Excel.
Если у вас есть подписка Приложения Microsoft 365 для предприятий, вы можете использовать Power Map Excel в составе средств самостоятельной бизнес-аналитики. При добавлении новых возможностей и внесении усовершенствований в Power Map вы получите их в рамках своего плана подписки.
Чтобы узнать о планах Microsoft 365 подписки, ознакомьтесь с Microsoft 365 профессиональныйplus и сравните все планы Microsoft 365 для бизнеса.
Если вы раньше устанавливали предварительную версию Power Map, у вас будет временно две кнопки Карта на вкладке Вставка: одна в группе Туры и одна в группе Power Map. При нажатии кнопки Карта в группе Туры включается текущая версия Power Map и удаляются все предварительные версии.
Создание первой карты Power Map
Если у вас есть данные Excel с географическими свойствами в табличном формате или в модели данных (такие как строки и столбцы, содержащие названия городов, областей, краев, стран или регионов, почтовые индексы либо значения долготы и широты), вы готовы приступить к работе. Вот как это сделать:
В Excel откройте книгу, которая содержит таблицу или данные модели, которые вы хотите изучить в Power Map.
Сведения о подготовке данных см. в подготовьте данные для Power Map.
Чтобы просмотреть примеры наборов данных, прокрутите страницу вниз до следующего раздела этой статьи.
Щелкните любую ячейку в таблице.
Щелкните Вставить > Карта. При первом нажатии кнопки Карта автоматически включается Power Map.
Power Map Bing используется для геокодирования данных на основе их географических свойств. Через несколько секунд появится глобус рядом с первым экраном области слоев.
В области слоев проверьте, правильно ли сопоставлены поля, и щелкните стрелку раскрывающегося списка для неправильных полей, чтобы сопоставить их с нужными географическими свойствами.
Например, убедитесь, что почтовый индекс распознается в поле «Индекс».
Когда Power Map отображает данные, на глобусе появляются точки.
Нажмите кнопку Далее для статистической обработки и дальнейшей визуализации данных на карте.
Изучение примеров наборов данных в Power Map
С помощью примеров наборов данных можно ознакомиться с Power Map. Просто скачайте одну из следующих книг, в которые уже есть геопро пространственные записи, необходимые для начала работы. Как в приложениях Dallas Utilities, так и в службе food Inspections в Сиэтле есть данные с отметкой времени, которые позволяют просматривать данные с течением времени.
Источник
Map XML elements to cells in an XML Map
To import and export XML data in Excel, an XML Map that associates XML elements with data in cells to get the results you want will be useful. To create one, you need to have an XML schema file (.xsd) and an XML data file (.xml). After creating the XML Map, you can map XML elements the way you want.
Tip: You’ll find more information about using XML with Excel in this overview of XML in Excel.
Locate or create XML schema and XML data files
If another database or application created an XML schema or XML data file, you might already have them available. For example, you might have a line-of-business application that exports data into these XML file formats, a commercial web site or web service that supplies these XML files, or a custom application developed by your IT department that automatically creates these XML files.
If you don’t have the necessary XML files, you can create them by saving the data you want to use as a text file. You can then use both Access and Excel to convert that text file to the XML files you need. Here’s how:
Import the text file you want to convert and link it to a new table.
Click File > Open.
In the Open dialog box, select and open the database in which you want to create a new table.
Click External Data > Text File, and follow the instructions for each step, making sure that you link the table to the text file.
Access creates the new table and displays it in the Navigation Pane.
Export the data from the linked table to an XML data file and an XML schema file.
Click External Data > XML File (in the Export group).
In the Export — XML File dialog box, specify the file name and format, and click OK.
Create an XML Map based on the XML schema file you exported from Access.
If the Multiple Roots dialog box appears, make sure you choose dataroot so you can create an XML table.
Create an XML table by mapping the dataroot element. See Map XML elements for more information.
Import the XML file you exported from Access.
There are several types of XML schema element constructs Excel doesn’t support. The following XML schema element constructs can’t be imported into Excel:
This element allows you to include elements that aren’t declared by the schema.
This element allows you to include attributes that aren’t declared by the schema.
Recursive structures A common example of a recursive structure is a hierarchy of employees and managers in which the same XML elements are nested several levels. Excel doesn’t support recursive structures more than one level deep.
Abstract elements These elements are meant to be declared in the schema, but never used as elements. Abstract elements depend on other elements being substituted for the abstract element.
Substitution groups These groups allow an element to be swapped wherever another element is referenced. An element indicates it’s a member of another element’s substitution group through the attribute.
Mixed content This content is declared by using mixed=»true» on a complex type definition. Excel doesn’t support the simple content of the complex type but does support the child tags and attributes defined in that complex type.
Use sample XML schema and XML data files
The following sample data has basic XML elements and structures you can use to test XML mapping if you don’t have XML files or text files to create the XML files. Here’s how you can save this sample data to files on your computer:
Select the sample text of the file you want to copy, and press Ctrl+C.
Start Notepad, and press Ctrl+V to paste the sample text.
Press Ctrl+S to save the file with the file name and extension of the sample data you copied.
Press Ctrl+N in Notepad and repeat step 1-3 to create a file for the second sample text.
Sample XML data (Expenses.xml)
Sample XML schema (Expenses.xsd)
Create an XML Map
You create an XML Map by adding an XML schema to a workbook. The schema can be copied from an XML schema file (.xsd), or Excel can try to infer one from an XML data file (.xml).
Click Developer > Source.
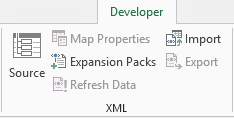
If you don’t see the Developer tab, see Show the Developer tab.
In the XML Source task pane, click XML Maps, and then click Add.
In the Look in list, click the drive, folder, or Internet location that contains the file you want to open.
Click the file, and then click Open.
For an XML schema file, XML will create an XML Map based on the XML schema. If the Multiple Roots dialog box appears, choose one of the root nodes defined in the XML schema file.
For an XML data file, Excel will try to infer the XML schema from the XML data, and then creates an XML Map.
The XML Map appears in the XML Source task pane.
Map XML elements
You map XML elements to single-mapped cells and repeating cells in XML tables so you can create a relationship between the cell and the XML data element in the XML schema.
Click Developer > Source.
If you don’t see the Developer tab, see Show the Developer tab.
In the XML Source task pane, select the elements you want to map.
To select nonadjacent elements, click one element, and then hold down Ctrl and click each element you want to map.
To map the elements, do the following:
Right-click the selected elements, and click Map element.
In the Map XML elements dialog box, select a cell and click OK.
Tip: You can also drag the selected elements to the worksheet location where you want them to appear.
Each element appears in bold type in the XML Source task pane to indicate the element is mapped.
Decide how you want handle labels and column headings:
When you drag a nonrepeating XML element onto the worksheet to create a single-mapped cell, a smart tag with three commands is displayed, which you can use to control the placement of the heading or label:
My Data Already Has a Heading Click this option to ignore the XML element heading, because the cell already has a heading (to the left of the data or above the data).
Place XML Heading to the Left Click this option to use the XML element heading as the cell label (to the left of the data).
Place XML Heading Above Click this option to use the XML element heading as the cell heading (above the data).
When you drag a repeating XML element onto the worksheet to create repeating cells in an XML table, the XML element names are automatically used as column headings for the table. However, you can change the column headings to any headings that you want by editing the column header cells.
In the XML Source task pane, you can click Options to further control XML table behavior:
Automatically Merge Elements When Mapping When this check box is selected, XML tables are automatically expanded when you drag an element to a cell adjacent to the XML table.
My Data Has Headings When this check box is selected, existing data can be used as column headings when you map repeating elements to your worksheet.
If all XML commands are dimmed, and you can’t map XML elements to any cells, the workbook might be shared. Click Review > Share Workbook to verify that and to remove it from shared use as needed.
If you want to map XML elements in a workbook you want to share, map the XML elements to the cells you want, import the XML data, remove all of the XML maps, and then share the workbook.
If you can’t copy an XML table that contains data to another workbook, the XML table might have an associated XML Map that defines the data structure. This XML Map is stored in the workbook, but when you copy the XML table to a new workbook, the XML Map isn’t automatically included. Instead of copying the XML table, Excel creates an Excel table that contains the same data. If you want the new table to be an XML table, do the following:
Add an XML Map to the new workbook by using the .xml or .xsd file you used to create the original XML Map. You should save these files if you want to add XML Maps to other workbooks.
Map the XML elements to the table to make it an XML table.
When you map a repeating XML element to a merged cell, Excel unmerges the cell. This is expected behavior, because repeating elements are designed to work with unmerged cells only.
You can map single, nonrepeating XML elements to a merged cell, but mapping a repeating XML element (or an element that contains a repeating element) to a merged cell isn’t allowed. The cell will be unmerged, and the element will be mapped to the cell where the pointer is located.
You can unmap XML elements you don’t want to use, or to prevent the contents of cells from being overwritten when you import XML data. For example, you could temporarily unmap an XML element from a single cell or repeating cells that have formulas you don’t want to overwrite when you import an XML file. When the import is complete, you can map the XML element to the formula cells again, so you can export the results of the formulas to the XML data file.
To unmap XML elements, right-click their name in the XML Source task pane, and click Remove element.
Show the Developer tab
If you don’t see the Developer tab, do the following to display it:
In Excel 2010 and newer versions:
Click File > Options.
Click the Customize Ribbon category.
Under Main Tabs, check the Developer box, and click OK.
Click the Microsoft Office Button  > Excel Options.
Click the Popular category.
Under Top options for working with Excel, check the Show Developer tab in the Ribbon box, and click OK.
Источник
Get started with Power Map
Microsoft Power Map for Excel is a three-dimensional (3-D) data visualization tool that lets you look at information in new ways. A power map lets you discover insights you might not see in traditional two-dimensional (2-D) tables and charts.

With Power Map, you can plot geographic and temporal data on a 3-D globe or custom map, show it over time, and create visual tours you can share with other people. You’ll want to use Power Map to:
Map data Plot more than a million rows of data visually on Bing maps in 3-D format from an Excel table or Data Model in Excel.
Discover insights Gain new understandings by viewing your data in geographic space and seeing time-stamped data change over time.
Share stories Capture screenshots and build cinematic, guided video tours you can share broadly, engaging audiences like never before. Or export tours to video and share them that way as well.
You’ll find the Map button in the Tours group on the Insert tab of the Excel ribbon, as shown in this picture.
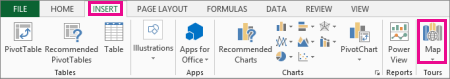
If you can’t find this button in your version of Excel, go to I don’t see the Power Map button in Excel.
If you have a subscription for Microsoft 365 Apps for enterprise, you have access to Power Map for Excel as part of the self-service business intelligence tools. Whenever any new Power Map features and performance enhancements are released, you’ll get them as part of your subscription plan.
If you previously installed a preview version of Power Map, you’ll temporarily have two Map buttons on the Insert tab: one in the Tours group and one in the Power Map group. Clicking the Map button in the Tours group enables the current version of Power Map and uninstalls any preview versions.
Create your first Power Map
When you have Excel data that has geographic properties in table format or in a Data Model—for example, rows and columns that have names of cities, states, counties, zip codes, countries/regions, or longitudes and latitudes—you’re ready to get started. Here’s how:
In Excel, open a workbook that has the table or Data Model data you want to explore in Power Map.
For information about preparing your data, see Prepare your data for Power Map.
To see some example datasets, scroll down to the next section of this article.
Click any cell in the table.
Click Insert > Map. Clicking Map for the first time automatically enables Power Map.
Power Map uses Bing to geocode your data based on its geographic properties. After a few seconds, the globe will appear next to the first screen of the Layer Pane.
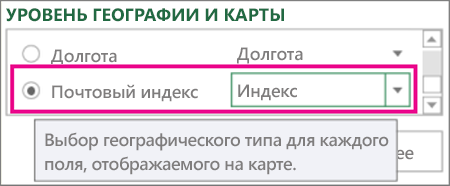
In the Layer Pane, verify that fields are mapped correctly and click the drop-down arrow of any incorrectly mapped fields to match them to the right geographic properties.
For example, make sure that Zip Code is recognized as Zip in the drop-down box.
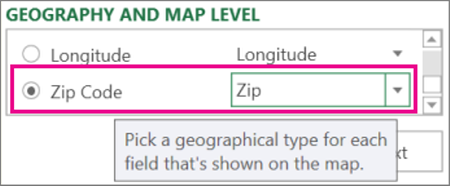
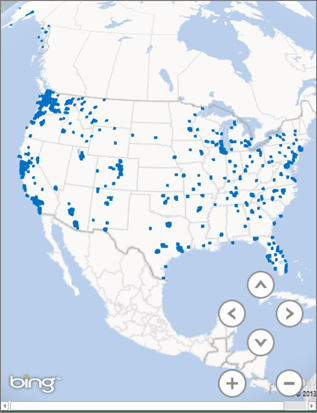
When Power Map plots the data, dots appear on the globe.

Click Next to start aggregating and further visualizing your data on the map.
Explore sample datasets in Power Map
Our sample datasets are a great way to try out Power Map. Just download one of the following workbooks that already have the necessary geo-spatial entries you need to get started. Both the Dallas Utilities, and Food Inspections in Seattle downloads have time-stamped data, which allow you to view data over time.
Источник
How do I map data using Excel spreadsheets?
This video explains how to work with Excel spreadsheets in ZeeMaps:
How do I map data from other spreadsheets?
ZeeMaps provides a flexible and easy way to map data from spreadsheets. You can upload your spreadsheet onto a map, copy a table and paste it into a form in ZeeMaps, or attach a Google Drive spreadsheet to a map.
To upload a spreadsheet, select ‘Additions’ from the menu on your map, then ‘Add (Upload) Multiple Markers’. Choose the ‘Upload Spreadsheet’ option. You will get a dialog to browse and select your spreadsheet. If you want, you can also use the ‘Copy-and-Paste Table’ option, or the ‘Cloud Drive Spreadsheet’ option.

Your spreadsheet should have information on it that allows us to determine the location for each row, e.g., a post code, zip code, city, state, etc. Additionally, you can have as many columns as you need. Some columns, such as the ‘Name’ column, will be utilized as one of the “standard” columns, while others will add fields to your markers.
Spreadsheets can also contain street address, city, and state. You can provide latitude, longitude columns as well. The more information you provide, the better we’ll be able to position the pins.
When you upload your spreadsheet, ZeeMaps uses the header row to determine how to use the data in each column. The standard columns names that ZeeMaps uses are described below. As noted above, you do not need to provide all columns. Just enough information for ZeeMaps to locate your entries. For example, you can provide just Name and Postal Code columns, or Name and City columns.
What are the standard columns?
- Address Street: Street location, e.g, 1 Apple Loop. Can also be full location address.
- City: City, e.g, Cupertino
- State: State, e.g, CA or California
- Country: Country, e.g, US, UK, USA
- Post Code: Zip code or postal code, e.g., 95014 or
- Name: Title for the entry. If you do not provide a Name column, your entries will be called “Anonymous”
- Category: Grouping of your entry into different categories, e.g., Gold, Silver, Platinum. Each category will show as a different colored marker. ZeeMaps will also automatically create a legend based on the categories, in the order that they appeared in the spreadsheet. You can re-order them by selecting ‘Map’ then ‘Legend’ from the menu. We support up to 31 categories.
- Latitude: In decimals, e.g., 34.23
- Longitude: In decimals, e.g., -121.05
- Photo URL: If you want, you can specify a photo URL for each entry
- Photo width: Width of the photo element for an entry in pixels
- Photo height: Height in pixels
- YouTube: Specify a YouTube video ID for your entry. (Note that this is just the video ID and not the full URL).
- Video width: Width in pixels
- Video height: Height in pixels
When you upload your Excel spreadsheet – or another spreadsheet – ZeeMaps will ask you to make assignments for the standard columns to your spreadsheet columns. You do not need to have all the columns, just enough information that we can figure out the location for your markers. All columns from your spreadsheet that do not get mapped to a standard column will be used as custom fields of information attached to each marker. You can use these fields later to search on your map.
Can I ignore data?
Yes. If you have more columns in your spreadsheet than you’d like to upload, you can use the ‘Ignore’ tab in the spreadsheet uploader. Just select all the columns that you don’t want to see on the map.
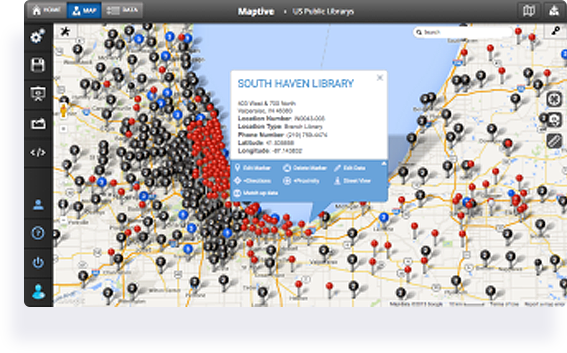
Map Excel Data to Create an Interactive Map
A lot of mapping tools are cumbersome, complicated, or expensive to use. Our elegant Excel mapping software makes data visualization simple and fast for everyone. Upload a list of addresses in spreadsheet format and create a map within minutes. Plot addresses on a Google map by uploading your excel file.
Follow the steps below to get started with Maptive. Once complete, each spreadsheet column will be represented by a marker on the map, making it easy to start analyzing and discovering new opportunities buried in your data.
4 Steps to Create a Map from Excel Data:
Create a map using your Exel spreadsheet data in just a few steps:
Step 1: Sign up for the free trial of Maptive. (Remember when we told you how free it was? You don’t even need to give us your credit card details.)
Step 2: Click the “create your first map” button. Give it a name, click “Continue,” and you’re ready to start.
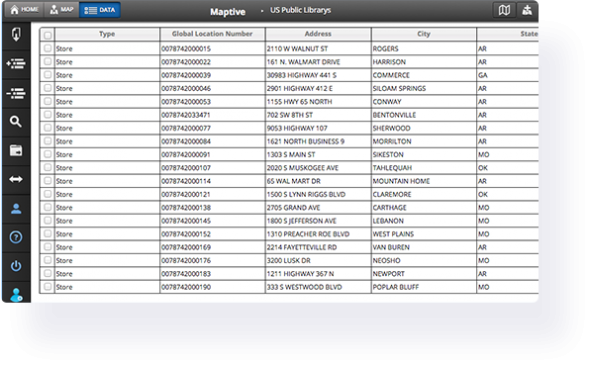
Step 3: Upload your Excel or Google Sheets spreadsheet into our platform. We’ll do the heavy lifting and generate an interactive, customizable Google Map for you within seconds.
Or choose one of these alternative methods to create your map:
- Use our API to connect your data directly to your map for real-time updates.
- Connect your Google Spreadsheet data to our platform. Any changes made on your Google Spreadsheet will automatically be reflected on your map.
- Start with a blank map and add your locations manually, one at a time.
Step 4: Select the columns in your spreadsheet that contain location data. We’ll automatically match most of them for you automatically so you can do this step in your sleep.
Congratulations! You now have an exquisite map awaiting your personal touch.
Once your initial map is created, use the many tools in our software to customize it and discover new opportunities hiding in your data.
Share your maps, embed them in a blog post, save them, or keep them to yourself — it’s up to you. You can be sure that using our powerful software will open up a new world of ways to analyze your data.
What Can Maptive’s Excel Maps Do?
Maptive provides hundreds of features that let you view your spreadsheet data in completely new ways. Below is just a sampling of what is possible. If you have a specific type of map you want, feel free to view all our features or ask us a question using the button at the bottom right-hand corner of the screen.
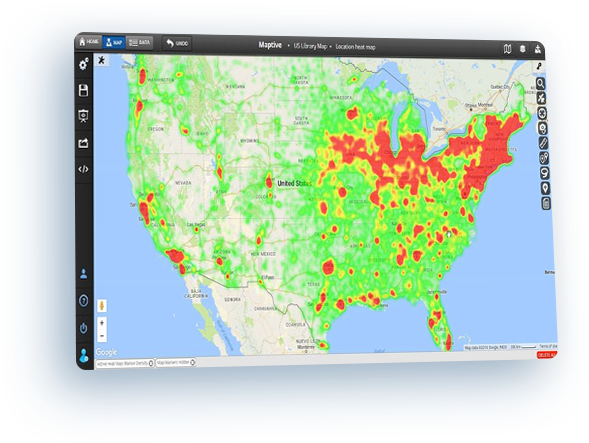
Heat Map Excel Data
Generate a heat map based on the geographic location of each row of data. Additionally, if you want to add weight to the locations in your spreadsheet, you can select a column such as sales or clients. The resulting heat map will be darker where there are more total sales and lighter where there are few or none.
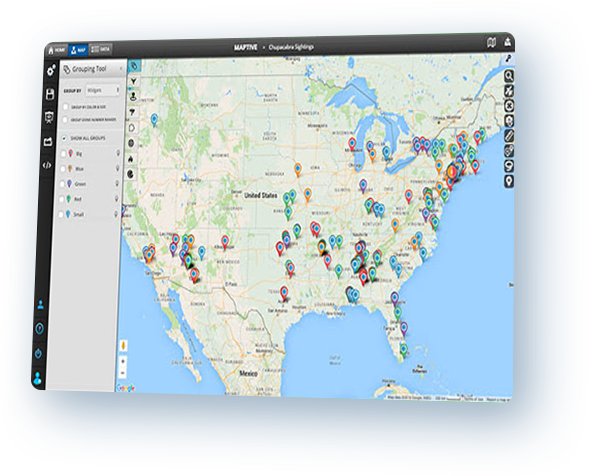
Group spreadsheet data on a map
Select a column in your Excel data and Maptive will automatically find all of the unique values in that column. Then we’ll place a colored marker on the map for each row in your spreadsheet. Each color in the map area will represent one of the unique values from the grouping column.
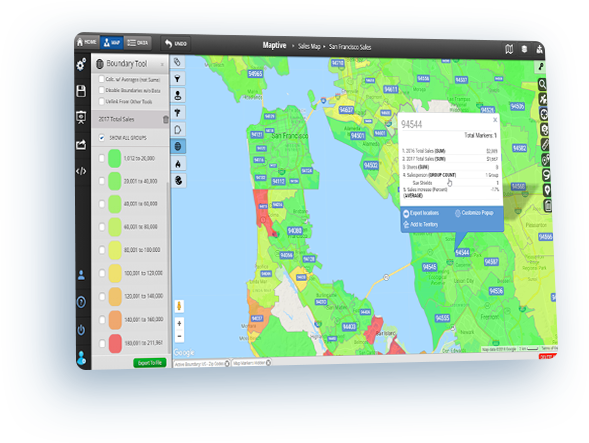
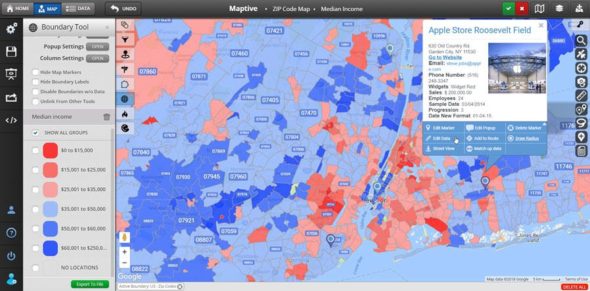
Map zip codes based on your data
The boundary tool incorporates a US zip code map that displays the borders of the approximately 43,000 zip codes in the United States. In moments, you can combine your own data with the comprehensive information – including the latest census data – provided by Maptive. Plus, shade zip codes with different colors based on the data within them to quickly analyze your map. Also, postal codes for countries such as Canada, the UK, and Australia are available.
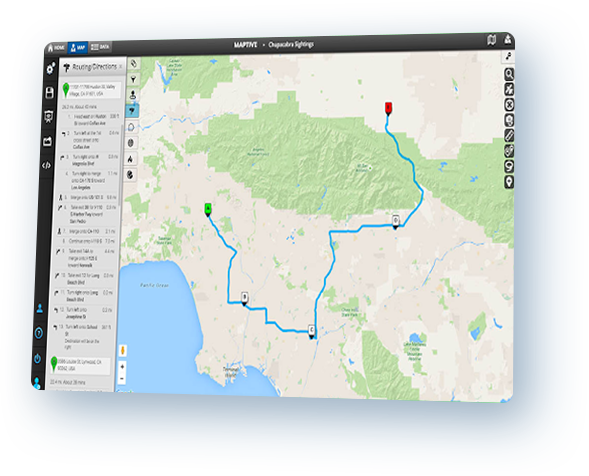
Plan multi-stop driving routes
Input your spreadsheet data into Maptive and, very quickly, you’ll be able to map street addresses from Excel. Maptive also creates an optimized route for you that will reduce your travel time and get you where you need to be quicker.
Start Your Free, No Risk, 10 Day Trial
No credit card required. No surprises. Just Results.
START MAPPING NOW
Maptive uses cookies to improve your experience with our software and websites. By clicking “Accept”, or continuing to navigate the site, you consent to our use of cookies.
Визуализация геоданных на карте
Если ваша компания имеет филиалы по стране или продает не только в пределах МКАД, то рано или поздно вы столкнетесь с задачей наглядно отобразить числовые данные из Microsoft Excel (продажи, заявки, объемы, клиентов) на географической карте с привязкой к конкретным городам и регионам. Давайте вкратце пробежимся по основным способам визуализации геоданных, которые существуют в Excel.
Способ 1. Быстро и бесплатно — компонент Bing Maps
Начиная с 2013 версии в Excel встроен магазин приложений, т.е. появилась возможность докупать, скачивать и устанавливать дополнительные модули и надстройки с недостающими функциями. Один из таких компонентов как раз и позволяет наглядно отображать числовые данные на карте — он называется Bing Maps и, что особенно приятно, абсолютно бесплатен. Для его установки откройте вкладку Вставка — Магазин (Insert — Office Apps):

После вставки компонента на листе должен появится динамический контейнер с картой. Для визуализации на карте вашей информации нужно выделить диапазон с геоданными и нажать кнопку Показать местоположения (Show Locations):

При необходимости в настройках (иконка с шестеренкой в правом верхнем углу компонента) можно поменять цвета и тип отображаемых диаграмм:

Также возможно быстро отфильтровать города, отобразив только нужные (значок воронки в правом верхнем углу компонента).
Спокойно можно привязываться не только к городам, но и к другим объектам: областям (например, Тульская область), автономным округам (например, Ямало-Ненецкий АО) и республикам (Татарстан) — тогда кругляш диаграммы будет отображен в центре области. Главное, чтобы название в таблице совпадали с подписями на карте.
Итого в плюсах этого способа: легкая бесплатная реализация, автоматическая привязка к карте, два типа диаграмм, удобная фильтрация.
В минусах: нужен Excel 2013 с доступом в интернет, нельзя выделять области и районы.
Способ 2. Гибко и красиво — режим карты в отчетах Power View
Некоторые версии Microsoft Excel 2013 идут в комплекте с мощной надстройкой визуализации отчетов, которая называется Power View и позволяет (помимо всего прочего, а умеет она много!) наглядно отображать данные на карте. Для активации надстройки откройте вкладку Разработчик (Developer) и щелкните по кнопке Надстройки COM (COM Add-ins). В открывшемся окне поставьте галочку напротив Power View и нажмите ОК. После всех этих манипуляций на вкладке Вставка (Insert) у вас должна появиться кнопка Power View.
Теперь можно выделить диапазон с исходными данными нажать на эту кнопку — в вашей книге будет создан новый лист (больше похожий на слайд из Power Point), где отобразятся выделенные данные в виде таблицы:

Превратить таблицу в географическую карту можно легко с помощью кнопки Карта (Map) на вкладке Конструктор (Design):

Обратите особое внимание на правую панель Поля Power View — на ней, в отличие от примитивных Bing Maps, перетаскивая мышью названия столбцов (полей) из исходной таблицы и бросая их в разные области, можно очень гибко настраивать получившееся геопредставление:
- В область Местоположения (Locations) нужно закинуть столбец из исходной таблицы содержащий географические названия.
- Если у вас нет столбца с названием, но есть колонки с координатами, то их нужно поместить в области Долгота (Longitude) и Широта (Latitude), соответственно.
- Если в область Цвет (Color) закинуть товар, то каждый пузырек будет кроме размера (отображающего общую прибыль по городу) детализирован на дольки по товарам.
- Добавление поля в области Вертикальных или Горизонтальных множителей (Dividers) разделит одно карту на несколько по этому полю (в нашем примере — по кварталам).
Также на появившейся сверху контекстной вкладке Макет (Layout) можно настроить фон карты (цветная, ч/б, контурная, вид со спутника), подписи, заголовки, легенду и т.д.

Если данных очень много, то на вкладке Power View можно включить специальную Область фильтров (Filters), где с помощью привычных галочек можно выбрать какие именно города или товары нужно показать на карте:

Итого в плюсах: легкость использования и гибкость настройки, возможность дробить одну карту на несколько по категориям.
В минусах: Power View есть не во всех комплектациях Excel 2013, нет других типов диаграмм кроме пузырьковых и круговых.
Способ 3. Дорого и профессионально — надстройка Power Map
Это отдельная COM-надстройка для максимально тяжелых случаев, когда нужна сложная, профессионально выглядящая, анимированная визуализация большого количества данных на любой (даже пользовательской карте), причем с видео динамики процесса во времени. На этапе разработки она имела рабочее название GeoFlow, а позже была переименована в Power Map. К сожалению, в полноценном варианте эта надстройка доступна только покупателям либо полной версии Microsoft Office 2013 Pro, либо подписчикам корпоративных версий Office 365 с тарифным планом Business Intelligence (BI). Однако превьюшку этой надстройки товарищи из Microsoft дают скачать «на поиграться» совершенно бесплатно, за что им спасибо.
Ссылка на скачивание Power Map Preview с Microsoft Download Center (12 Мб)
После скачивания и установки надстройку нужно подключить на вкладке Разработчик — Надстройки COM (Developer — COM Add-ins) аналогично Power View из предыдущего пункта. После этого на вкладке Вставка должна появиться кнопка Карта (Map). Если теперь выделить таблицу с исходными данными:

… и нажать кнопку Карта, то мы попадем в отдельное окно надстройки Microsoft Power Map:

Если не вдаваться в детали (которых тут хватит на отдельный тренинг на полдня), то общие принципы работы с картой тут те же, что и в Power View, описанной выше:
«Вау-моментом» надстройки Power Map можно, пожалуй, назвать предельную легкость создания анимированных видеообзоров на основе сделанных карт. Достаточно сделать несколько копий текущей сцены с разных углов просмотра и разным масштабом — и надстройка автоматически создаст 3D-анимацию облета вашей карты с акцентированием внимания на выбранных местах. Полученное видео потом легко сохраняется в mp4-формате в виде отдельного файла для вставки, например, на слайд Power Point.
Способ 4. Пузырьковая диаграмма с «доработкой напильником»
Самый «колхозный» способ из всех перечисленных, но зато работающий во всех версиях Excel. Построить пузырьковую диаграмму (Bubble Chart), отключить у нее оси, сетку, легенду… т.е. все, кроме пузырей. Затем вручную подогнать положение пузырей, подложив под диаграмму скачанное заранее изображение нужной карты:

Минусы этого способа очевидны: долго, муторно, много ручной работы. Да еще и вывод подписей к пузырям представляет собой отдельную проблему, когда их много.
Плюсы в том, что этот вариант будет работать в любой версии Excel, в отличие от следующих способов, где обязательно требуется Excel 2013. Да и подключение к интернету не требуется.
Способ 5. Сторонние приложения и надстройки
Раньше существовало несколько надстроек и плагинов для Excel, позволяющих с той или иной степенью удобства и красоты реализовать отображение данных на карте. Сейчас подавляющее большинство из них либо заброшены разработчиками, либо в стадии тихого отмирания — с Power Map конкурировать тяжело 
Из оставшихся в живых достойны упоминания:
- MapCite — пожалуй, самая мощная из всех. Умеет привязываться к карте по названиям населенных пунктов, областей, округов и координатам. Выводит данные в виде точек или тепловой карты. Использует карты Bing в виде основы. Автоматом умеет кидать созданную карту в презентации Power Point. Для скачивания доступна бесплатная trial-версия, полная версия стоит 99$/год.
- Esri Maps — надстройка от компании Esri также позволяющая подгружать и анализировать геоданные из Excel на карты. Много настроек, различные типы диаграмм, поддерживает русский язык. Есть бесплатная демо-версия. Полная версия требует подписки на картографический сервис ArcGis.
- MapLand— одна из первых надстроек на эту тему, созданных еще для Excel 97-2003. Идет с набором карт в виде графических примитивов, к которым и привязываются данные с листа. Дополнительные карты надо докупать. Для скачивания доступна демка под разные версии Excel, Pro версия стоит 299$.