
If Microsoft Office had been a country, it would have been the third most populous country in the world. 1.2 billion people using a single suite of apps is mind-boggling. And, they «speak» 107 languages!
But right now, you and I are speaking in English and we are going to talk about the most popular tool in the Microsoft Office arsenal — Microsoft Word 2016.
This document editor is used for writing a variety of documents. From a simple application to the necessary resume. From a plain bucket list to an office memo. We think we can work with Word. But it is when we sit down to write a serious professional report, we discover an important fact.
Professional report writing needs a different set of skills.
So, ask yourself this — can you make the leap from a single document to a lengthy report? Do you know all the Microsoft Word features that will help manage this large scale document project? Can you collaborate on the work with other team members?
You may be a student, a small business owner, or an office worker…you will need to create a report or a professionally formatted document of some kind. This MakeUseOf guide will help you update your techniques and sharpen your design approach.
In this guide:
Writing a Report — Introduction | The Report Checklist
Useful Microsoft Word Tools — Paste Special | Researcher | Freeze Parts of Your Document
Work on the Layout & Design — Intro | Cover Page | Table of Contents | Header and Footer | Page Numbers | Font Styling | Paragraph Styling | Page Breaks | Styles and Themes | Captions | Quick Parts | Page Borders
References and Collaboration — Index | Bibliographies | Cross-Referencing | Comments
Finalize Your report — Signatures | Watermarks | Read Only | Print to PDF
The Next Step — Conclusion
Writing a Report
Report writing involves research and then publishing the outcome of that analysis. In the professional world, the «look» or appearance of what you publish is paramount. The eye-pleasing final result could burnish your reputation and enhance your personal brand.
The steps below will handhold you through the expert features in Microsoft Word 2016. Spend a lot of time on a plan. Start with these guidelines…

Step 1: Decide the Purpose
Before you begin the report, you must first know why you are writing it in the first place. Reports are of many kinds but they are either meant to inform or persuade. It can be meant for describing a technical process, sharing background information, or demonstrate progress on a project.
Ask yourself – What and Why. This will help you distill the purpose to the one main point and stick to it instead of rambling on with unnecessary details.
Step 2: Identify Your Audience
The second important consideration is to evaluate your audience. Will they be able to understand what you are talking about? Are there different levels of readers who will read the report? The reader’s knowledge of the subject will greatly influence the information that you need to include.
Decide on the primary audience and then script the report at the adequate technical level. The secondary audience can be supported with supplemental information at the end of the report.
Step 3: Know Your Topic
You must know what you are talking about. So, research the topic, and include all the relevant information to prove your point. Make sure that you come to a conclusion based on facts and not personal opinion. The information must be correct, current, and well-referenced.
Also use a variety of resources such as journals, newspaper articles, books, websites, brochures, raw data, annual reports, and speeches to help support your point. Just don’t stick to Wikipedia.
Step 4: Outline the Report
You have done the research. There’s a ton of information that is waiting to be typed and printed. But wait! Don’t drown before you enter the water. Prepare the final outline of the report which will be the chart of waypoints to help you navigate from start to finish. The outline is the blueprint. It will give you a bird’s eye view of the land and also show you where you need to fill in the details.
The structure of an idea report can include the following elements:
- Title Page
- Executive Summary
- Table of Contents
- Introduction
- The Body of the Report
- Conclusion
- Recommendations
- Appendix
- Bibliography and References
Microsoft Word’s Document Outline is a powerful feature that can help you organize a document even before you start filling it with research. Take advantage of brainstorming and mind-mapping templates too.
Step 5: Write, Edit, Proofread, and Finish
Once you have structured your report, it is time to fill out the headers with content. I personally find it best to tackle a little bit of each section, and then bulk it up with information. You can do that if you want, or finish each section as you go down the report structure. Make sure you focus on presenting your ideas and using supportive evidence rather than spelling and grammar first. Outline your argument and write a few sentences that cast your main ideas. If you find something worth quoting, quote it.
Once the majority of your text is written, it is now time to read through it and make sure it flows well. Make sure you guide the reader’s understanding with transition words such as «This information shows…», «In other words…», «Similarly…» and do highlight relevant and key points.
Finally, spend time to proofread, check for grammar and spelling, and double-check all relevant information and its logical flow. It is best to leave at least one day to check and proofread your work. Don’t try to edit it straight after you think you have finished, as you will tend to miss read what you have written. Get some sleep, and proofread it the next day.
The Report Checklist
Before you go and submit or hand in your report that you have worked so hard on, make sure you have done the following:
- Completed the title page with the Title, Your Name, Date, Who the report is for, and a possible description of what the report is about.
- The contents page has appropriate headings and pages numbers are correct.
- Make sure the introduction covers key points, the scope of the report, and the objective it wants to meet.
- You have added captions above tables and below images/graphs.
- Does the content of the report present the information in a clear way, logical, factual, stay on topic, is to the point?
- Does the conclusion state the results, restate main idea’s, and does not include any new information?
- Are the headings and sub headings clearly labeled?
- Are quotes relevant, up-to-date, and correctly referenced?
- Have you used page breaks where appropriate?
Now, let’s launch Microsoft Word and take you through the features that will help piece together the draft of your report and present it as a professional document.
Useful Microsoft Word Features for Report Writing
Take these as bite-sized tips and master them one by one.
Microsoft Word is a big howitzer with many nuts and bolts. Let’s focus on the key skill sets and the tools you will need to plan, prepare, and present the professional report. The Microsoft Word features we will cover below are also productivity shortcuts that will make your job easier.
Tip: Use Microsoft Word 2016’s «Tell Me» assistant to learn more about new features in the Office suite.
Let’s start with three preliminary tools…
Use Paste Special
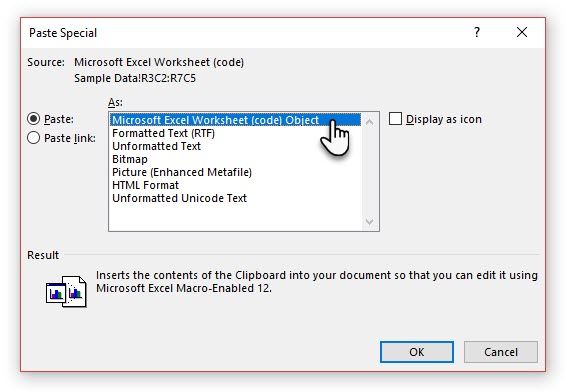
For most of us, when we need to copy text or an image into Word, the CTRL+V shortcut does just fine. But sometimes we might want to paste the copied data into another format, such as Excel data as an image. With the Paste Special command you can discard or specify the format when you paste a picture, presentation data, table, or object from any other program into Word.
You will work a lot with Excel tables and charts in a professional document.
If you just copy what you want and click paste, you will notice that it will insert the data as tables. But, if it is a large area of cells you want to paste, and you do not want to edit it, you may want to paste it as an image, with the extra option to edit it.
In Microsoft Excel: Select and highlight the cells that you want to copy > Press CTRL+C.
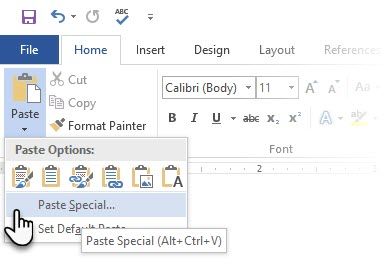
In Microsoft Word: Go to Home > Paste > Paste Special. Select Paste Special and from the dialog select Microsoft Office Excel Worksheet Object.
You can resize the data as it was an image, and if you double click, you will be able to edit the values. You can change the table or chart and redesign it. And, if you update the data in the chart or table in Excel, you can automatically refresh the chart in Word.
Try the right-click context menu too. The Paste Special menu pops up:
There are more options to import data from Excel into Word. The Microsoft Office Support page also describes them in detail.
Use the Researcher
Yes, there is Google and Wikipedia. But constantly switching from Word to your browser can hamper your productivity. Office 2016 brings in powerful research integration to this grunt work. The Researcher can not only help you find content from within Microsoft Word but also help you quickly add citations. It uses the Bing Knowledge Graph to find the right content to support your document.
Go to Ribbon > References tab and c Choose Researcher. A pane will open on the right with the search options.
Type a keyword for the topic want to search for and press Enter.
The Results pane shows a list of sources you can use in your document. Choose a topic to explore in detail.
Add the topic to your Microsoft Word document with a click on the plus sign on the top-right. You can also click the plus sign on any result to cite the source in your research document. The cite source helps you support your research with web sources and books.
As we will see later, an annotated bibliography is one of the toughest parts of a document. The Researcher is an intelligent assistant who steps in.
Freeze Part of Your Word Document
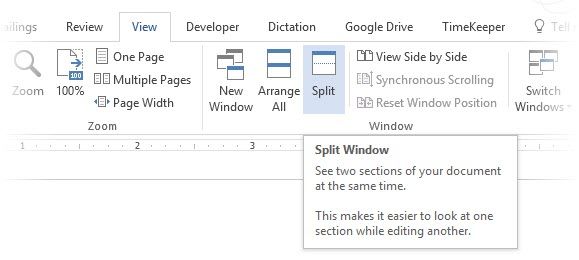
Let’s take for granted that your professional report will be a long and complex work. You can split the Word window into two panes so that you can view two different parts of a document at the same time. It is a valuable time saver when you want to copy and paste parts from one place to another or refer to one part of the document while working in another.
Go to Ribbon > View tab > Split.
To remove the split, click on Remove Split in the same tab.
The Windows group gives you several options to change the way you work with two or more documents. The features are self-explanatory.
To scroll both documents at the same time, click Synchronous Scrolling in the Window group on the View tab. You can also click on View Side by Side to put two parts of the document next to each other.
Tip: Use Split View to display two different layouts – for instance, Print and Outline. Set the split. Then, click in the pane that you want to change, and then select a different layout on the View tab.
Work on the Layout & Design
The presentation of a report is what gets someone to read a report in the first place, and that is why it is crucial that your report is well presented. If you had the choice of four reports to read, what will you choose?
- A hand written report.
- A document printed in black and white.
- A report printed on normal A4 paper in color.
- A report printed in color, with a catchy title page, neatly bounded, and slick?
You will pick up the fourth report because it will pull you towards it by the visual appearance alone.
The front cover is not the only reason. A well-designed report is easier to read. It is also easier to scan when you don’t have time to read. That is why you need to spend some time on your headers and footers, and the different styles and themes. In short – the formatting of every element in the report.
Formatting may seem like a difficult chore, but it is a fun exercise that will exercise all your creative muscles. The key takeaways will be the skills you can apply to anything in Microsoft Office going forward. And the time you will save with all the productivity tips learned here.
Microsoft Word 2016 has a wealthy set of features. These are only some of the ways that your report design can stand out from the rest and be professional. So, let’s break down the layout and design skills.
This section will cover these features step-by-step:
- Start with a Cover Page
- Make a Table of Contents
- Create Your Header and Footer
- Add Page Numbers
(Format the Content)
- Pick the Right Fonts
- Style the Paragraphs
- Control Page Breaks
- Use Styles and Themes
- Captions
- Use Quick Parts
- Decorate with Page Borders
1. Start With a Cover Page
The first page is the first point of contact with your reader. It is also your opportunity to make a favorable impression. Don’t let your lack of artistic skills be an excuse because Word takes up the job with its in-built gallery of title pages. All you have to do is marry one to the theme of the report.
Microsoft Word 2016 offers you 16 pre-formatted templates and three more on Office.com.
Go to Insert > Pages Group > Cover Page.
The cover page appears at the beginning of the document by default.
As there are only 16 «official» templates on offer, you may find that all your other peers have the same cover page. So, why not customize it, and make it a bit more unique.
You can design a title page (or cover page) in Microsoft Word that can be an original in the stack. Save it as a template or easily change the design on the fly.
2. Make a Table of Contents
Casual readers scan. Good readers scan first and then dive deep. A table of contents provides the waypoints that help both. When it is a long and complicated document, wouldn’t you rather check the lay of the land before you head to the section that interests you?
Consider a Table of Contents (TOC) if your document is more than 10 pages long. You should first make sure you don’t need to rearrange any pages in your document before creating the TOC.
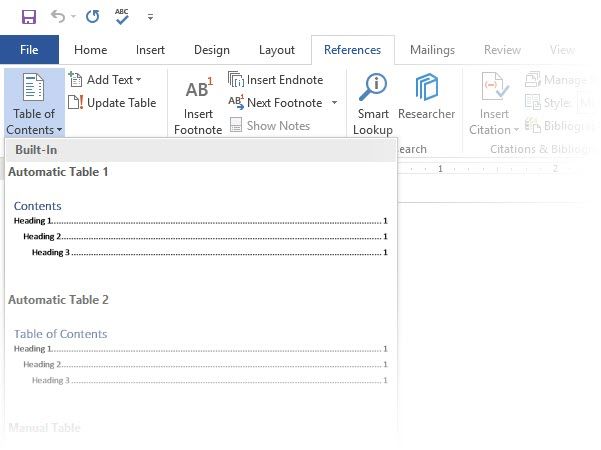
In Microsoft Word, you don’t have to write the entire TOC by hand. There’s a Table of Contents automatic tool under the References tab which takes your outline and designs it for you. Also, you can easily keep it updated when you want to change something.
There are also templates you can download and fit it around the nature of the content. For instance, a TOC for a thesis will look different from that of a company’s annual report.
We have a complete tutorial on how to create a table of contents page in Word.
The gist of it is this:
Create the outline and use heading styles to organize the hierarchy. Apply the automatic TOC tool to the heading styles. Word 2016 searches for those headings and then inserts the table of contents into your document. Then you can automatically update your TOC if you make changes in your document.
For more hands-on control, you can also use the Manual Table of Contents style. Word inserts placeholder text and you have to insert and format each content in the list.
3. Create Your Header and Footer
Headers and Footers are important in reports as the main purpose is to provide information about the report on every page. They are the common display areas for page numbers. The header of the document should contain the title of the report, and possibly the name of who created it. The title of the current section is helpful.
The footer, on the other hand, should include the page numbers, date of publication, and other administrative information that is required. Do note that some style guides have special guidelines for headers and footers.
Let’s start with the header in your document and give it a unique look.
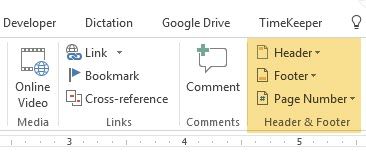
Select Insert, then select either Header or Footer from the group. The built-in gallery shows you several options you can choose from.
The header and footer space is inserted in your document with placeholder text or table. The Header & Footer Tools opens on the Ribbon for other formatting work like the date, time, or picture.
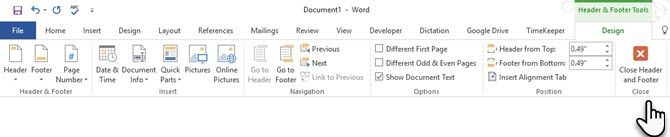
Enter your text and then select Close Header and Footer.
You can start with a blank header and footer. If you have the design skills, use the Header & Footer Tools to design your own. Master the header and footer space if you want to create custom letterheads for your organization. You can use brand elements like company or organization logos at the top and neatly formatted footnotes at the bottom
Let’s try with and modify one of the inbuilt headers. I selected Facet from the gallery.
The final look took two minutes to put together with simple text effects and an icon sourced from the Microsoft Office icon gallery.

The header and footer are in place. But, how do you know where you are in the document? Insert page numbers as the next important signpost.
4. Add Page Numbers
Page numbers look best in the footer (unlike in the header as in the image above). You can add a basic page number from the Insert > Page Number button on the Ribbon. You can also add it from the Design tab that appears when you add the header and the footer.
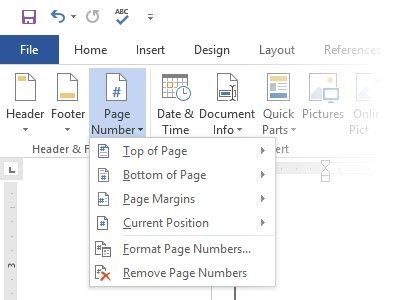
You have a lot of control over page numbers. Choose from a wide range of number formats and customize them to your needs. In this case, we are adding the number to the footer, but you can put them at the top or even at the margins. In this example, I have placed the page number at the bottom left. But, I would like to change the default look and the format.
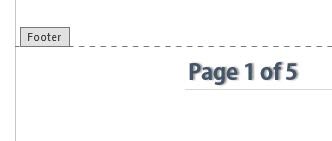
For example: Using a «Page X of XXX» makes for a better indicator on a long document.
Select the page number. Go to Insert > Quick Parts. From the drop-down menu, select Field. You can also reach the Field dialog from the Header and Footer Design tab.
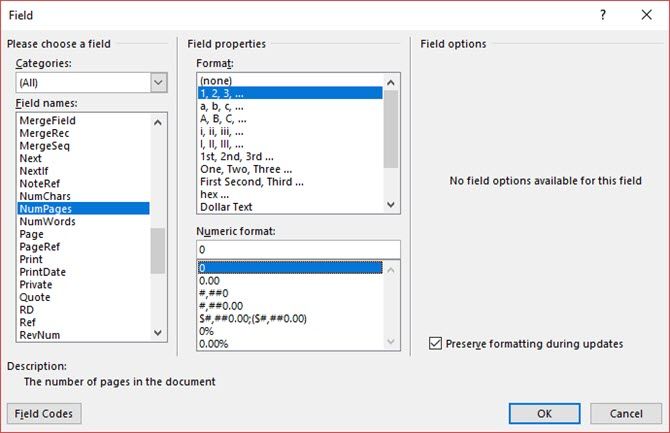
Choose NumPages from the long list of field names. From the box on the right, you can pick a specific format. I selected the usual 1, 2, 3. Click OK, and the number of the number of pages will appear. Now all you have to do is add your text such as Page X of XXX, and change the look of the numbers with the usual text formatting tools available from the Home tab.
It now looks like this:
Design the look on any page number in your document and Word updates all the remaining automatically. Page numbers are the most common elements in a footer, but it can also hold any other information like the header. From the options in the Insert group, you can add the date and time, document info, pictures, and more to your header or footer.
Next, we’re heading into formatting the content.
The visual draw of your professional report comes together with the «beautification» you apply to the content. Formatting is also an essential step for a document that flows well. So, you must focus a lot of energy on picking the right font, paragraph space, and the colors.
Don’t worry. Even, the artistically challenged will find this part easy because Microsoft Word comes packaged with default themes and visual styles. Let’s start with the most basic element of a document.
5. Pick and Style the Right Font
Your choice of font in a professional Word report not only determines how the text stands out but also how it is printed. You want both for maximum impact.
You can apply a typeface (i.e. the visual look of the font) to either an entire document or to specific parts of a document. All font choices are available from the Home tab. Go to Home > Font.
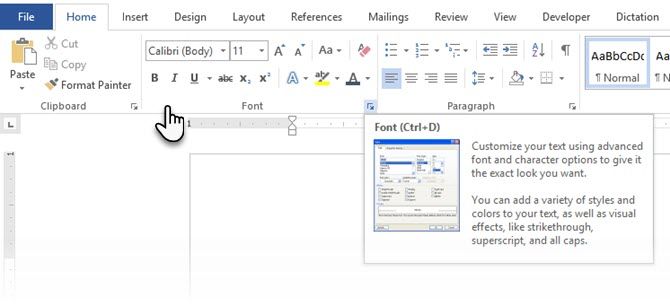
The default font in Microsoft Word 2016 is Calibri. Look beyond that as you have lots of others to choose from. If you choose Times New Roman, you may be considered lazy, if you choose Windings, well… I don’t think I need to explain that. So make sure you choose a font that is easy to read and suits the report. To play it safe, pick from one of these professional-looking Google fonts; they’re available for free.
Tip: Baskerville and Georgia are good alternatives to the over-used Times New Roman
Try different font pairing for the body text and Headings (and Subheadings). Several websites like FontJoy and TypeWolf will help you experiment with font pairings. You can download and use custom fonts too. But remember the thumb-rule — never use more than three different typefaces in a document.
For that extra bit of pizazz, try a drop cap to enhance your text.
6. Style the Paragraphs
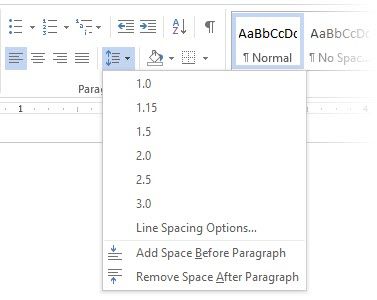
If you want to have your lines double spaced, or single spaced, you need to change the format of the paragraphs. By changing the spacing, you can make a document easier to read or give the impression that it is longer and that you have put more work into it.
To change the paragraph for the whole document, it is best that you select each block of text; otherwise, if you are using headers in your report, they will change too. Another better option is if you customize the particular style you are using to format the paragraph.
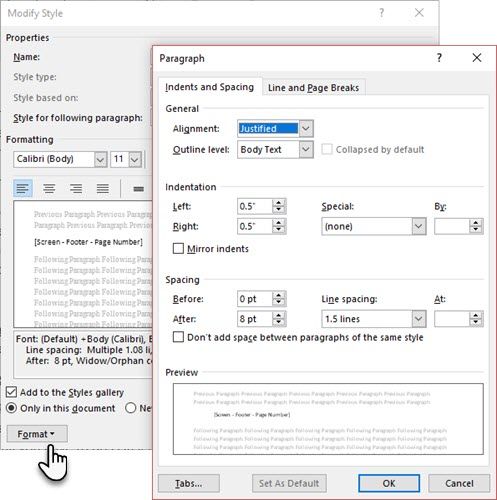
To do this, go to Home > Styles. Right click on the style you want to change and select Modify. Click on Format > Paragraph which is at the bottom of the dialog box. Now, change the spacing, indentation, and alignment for the paragraph. Click OK to close the dialogs.
When you want to change a smaller portion of the document, select what you want to change. Right click on the highlighted text and select Paragraph. The same dialog box as above will appear.
7. Control Page Breaks
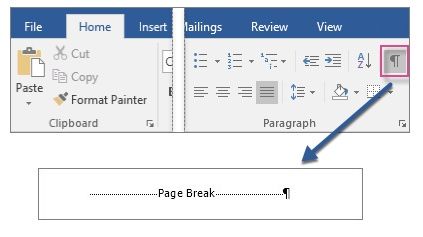
A page break — by its very name — splits a continuous block of text across two pages. Page breaks are important structural elements for long documents. Word automatically inserts a page break at the end of the page. But in a long document, you can place page breaks where you want them.
To insert a manual page break, click Insert > Page Break. (Keyboard shortcut: CTRL + Enter)
A page break looks like this when you click on the Show/Hide command in the Paragraph group.
But what if you want to keep a bunch of lines together on a page or column and not have them separate because of a page break? The layout is in your control. Click the tiny arrow you see in the bottom right of the Paragraph group.
In the Paragraph box, click Line and Page Breaks. Select from these four pagination options:
- Widow/Orphan control places at least two lines of a paragraph at the top or bottom of a page.
- Keep with next prevents breaks between paragraphs you want to stay together.
- Keep lines together prevents page breaks in the middle of paragraphs.
- Page break before adds a page break before a specific paragraph.
We’ve also shown how to remove page breaks when necessary.
8. Use Styles and Themes
Styles and themes are perhaps two of the more underused features in Microsoft Word. But I think you should use them at every opportunity to save a lot of time.
But what is the difference between a theme and a style? Microsoft says:
Themes provide a quick way to change the overall color and fonts. If you want to change text formatting quickly, Word Styles are the most effective tools.
So, as themes control the general look with color, effects, and fonts – start with a good theme for your document first. Then, use Styles to dig into the specific portions you want to change the appearance for.
For Themes: Go to the Design tab. Pick a theme from the gallery. You can see previews of what the color combination is like.
For Styles: Select the part of the text you want to change. Go to the Styles group on the Home tab. You can see previews of what they look like. Choose the Style that is suitable for your content. For instance, choose a heading style for the headings in your document. Or, a particular style for any quotes. You can also modify an existing style and create new styles from scratch.
9. Captions
Every picture, chart, or illustration needs a caption to clearly describe it. It is a single line of text, usually located below a graphic. Captions are also an important reference when you need to mention them in another place. Many documents omit this small detail.
It is easy to add a caption. Right-click the illustration you want to add a caption to. Select Add Caption.
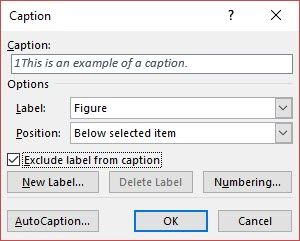
In the dialog box, add your caption text and configure the remaining options. Captions can be automatically referenced in Word.
10. Use Quick Parts
Professional documents can get repetitive. This is why you should start using Quick Parts for boilerplate content you reuse all the time. For instance, let’s say there is a contract clause you include with every document. Or, some introductory information. Instead of repeated copy-paste, save them as Quick Parts and re-use them again and again.
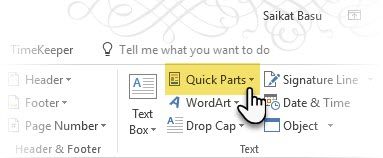
Quick Parts is also a type of building block. You can see the gallery of all reusable blocks of content in the Building Block Organizer.
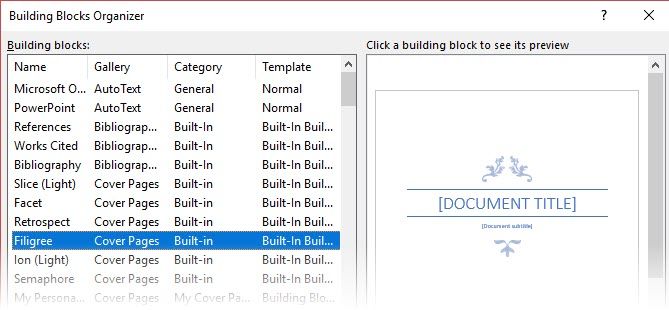
Save and reuse your own Quick Parts in two steps:
- Select the phrase, sentence, or other portion of your document that you want to save to the gallery.
- Go to Insert > Text group > Quick Parts > Save Selection to Quick Part Gallery. Change the name and add a description if you like. Click OK.
Just as easily, you can re-use the saved snippet of content.
Place your cursor where you want to insert a selection from the Quick Parts Gallery. Go to Insert > Text group > Quick Parts. Then click the sentence, phrase, or other saved selection you want to reuse.
You will notice three other categories in the Quick Parts menu.
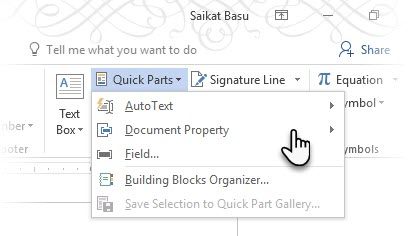
AutoText: Word 2016 has retained the old AutoText feature. It works like Quick Parts for any block of text that you use a great deal. Example: A note you want to use with every document.
Document Property: A set of constant properties that you can include with every document. Example: Company name or author.
Fields: These are predefined elements that update automatically. Example: Date, time, page numbers etc.
Remember, entries for document property can sometimes include information you wouldn’t want to share with everyone. So, keep a close eye on these fields and remove the hidden personal data whenever required.
11. Decorate With Page Borders
Page borders look good not only on flyers and invitations. If done right, they can add a touch of class to a document. A variety of line styles and widths and art borders are available from the Design menu on the Ribbon.
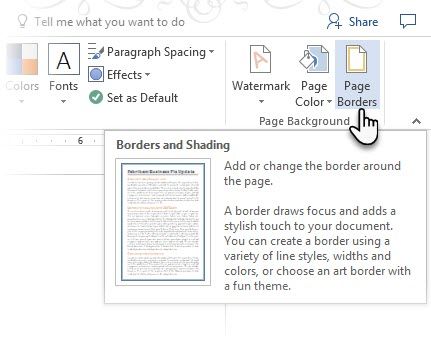
Go to Design > Page Borders.
In the Borders and Shading box, use the Page Border tab to design your border.
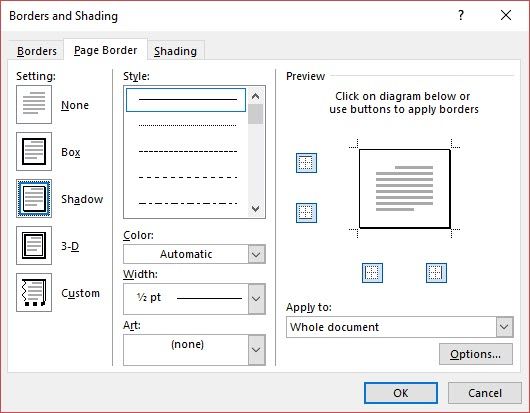
The settings are self-explanatory. Try Shadow or 3-D with the right colors to add a subtle but elegant border. The Art styles with their clip-art borders might be too garish for professional documents.
Use the four corner buttons in the Preview window to select the sides of the page to draw borders. Click these buttons to remove or add borders, as you wish.
Place the cursor on the first page of a document if you want to put a border around only the first page. You can also put borders around certain pages in a section. Place the cursor in the section — either in the first page of that section or in a subsequent page.
References and Collaboration
A Word report can seem like an unmanageable chore. It’s like organizing a million piles of hay into neat little stacks. The idea is to know precisely which stack has the pin you are looking for. These features are meant to make it easier.
1. Create an Index
When writing large documents such as a report that contains a lot of information, a contents page may not be enough. An Index should appear at the end of the document, with page numbers to keywords and information in the report. Create an index to help the reader reference the right information with just the page number.
Make an index if your document has more than 20 pages. Microsoft Word 2016 doesn’t let the process overwhelm you. It basically has two parts:
- Select the words or information you want to include in the index.
- Place the index at the right place in your document.
You can scroll through the finished document and mark the words or phrases you want to include in the index or mark them as you go along. Either way, select the text you’d like to use as an index entry or click where you want to insert the entry.
1. Click References > Mark Entry.
2. Edit the text in the Mark Index Entry dialog box. You can also add a sub-entry which further defines the main word you used in the index. You can add multiple levels and each appears indented under the main entry.
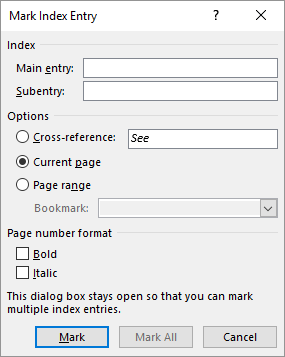
3. Under Options, you can also create a cross-reference to another main entry. A reader can use this to refer related information elsewhere in the same document.
4. Use the Page number format to decide on the appearance of the page numbers in the index.
5. Click Mark to mark the index entry. To mark this text everywhere it shows up in the document, click Mark All.
6. Repeat the process for all the words and phrases you want to include in the index.
You have now built your index. Insert it at the right place towards the end of the document.
1. Click on the page where you want to insert the index.
2. Click References > Insert Index.
3. The Index dialog box is displayed. Here you can choose to format the text entries, page numbers, tabs, and leader characters.
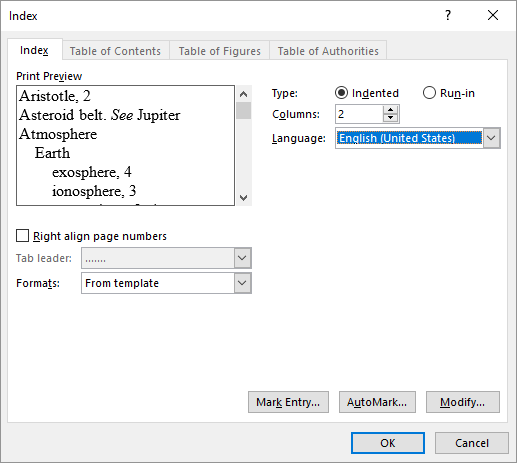
4. Choose the appearance from the different formats in the list and check the Preview window on the right. Remember, the Preview window doesn’t show you actual index. It is just a «simulation» of how it will look like.
5. Click OK. Your Index is now ready.
Sometimes, you may need to add more entries to the index after you have inserted it on the page. Mark the entry and go to References > Update index to include the new mentions.
Also, add a heading for the index because Word doesn’t do it automatically.
2. Creating Bibliographies
Your document is almost done. Now, you need to credit all the other research work and ideas which you have referenced in your document. It’s time for a bibliography.
A company report might not need a bibliography but an academic paper isn’t finished without one. The bibliography is one of the most painstaking jobs in an academic report. You need to have all your citations in order before you sit down to frame the bibliography. Also, decide on the citation style (typically MLA, APA, or Chicago-style) as per the guidelines of your subject.
Don’t hesitate to take advantage of third-party citation and bibliography generators for constructing this section.
But, Microsoft Word 2016 has a complete toolset to make this process as painless as possible. So, go to the point in the document where you would like to place the bibliography. It’s good if you have at least one citation to include, but even if you don’t, Word 2016 lets you use a placeholder citation and fill in the sources later.
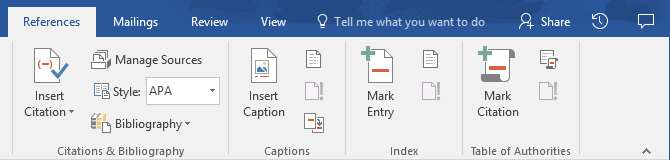
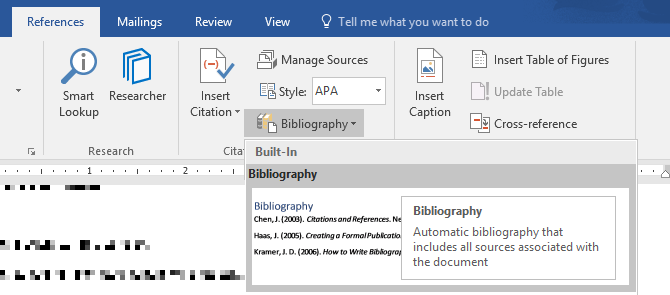
Click References > Bibliography.
Word offers a few bibliography styles that differ only in their heading names. Choose the appropriate style and then insert citations from the button in the Citations & Bibliography group.
The bibliography tool has a few steps to it. For the sake of brevity, I will direct you to the excellent Microsoft Office help page which is a step-by-step guide.
Some academic papers will ask you to create an annotated bibliography. It is a more fleshed out version of a bibliography with a list of citations to journals, books, articles, and other documents followed by a brief paragraph. The paragraph is a description of the source and how it supports your paper.
3. Cross-Referencing
You can use a cross-reference to help the reader navigate through a long document. At any point in a document, you can tell the reader to refer back to a heading, page number, image, chart, footnote, endnote, and paragraph. A cross-reference link is a neat way to connect related information together. The reader just has to click on the link to go that snippet of information.
Here’s how you begin:
1. Select the place for the cross-reference and type the text that tells the reader about it. For instance: «Refer to Chart 3 for future trends.»
2. Go to Insert > Cross-reference.
3. In the Reference type box, click the drop-down list to select what you want to link to.
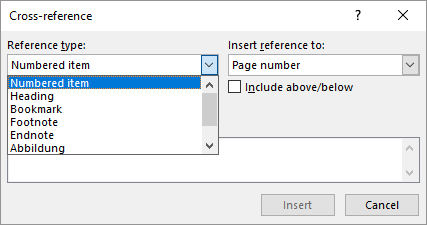
4. The options in the Insert Reference to drop-down will change according to your choice above.
5. In the For Which field, go through the choices and tell Word the exact information to link to.
6. Check the Insert as hyperlink box to create the hyperlink for the referenced information.
7. Click on Insert to include the cross-reference in the document.
Remember, our mention of captions? You can make cross-references to equations, figures, graphs, and tables if you used captions below them.
Word cannot create a cross-reference for something that does not exist. Word will let you know about these errors and also update the cross-references automatically when you change the page number or text of the referenced item.
A professional report can be a solitary job or you can take the help of a team to prepare the first draft. The humble Comment is one of the most underused tools of a Word document. It is displayed as a rectangular colored balloon in the margin or in the Reviewing Pane.
You can use comments as small «stickies» or self-notes. Leave little notes to yourself in the margins as you write, edit, and revise your way through a report or a manuscript. Be creative – add extra links to other resources, use them for tips and pointers, link to different parts of a document, or set up a feedback link for your readers. And when you finalize, you can easily remove all comments in Word.
Microsoft Word 2016 is also an enhanced collaborative writing tool. Comments play a huge role in communicating feedback across a team. Here’s how the comment system works…
1. Highlight the text you want to add a comment to or click at the end of a text block.
2. Go to Insert > Comment. Type your comment in the box. The comments appear in the markup area on the right. The Print Layout view is usually the best way to see the comments alongside the text.
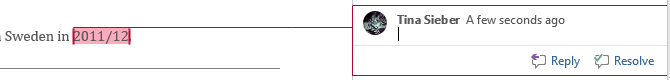
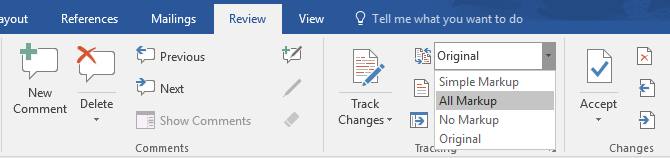
3. Go to the Review tab and see more options for comments. This tab also shows all the controls for tracking changes and comments in a collaborative document. Use the Markup options to display or hide the comments. For instance: No Markup will hide the comments and the markup area on the right.
Finalize Your Report
Once the bulk of your report is completed and saved, it is time to finalize your report. When I say finalize, I don’t mean proofread it. That should be done too. Now, you have to take the security measures to protect the report from unauthorized changes and plagiarism.
These security measures will give an extra level of authenticity to your electronic file before you share it.
This section will cover:
- Signatures
- Insert watermarks
- Make the document ‘read only’
- Password protect your document
- Print your document to PDF
1. Signatures
You can add text signature for a personal touch to the report. But a simple text signature does not need any authentication. A digital signature is the better way to protect your document from unauthorized access. A digital signature confirms that the document came from the signer and hasn’t been tampered in any way.
Let’s create a signature line in Microsoft Word 2016.
In the document, place your cursor where you want to create a signature line.
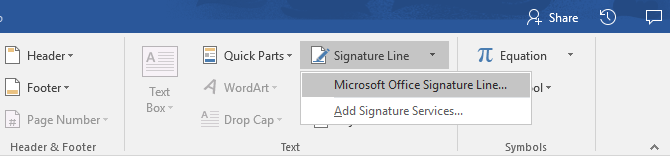
1. Go to Insert > Text group > Signature Line and click Microsoft Office Signature Line.
2. The Signature Setup dialog box is displayed. Fill the fields as indicated. If you are sending the document to someone else for signing, add instructions for the signer in the field reserved for it (Instructions to the signer). The signer can also add give the purpose for the signing if the Allow the signer to add comments in the Sign dialog box is checked.
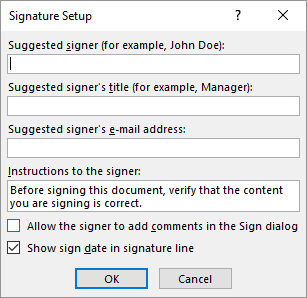
3. Click on OK and the document will now display a placeholder for the signature.

Enter a signature:
When you need to sign a document with a digital signature, go to the signature line and right-click on it.
You will be prompted to sign with a digital ID. If you don’t have one, Microsoft will tell you to get one from a signature service partner.
If you don’t have a digital ID, you can just insert a textual representation of a signature line. You can use a written signature or an image that doesn’t require authentication.
2. Insert Watermarks
A Microsoft Word watermark is a «fake» but still useful visual indicator for the status of the document. For instance, you can use a watermark that says «Drafts» to differentiate it from the final version of the document. Or, use the watermark to suggest the document is «Copyrighted» or «Confidential».
The «Draft» mark is the most common. But, Microsoft Word gives you several other watermarks to choose from.
1. Go to Design > Page Background and choose Watermark. The Watermark button will be enabled in the Print view only.
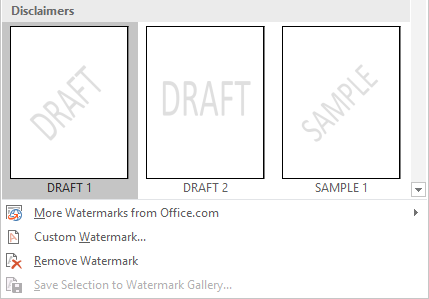
2. You can choose a picture or a text watermark from the gallery. Both horizontal and diagonal versions are available. The dialog box gives you all the customization options for the final look of the watermark. Try different fonts, layouts, sizes, and colors.
3. You can type your own text in the Text field to create your custom watermark.
4. Choose OK to apply the watermark to your document. Word automatically applies the watermark to every page except the title page.
3. Make Documents «Read Only»
A professional report by its nature should not need to be edited by its readers. Converting the document to a PDF is one way. But, you can also apply a few more restrictions in Microsoft Word and prevent accidental modification or omission of any kind.
There are three ways to protect a document.
First — Make your document «read only».
This ensures that your document can only be read or copied. It won’t prevent anyone from copying the file and making changes to the copy.
1. Go to the File tab > Info > Protect Document > Mark as Final.
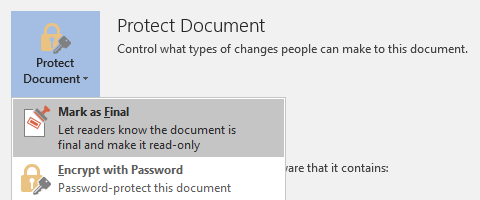
2. When readers open a document, a bar on top will prompt readers to treat this document as read only. But, they can click on «Edit Anyway» to open the document in Edit mode.
Second — Password Protect Your Document.
Protect your document from unwanted edits with a password barrier.
1. Under Protect Document, choose Encrypt with Password. Type a password and click OK.
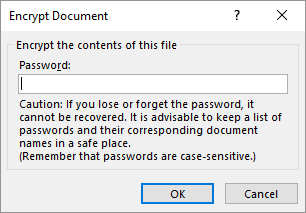
2. In the Confirm Password box, type the password again, and then click OK. The document will open with the reader prompted for a password.
Microsoft uses the AES (Advanced Encryption Standard), 128-bit key length, SHA1 (a cryptographic hashing algorithm which generates an almost unique 160-bit key to replace the plaintext), and CBC (cipher block chaining) to give a hacker a well-deserved headache.
Third — Restrict Editing.
This control feature helps you as the author decide which parts of the document others can edit and which will be locked out. Think of it as the bouncer who lets the VIPs in but otherwise bars the door for the common folk.
1. Go to Review > Restrict Editing.
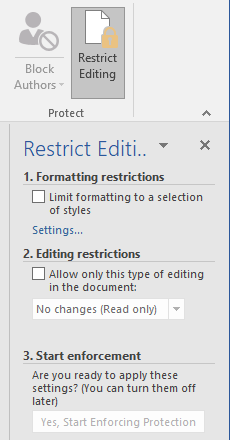
2. Under Editing restrictions, check Allow only this type of editing in the document, and make sure the list says No changes (Read only).
No changes (Read only) is the default restriction type. For a different restriction level for the document, click the menu and select from Tracked changes, Comments, or Filling in forms.
3. To free some sections from the editing blockade, select the sections for editing without restrictions. To select more than one area, click CTRL while selecting the area using the mouse.
4. You can check Everyone under Exceptions (optional) in the Restrict Editing panel. Or, click More users… and allow only specific users to modify the sections. The allowable areas will be marked with square brackets.
5. Click Yes, Start Enforcing Protection.
Now, type a unique password in the box that opens. You have to type it again to confirm it.
The password is optional. But it ensures that no one can just click Stop Protection and edit the document. If you are still paranoid, go ahead and encrypt your Microsoft Word document as we did in the second process above.
4. Print Your Report to PDF
The Portable Document Format comes with many advantages. Not least is its cross-platform compatibility across all computers. Your document is ready and now you need to share it or send it across to be printed. Many professional reports — for instance, a legal document — need to retain the format as intended.
Save or convert a copy to PDF. Microsoft Word 2016 does not need any third-party add-ins.
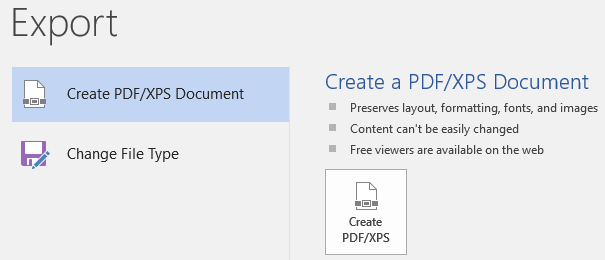
Go to File > Export > Create PDF/XPS.
Remember, your Word document may contain sensitive information that you do not want to be included in the PDF. Remove it before you publish to PDF. In the Publish as PDF or XPS window, choose Options. Then select Document and clear Document properties. Set any other options you want and choose OK.
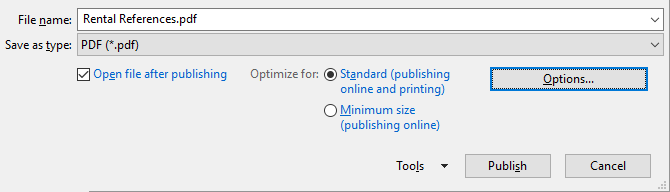
Browse to where you want to save the file and click on Publish.
The Next Step…
You are close to the finishing line. The report is ready to be handed over to your readers. But there’s one last job left.
Turn the pages and make sure (again) that your report is reader-friendly. Approach it with the eye of the reader. Have you organized your thoughts and written persuasively? Does the information flow well with the charts and illustrations? Can they skim through and find the information quickly? Is the text readable? Use the readability score to gauge the readability level of your documents as a final step.
You also might have noticed we didn’t cover some aspects of Microsoft Word. For instance, Microsoft Word Tables are an important tool for data display. Or, the power of lists in information management.
Microsoft Word is more than a quarter of a century old, and packed with little features. At MakeUseOf, we have covered every nook and cranny of this beast. So, do use our resources to learn more about this software for free. Each new feature of Microsoft Word learned will make your life easier.
Make Your Report Shine
As author Nathaniel Hawthorne said,
Easy reading is damn hard writing
Isn’t this true for professional report writing too? After all, if given a choice, no one may want to read it. Writing a business report and using it to communicate are two different things. Microsoft Word is just a tool — it’s your job to engage.
For some alternatives, check out the best online word processors. And for more help with professional writing, take a look at how to apologize in an email and mean it.
What are the best practices for writing professional business reports? Tell us in the comments.
Microsoft Word is one of the most popular word processing tools for creating reports and other documents. Whether you are a student, professional or anyone who does documentation works, proficiency in Microsoft Word is a skill that is necessary for today’s digital age. Microsoft Word software comes with a vast number of features to improve the productivity of your works and to produce accurate outputs. In this post, I will show you how to use some of these features to create professional reports with Microsoft Word.
When you write a Thesis, Dissertation, Project Report, and Technical Report, etc… Microsoft Word helps you to keep your content more organized, clear and structured. Microsoft Word comes with inbuilt options such as Source Manager for managing your citations, Track Changes, Document Outlines, etc… to make it easier to handle your documents and related resources.
If you closely observed any professional report created with Microsoft Word, you can identify there are several common features in every document. Those common features include Table of Contents, List of Tables, List of Figures, different levels of Heading Styles, Sections, Image and Table Captions, Index, Headers & Footers, Page Numbering, etc… Microsoft Word has specific ways of creating and generating those features. If you follow those methods correctly, you can create your report more easily and correctly.
In this series of tutorials, I will show you how to create Microsoft Word reports and make use of the inbuilt features correctly to make your report looks professional.
For better understanding, I have created a separate post for each key options that you will need to create reports and documents with Microsoft Word. I have listed out all the posts below, and it is not necessary to follow the same order. How ever, to use some options there are some prerequisites. I have added links to those prerequisites within the post itself.
First of all, let’s identify the main sections of a report.
Identify the main sections of a report
In a professional report, the appearance or look of the report as well as it’s flow is significant. So, you should first identify the main sections of the report. The sections given below are the most common in a professional report. (in this post I assume that you know the meaning of bellow terms)
- Cover Page
- Title Page
- Abstract
- Acknowledgement
- Table of Contents
- List of Figures
- List of Tables
- List of Acronyms
- Main Content/ Chapters
- References
- Appendixes
- Index
Creating these sections manually is not an easy task. However, if you practice the following Microsoft Word features, you can easily create the above sections.
The list of must-know features in Microsoft Word to create Professional Reports
Each feature below described in separate pages. You may click the post image or “read more” link to access these pages.
Insert Section Breaks

As the name suggests, section breaks used to break the document into separate sections. Sections allow you to handle its contents separately with the contents of other sections. Read More…
Create Numbered Multilevel Heading Styles

Numbered multilevel heading styles let you clearly distinguish the heading levels make the report easy to read & track. Correctly styled headings are used to generate… Read More…
Add Captions

It is a good practice to caption all the tables, images, maps, etc… added to your report. Caption helps you to refer to those objects precisely in your text. Read More…
Add Citations and Bibliography

Citation is “a word or piece of writing taken from a written work” [Cambridge Dictionary]. If you are obtaining information from another source, you must reference them. Read More…
Add Headers and Footers

Headers and footers are areas in the top or bottom of each page in a document. You can add title, page numbers, dates, or some graphics to every page in a document using headers and footers. Read More…
Add Page Numbers

Page numbers are generally added in the footer section of the document. Therefore the easiest way to add Page Numbers in Microsoft Word is to select a footer with page numbers when you are adding footers to the document. Read More…
Create a Table of Contents

Table of content help readers to easily navigate through your document. In this post, I will show you how easily you can create a table of contents in Microsoft Word. Read More…
Create List of Tables and Figures

When you add several tables and figures or any other objects in your report, it is a best practice to create a list of tables and figures or lists of other objects in the preface of the report. Read More…
Create an Index

An Index is a list of terms and topics that are discussed in a document. The terms and topics are listed along with the page numbers that they appear in the document. Read More…
Wrapping Up
The listed above are the essential features required to create professional reports with Microsoft Word. Here I have explained the basics of those features only. Once you get used to them, you can find more design and customization options inside those features. These features not only adding rich & professional looks to your documents, but they also help you to create and manage your report more easily and productively.
Do you need to make a professional annual report quickly? You can do it using a report design template Word doc.


A good template has an attractive annual report format already set. This makes your task of annual report creation easy.
Let’s look at how to make annual report designs quickly using a report design template Word doc. We’ll also take a look at some tips on how to make a good annual report design. So, let’s dig in and start designing.
How to Make Annual Report Designs
So, how do you make an annual report design? Well, you’ll need to decide which software you’d prefer to use. You’ll need to decide things like the best annual report format for your project too. Microsoft Word is one of many tools you can try. And there are plenty of annual report templates for Word.
New to Microsoft Word? Check out this free tutorial: Learn How to Use Microsoft Word (Beginner Tutorial Guide). It’s a great place to start!
Templates are a great solution because they give you a head start. You don’t have to begin with a blank canvas. An annual report template already has the basics established for you. Customize and edit it as much or as little as you want.


If you prefer to just insert your content in the annual report template, that’s fine. It’s a quick way to get your report done in a flash. Or, if you really want to change it up, use the template to jumpstart your design process. Turn it into something entirely new! The choice is yours.
Find the Perfect Annual Report Template Word Document
So, where do you find templates, especially if you want your annual report format in Word? Well, there’s a great collection of templates on Envato Elements. In fact, one low price gets you access to all of them, with unlimited downloads. That’s a great deal.


This means you can download as many annual report template Word documents as you like. Try out a few of them! They’re all included.
You also get a library of fonts, stock photos, illustrations, and more. Envato Elements comes with access to thousands of professional assets, all licensed for commercial use. It’s an awesome resource for creative professionals.
If you don’t necessarily need access to a library of files, consider GraphicRiver. Here, you can download only what you need. One download, one fee. It’s a great option for keeping things simple, but you still get the same level of professionalism.
How to Quickly Make Annual Reports in Microsoft Word Format With Templates
Now, let’s walk through how easy it to quickly create and customize an annual report in Microsoft Word using an annual report template. We’ll use this premium professional annual report template from Envato Elements:


You can download this tutorial and follow along if you like. Otherwise, these concepts are transferrable to any annual report template of your choice. We’ll hit the basic essentials to get you customizing your work right now.
Let’s begin!
1. Get Started With Your Document
You’ll need to navigate to your download. Your template may be compressed in a ZIP document. Uncompress this document and extract the files you need to your computer.
Depending on your template, you’ll be given a variety of different files.
Professional templates, like the one we’ll be using in this demonstration, usually have some sort of help guide or «readme» file. This will provide some insight as well as links to fonts that you’ll need for the document to display correctly. Install them before you open the files.
You may also have a variety of different file types. In our case we want to use the Word template. So, check out the template file in the DOCX format.


2. How to Navigate Through the Document
To open your document, go to File > Open. Navigate to the document on your computer and select it.
Navigating your document in Word is a simple process. Just scroll through the pages to see all the content within your document. The document we’re using has 20 pages worth of content with a large variety of different designs.


3. How to Duplicate and Manage Pages
To duplicate a page, you’ll need to create a new page. Make sure your cursor is placed at the top or bottom of a chosen page where you want to insert your new page. Then go to Insert > Blank Page.
Then copy the contents of another page and paste that into your new page to act as a template.
To delete an unwanted page, highlight the content of a page and click on the Delete button. Be careful with deleting page breaks.


4. How to Customize the Text
Customizing the text is also user friendly. As this is a Word document, in most cases, you can select the text with your cursor. Then edit as you would in most word processing software.
For our document you can change both the titles and paragraph text. Highlight the placeholder text and start typing your custom text. Your text will follow all the same formatting as the original text, including color font and size.


If your document includes a header, double click to access this content.
The great thing about adjusting header text is that the change appears on every page.
Our document even contains a page number that updates automatically. When you’re happy with your header, double click any area outside of your header to stop editing this part of your document.
You may come across some text that is inaccessible because it’s part of an image. Don’t worry. We’ll go over how to edit that too.
5. How to Change Colors
Changing colors of text is also a straight forward process. Highlight the text you want to change, then go to Home > Font Color. This is indicated by the icon with an A and a colored line under it. Once you click on the icon you get a palette of colors you can choose from.
You can also add your own colors to the palette by selecting More Colors.
It’s always a good idea to use a limited number of colors. Too many could be visually distracting.


6. How to Add Images
You may have noticed that there are some elements that you can’t easily edit. This may occur some templates. It’s usually because they’re images that have been imported. You can import your own images to replace them.
To remove an image, click to highlight and then press Delete.
To add an image, go to Insert > Picture. Then you can select Picture From File to select an image from your computer.
Once your image is inserted into the Word document you can place it anywhere you see fit. Remember to open up the Layout tab to control how your image appears. You can choose how text behaves and wraps around the image and even the order of how the images are layered.


7. How to Save Your Work
Once you’re happy with your report (or you’ve made some progress) you’ll likely want to save your work. You can do this by going to File > Save or File > Save As.
I suggest using Save As as this saves a new copy of the document. This way you keep a copy of the original template too.


From here, you can give your document a name. Place it in a folder where you can retrieve it later.
Annual Reports can be a big project, so I suggest saving many versions as you progress. You never know when you might need to revert to an older version.
8. How to Change Background Color


If you don’t like the background color of your annual report, you can easily change it.
Begin by clicking on the Design tab above the toolbar. Next, click on the Page Color button in the toolbar. When you click on this button, a color menu drops down.
9. How to Delete an Object


Sometimes you don’t like an object that is part of the design or in the way. To get rid of an object on your annual report template, select the object that you want to get rid of. Then, press Delete on your keyboard.
10. How to Change Object Color


If you want a new color scheme on your annual report Word template, change the color of the objects in your annual report Word template to match the color scheme.
Begin by selecting the object that you want to change the color of. When the object is selected, a Shape Format tab appears. Click on that tab.
Next, click on the Format Pane button in the toolbar. Clicking on this button opens a side panel in your window. Click on the Fill & Line tab on the Format Shape side panel.
In the Fill section of the panel, click on the Solid Fill option. When you click on this option, a Color field appears. Click on the button in that field. A color menu drops down. Choose the colors you want from the menu.
11. How to Add a New Text Box


To add more text to your annual report template you need to add a new text box. Click on the Insert tab. Next, click on the Text Box button in the toolbar. When you click on this button, a menu drops down.
Choose the right option for you from the drop-down menu. Next, click where you want the new text box to be and draw a diagonal line. Click inside the box and start typing your new text.
12. How to Save a File as a PDF


To email your annual report template, you’ll need to save it as a PDF file.
To save your annual report file as a PDF file, click File at the top of your screen. When you do, a menu drops down. Choose the Save As option. A window opens in the File Format field. Click on the PDF option to save your annual report as a PDF file.
Five Best Envato Elements Annual Report Design Template Word Documents
Take a look at some of the annual reports you can download right now on Envato Elements. Remember, they’re all included for one price, and you can customize them in Microsoft Word:
1. MS Word Report and Proposal (Annual Report Format in Word)


This stylish, multipage design has plenty of potential. Just open it up on Microsoft Word and add your content. Or customize the design to best suit your business needs.
2. Annual Report Template Word Design Document


If you’re looking for even more options, try out this design. It comes in two different sizes with plenty of different layouts to customize. Add your content to this template today.
3. Annual Report Design Template Word


Here’s another elegant design you could download today. It’s got 28 pages to choose from and includes a variety of file formats for your convenience.
4. Annual Report Word Design


Isn’t this design stylish? Download it today and easily edit the pages in Microsoft Word. This is just a sample of the 24 included pages. Change up the designs, color, and more.
5. Annual Corporate Report Template


Here’s another template with a lot of options. Customize the included 12 pages, duplicate them, and add your content. Includes a variety of file formats for your convenience and uses free fonts.
5 Quick Tips How to Make a Good Annual Report
We’ve just explored some ways how to make annual report designs quickly and easily with templates. But you might still wonder about how to make a good annual report work for you. What should it have? What do you need?
Check out these quick tips to help you create the perfect annual report:
1. Don’t Overwhelm the Reader
It can be tempting to put a lot of content on each page. But it’s wise to practice restraint. Too much content can be both overwhelming to read and overwhelming to look at. If you find yourself with a full page, consider breaking it up.
Empty space is just as important as your content. Think of it like breathing room for the eyes. This extra space can also help push the aesthetic of your design. Well balanced content that has both occupied and empty spaces can help make your work look more professional.


2. Make Sure All Text Is Clear and Legible
It’s essential that your text content is easy to read. For example, avoid the following pitfalls in your annual report format in Word:
- Don’t make your text too small. Even if it looks good, if it doesn’t read easily you’ve missed the point.
- Be careful about contrast. The text shouldn’t blend into the background. For example, light gray text on a white background is harder to read, especially at small sizes.
- Choose simple, clean fonts for paragraphs and body copy. You don’t want a busy, decorative fonts for long text. It can be very difficult to read.
If you aren’t sure, ask a friend or colleague to give your text a test read. Also remember, some may have more difficulty reading smaller sizes than others. Font legibility will also greatly vary depending on the font.
3. Keep Your Design Consistent
Your annual report format should exhibit consistency from page to page. Think about it: this is one, continuous presentation. It should look that way as you browse through it. If the design is jarringly different from page to page, it’ll feel really disjointed.
You can establish consistency in many different ways. For example, you could have a repeating header. You could have key colors that you keep consistent throughout.
The example below is a collection of some annual report format pages in Word. Notice how, while they vary, they share key elements in common.


4. But Don’t Let Things Get Boring Either
The same page layout, over and over again, would be visually boring. In fact, it might even be easier to get lost in the presentation. So, while consistency is good, it’s just like variety: you need to find a balance.


Above is an example annual report format in Word. Again, note how each page has some common elements:
- They use the same fonts.
- They share the same color scheme.
- But the layouts themselves mix things up.
You can also use different images. These pages basically have a theme, but they aren’t clones of each other. This keeps them looking related without being repetitive.
5. Consider Your File Formats
So, what annual report format is right for your project? Sharing your work as a Word document might not be the most effective way to do so. This would mean the viewer would have to have Microsoft Word installed. Also, you might put yourself in a position where your work is easily editable. This isn’t necessarily bad, but it might not be what you want.
Here are some questions to think about:
- Will you print your annual report?
- Will you offer it online?
Microsoft Word exports as PDF, so this can be a great option to explore.
Learn More About How to Make Annual Report Designs
There’s plenty more to learn about annual report design and Microsoft Word. Check out these free tutorials from Envato Tuts+. There are a great way to get start, keep learning, and do it all for free.
Check Out More Annual Report Templates
Looking for even more annual report design templates? Here are some inspiring collections to view today. There’s plenty of design inspiration and even more downloads you can check out.
Customize Your Annual Report Template in Word Today
Microsoft Word can be a great choice for your annual report format. Using a template can really help speed up the process too. There’s no better time to dig in and start designing, so why not begin your annual report design today?
Remember, if you’re looking for templates, you can find the perfect annual report format in Word over on Envato Elements. There’s so many files to choose from, and one fee gets you access to all of them. With unlimited downloads, you can grab as many as you’d like to try.
Or, if you prefer single downloads, remember to check out the annual report templates on GraphicRiver. There’s plenty more design inspiration over there to see too.
Good luck with your annual report, and happy designing!
Update: This post has been updated with help for Sarah Joy.
You can create a variety of different reports in Access, ranging from the simple to the complex. Begin by thinking about your report’s record source. Whether your report is a simple listing of records or a grouped summary of sales by region, you must first determine which fields contain the data you want to see in your report, and in which tables or queries they reside.
After you choose your record source, you will usually find it is easiest to create your report by using the Report Wizard. The Report Wizard is a feature in Access that guides you through a series of questions and then generates a report based on your answers.
What do you want to do?
-
Choose a record source
-
Create a report by using the Report tool
-
Create a report by using the Report Wizard
-
Create labels by using the Label Wizard
-
Create a report by using the Blank Report tool
-
Understand the report sections
-
Understand controls
-
Fine-tune your report in Layout view
-
Fine-tune your report in Design view
-
Add controls to the report
-
Save your work
-
View, print, or send your report as an e-mail message
-
View your report
-
Print your report
-
Send your report as an e-mail message
Choose a record source
A report consists of information that is pulled from tables or queries, as well as information that is stored with the report design, such as labels, headings, and graphics. The tables or queries that provide the underlying data are also known as the report’s record source. If the fields that you want to include all exist in a single table, use that table as the record source. If the fields are contained in more than one table, you need to use one or more queries as the record source. Those queries may already exist in your database, or you may need to create new queries specifically to fit the needs of your report.
Create a report by using the Report tool
The Report tool provides the fastest way for you to create a report, because it generates a report immediately without prompting you for information. The report displays all the fields from the underlying table or query. The Report tool may not create the final, polished product that you ultimately want, but it is quite useful as a means to quickly look at the underlying data. You can then save the report and modify it in Layout view or Design view so that it better serves your purposes.
-
In the Navigation Pane, click the table or query on which you want to base the report.
-
On the Create tab, in the Reports group, click Report.
Access builds the report and displays it in Layout view.
-
For more about viewing and printing your report, see the section View, print, or send your report as an e-mail message.
After viewing the report, you can save it and then close both the report and the underlying table or query that you used as a record source. The next time that you open the report, Access will display the most recent data from your record source.
Create a report by using the Report Wizard
You can use the Report Wizard to be more selective about what fields appear on your report. You can also specify how the data is grouped and sorted, and you can use fields from more than one table or query, provided you have specified the relationships between the tables and queries beforehand.
-
On the Create tab, in the Reports group, click Report Wizard.
-
Follow the directions on the Report Wizard pages. On the last page, click Finish.
When you preview the report, you see the report as it will appear in print. You can also increase the magnification to zoom in on details. For more about viewing and printing your report, see the section View, print, or send your report as an e-mail message.
Note: If you want to include fields from multiple tables and queries in your report, do not click Next or Finish after you select the fields from the first table or query on the first page of the Report Wizard. Instead, repeat the steps to select a table or query, and click any additional fields that you want to include in the report. Then, click Next or Finish to continue.
Create labels by using the Label Wizard
Use the Label Wizard to easily create labels for a wide variety of standard label sizes.
-
In the Navigation Pane, open the table or query that will be the record source for your labels by double-clicking it.
-
On the Create tab, in the Reports group, click Labels.
-
Follow the directions on the pages of the Label Wizard. On the last page, click Finish.
Access displays your labels in Print Preview so that you can see them as they will appear when they are printed. You can use the slider control on the Access status bar to zoom in on details. For more information about viewing and printing your report, see the section View, print, or send your report as an e-mail message.
Note: Print Preview is the only view you can use to see multiple columns — the other views show the data in a single column.
Create a report by using the Blank Report tool
If you aren’t interested in using the Report tool or the Report Wizard, you can use the Blank Report tool to build a report from scratch. This can be a very quick way to build a report, especially if you plan to put only a few fields on your report. The following procedure explains how to use the Blank Report tool:
-
On the Create tab, in the Reports group, click Blank Report.
A blank report is displayed in Layout view, and the Field List pane is displayed on the right side of the Access window.
-
In the Field List pane, click the plus sign next to the table or tables containing the fields that you want to see on the report.
-
Drag each field onto the report one at a time, or hold down CTRL and select several fields, and then drag them onto the report at the same time.
-
Use the tools in the Header/Footer group on the Design tab to add a logo, title, page numbers, or the date and time to the report.
Understand the report sections
In Access, the design of a report is divided into sections. You can view your report in Design view to see its sections. To create useful reports, you need to understand how each section works. For example, the section in which you choose to place a calculated control determines how Access calculates the results. The following list is a summary of the section types and their uses:
-
Report Header This section is printed just once, at the beginning of the report. Use the report header for information that might normally appear on a cover page, such as a logo, a title, or a date. When you place a calculated control that uses the Sum aggregate function in the report header, the sum calculated is for the entire report. The report header is printed before the page header.
-
Page Header This section is printed at the top of every page. For example, use a page header to repeat the report title on every page.
-
Group Header This section is printed at the beginning of each new group of records. Use the group header to print the group name. For example, in a report that is grouped by product, use the group header to print the product name. When you place a calculated control that uses the Sum aggregate function in the group header, the sum is for the current group.
-
Detail This section is printed once for every row in the record source. This is where you place the controls that make up the main body of the report.
-
Group Footer This section is printed at the end of each group of records. Use a group footer to print summary information for a group.
-
Page Footer This section is printed at the end of every page. Use a page footer to print page numbers or per-page information.
-
Report Footer This section is printed just once, at the end of the report. Use the report footer to print report totals or other summary information for the entire report.
Note: In Design view, the report footer appears below the page footer. However, when the report is printed or previewed, the report footer appears above the page footer, just after the last group footer or detail line on the final page.
Top of Page
Understand controls
Controls are objects that display data, perform actions, and let you view and work with information that enhances the user interface, such as labels and images. Access supports three types of controls: bound, unbound, and calculated:
-
Bound control A control whose source of data is a field in a table or query is a bound control. You use bound controls to display values from fields in your database. The values can be text, dates, numbers, Yes/No values, pictures, or graphs. A text box is the most common type of bound control. For example, a text box on a form that displays an employee’s last name might get this information from the Last Name field in the Employees table.
-
Unbound control A control that doesn’t have a source of data (a field or expression) is an unbound control. You use unbound controls to display information, lines, rectangles, and pictures. For example, a label that displays the title of a report is an unbound control.
-
Calculated control A control whose source of data is an expression rather than a field is a calculated control. You specify the value that you want in the control by defining an expression as the source of data for the control. An expression is a combination of operators (such as = and + ), control names, field names, functions that return a single value, and constant values. For example, the following expression calculates the price of an item with a 25 percent discount by multiplying the value in the Unit Price field by a constant value (0.75).
= [Unit Price] * 0.75
An expression can use data from a field in the report’s underlying table or query, or from a control in the report.
When you create a report, it is probably most efficient to add and arrange all the bound controls first, especially if they make up the majority of the controls on the report. You can then add the unbound and calculated controls that complete the design by using the tools in the Controls group on the Design tab.
You bind a control to a field by identifying the field from which the control gets its data. You can create a control that is bound to the selected field by dragging the field from the Field List pane to the report. The Field List pane displays the fields of the report’s underlying table or query. To display the Field List pane, on the Design tab, in the Controls group, click Add Existing Field.
Alternatively, you can bind a field to a control by typing the field name in the control itself or in the box for the ControlSource value in the control’s property sheet. The property sheet defines the characteristics of the control, such as its name, the source of its data, and its format.
Using the Field List pane is the best way to create a control for two reasons:
-
A bound control has an attached label, and the label takes the name of the field (or the caption defined for that field in the underlying table or query) as its caption by default, so you don’t have to type the caption yourself.
-
A bound control inherits many of the same settings as the field in the underlying table or query (such as for the Format, DecimalPlaces, and InputMask properties). Therefore, you can be sure that these properties for the field remain the same whenever you create a control that is bound to that field.
If you already created an unbound control and want to bind it to a field, set the control’s ControlSource property to the name of the field. For details about the ControlSource property, search Help for «ControlSource.»
Top of Page
Fine-tune your report in Layout view
After you create a report, you can easily fine-tune its design by working in Layout view. Using the actual report data as your guide, you can adjust the column widths, rearrange the columns, and add grouping levels and totals. You can place new fields on the report design and set the properties for the report and its controls.
To switch to Layout view, right-click the report name in the Navigation Pane and then click Layout View.
Access shows the report in Layout view.
You can use the property sheet to modify the properties for the report and its controls and sections. To display the property sheet, press F4.
You can use the Field List pane to add fields from the underlying table or query to your report design. To display the Field List pane, do one of the following:
-
On the Design tab, in the Tools group, click Add Existing Fields.
-
Press ALT+F8.
You can then add fields by dragging them from the Field List pane to the report.
Top of Page
Fine-tune your report in Design view
You can also fine-tune your report’s design by working in Design view. You can add new controls and fields to the report by adding them to the design grid. The property sheet gives you access to a large number of properties that you can set to customize your report.
To switch to Design view, right-click the report name in the Navigation Pane and then click Design View.
Access shows the report in Design view.
You can use the property sheet to modify the properties for the report itself and the controls and sections it contains. To display the property sheet, press F4.
You can use the Field List pane to add fields from the underlying table or query to your report design. To display the Field List pane, do one of the following:
-
On the Format tab, in the Controls group, click Add Existing Fields.
-
Press ALT+F8.
You can then add fields by dragging them from the Field List pane to the report.
Top of Page
Add fields from the Field List pane
-
To add a single field, drag the field from the Field List pane to the section where you want it displayed on the report.
-
To add several fields at once, hold down CTRL and click the fields that you want. Then, drag the selected fields onto the report.
When you drop the fields onto a report section, Access creates a bound text box control for each field and automatically places a label control beside each field.
Top of Page
Add controls to the report
Some controls are created automatically, such as the bound text box control that is created when you add a field from the Field List pane to your report. Many other controls can be created in Design view by using the tools in the Controls group on the Design tab.
Determine the name of a tool
-
Place the mouse pointer over the tool.
Access displays the name of the tool.
Create a control by using the tools in the Controls group
-
Click the tool for the type of control that you want to add. For example, to create a check box, click the Check Box
 tool.
tool. -
Click in the report design grid where you want to position the upper-left corner of the control. Click once to create a default-sized control, or click the tool and then drag in the report design grid to create a control of the size that you want.
-
If you don’t position the control perfectly on the first try, you can move it by using the following procedure:
-
Click the control to select it.
-
Position the mouse pointer over the edge of the control until the pointer turns into a four-headed arrow
. -
Drag the control to the location that you want.
-
 tool.
tool. .
.This procedure creates an «unbound» control. If the control is the type that can display data (a text box or check box, for example), you need to enter a field name or expression in the ControlSource property for the control before it will display any data. See the Understand controls section in this topic for more information.
Display the property sheet
To display the property sheet in Design view, do one of the following:
-
On the Design tab, in the Tools group, click Property Sheet.
-
Press F4.
Top of Page
Save your work
After you save your report design, you can run the report as often as you need to. The report’s design stays the same, but you get current data every time you print or view the report. If your reporting needs change, you can modify the report design or create a new, similar report based on the original.
Save your report design
-
Click File > Save or press CTRL + S.
Alternatively, click Save on the Quick Access Toolbar.
-
If the report is untitled, type a name in the Report Name box, and then click OK.
Save your report design under a new name
-
If you’re using Access 2013 or higher, click File > Save As > Save Object As.
If you’re using Access 2010, click File > Save Object As.
-
In the Save As dialog box, type a name in the Save Report to box for the new report and then click OK.
Top of Page
View, print, or send your report as an e-mail message
After you save your report design, you can use it over and over again. The report’s design stays the same, but you get current data every time you view or print the report. If your reporting needs change, you can modify the report design or create a new, similar report based on the original.
View your report
There are several ways to view your report. Which method you choose depends on what you want to do with the report and its data:
-
If you want to make temporary changes to which data appears on the report before you print it, or if you want to copy data from the report to the clipboard, use Report view.
-
If you want to be able to change the design of the report while looking at the data, use Layout view.
-
If you simply want to see what the report will look like when it is printed, use Print Preview.
Note: If your report is formatted with multiple columns, you can only see the column layout in Print Preview. Layout view and Report view display the report as a single column.
View your report in Report view
Report view is the default view that is used when you double-click a report in the Navigation Pane. If the report is not open, double-click the report in the Navigation Pane to see it in Report view.
If the report is already open, right-click the report name in the Navigation Pane and then click Report View.
Work with your data in Report view
In Report view, you can select text and copy it to the clipboard. To select entire rows, click and drag in the margin next to the rows that you want to select. You can then copy these rows to the clipboard by doing one of the following:
-
On the Home tab, in the Clipboard group, click Copy.
-
Right-click the selected rows and then click Copy.
-
Use the keyboard shortcut — Press CTRL+C.
Show only the rows you want by using filters
You can apply filters directly to your report without leaving Report view. For example, if you have a «Country/region» column and you want to see only those rows where the country/region is «Canada», do the following:
-
Find the word «Canada» in the report and right-click it.
-
Click Equals «Canada».
Access creates and applies the filter.
Toggle a filter on and off
You can switch between a filtered and non-filtered display by clicking Toggle Filter in the Sort & Filter group of the Home tab. This does not remove the filter — it just turns it on and off.
Remove a filter
-
Right-click the field from which you want to remove the filter.
-
Click Clear Filter from fieldname. (Your actual field is listed for fieldname.)
Once a filter has been removed, you cannot switch it back on by using the Toggle Filter command. You must first re-create the filter.
Note: If you apply a filter to a report and then save and close the report, the filter will be saved. However, the next time you open the report, Access will not apply the filter. To reapply the filter, on the Home tab, in the Sort & Filter group, click Toggle Filter.
Preview your report by using Print Preview
Right-click the report in the Navigation Pane, and then click Print Preview on the shortcut menu.
You can use the navigation buttons to view the pages of a report sequentially or to jump to any page in the report.
1. Click to display the first page.
2. Click to display the previous page.
3. Click to display the next page.
4. Click to display the last page.
5. Type a page number in this box and then press ENTER to jump to a specific page.
In Print Preview, you can zoom in to see details or zoom out to see how well the data is positioned on the page. With the cursor positioned over the report, click once. To reverse the effect of the zoom, click again. You can also use the zoom control on the Access status bar to zoom further in or out.
To close Print Preview, do one of the following:
-
On the Print Preview tab, click Close Print Preview.
-
Right-click the report in the Navigation Pane and then click Layout View or Design View on the shortcut menu.
Tip: After previewing your report, you can export the results to Microsoft Word, Microsoft Excel, or several other Office programs. On the External Data tab, in the Export group, click the button for the format that you want and follow the instructions.
Top of Page
Print your report
You can print a report while it is open in any view, or even while it is closed. Before you print, be sure to double-check the page settings, such as the margins or page orientation. Access saves the page settings with the report, so you need to set them only once. You can set them again later, if your printing needs change.
Change the page settings
-
Open the report in Print Preview. You can change page settings in any view, but Print Preview is best because you can see the effects of any changes immediately.
-
On the Print Preview tab, in the Page Layout and Page Size groups, click Portrait
or Landscape to set the page orientation, Size to set the paper size, Margins to adjust the margins, and so on. -
After you make a change, use the navigation buttons to view several pages to ensure that you haven’t created any formatting problems on later pages.
 or Landscape
  to set the page orientation, Size
  to set the paper size, Margins
  to adjust the margins, and so on.
Send your report to a printer
-
Open the report in any view, or select the report in the Navigation Pane.
-
Click File > Print > Print.
Access displays the Print dialog box.
-
Enter your choices for options such as printer, print range, and number of copies.
-
Click OK.
Top of Page
Send your report as an e-mail message
You can send your report to recipients as an e-mail message instead of printing a paper copy:
-
In the Navigation Pane, click the report to select it. On the External Data tab, in the Export group, click Email.
-
In the Send Object As dialog box, in the Select Output Format list, click the file format that you want to use.
-
Complete any remaining dialog boxes.
-
In your e-mail application, type the message details and send the message.
Top of Page
i financial report image by Christopher Hall from Fotolia.com
Writing a report in Microsoft Word can be done by using the available report templates. These templates have the complete report layout, so you can just add your content and adjust the template text. Once the adjustments are made, your report is personalized to your needs. Select the report template that fits your reporting style. Save the report when you are done so the report can be modified or retrieved at a later date.
Open Word 2010 and select the «File» tab. Select «New.» Select «Reports» from the left category task pane. Select one of the report sub-categories. For example, if you are doing an academic report, select this sub-category. Download the report template by clicking the «Download» icon in the right pane.
Highlight the default title text in the report and type your report name and details. Highlight additional default text and type your report information.
Change the report images by right clicking the image and selecting «Change Picture.» Search your computer for the image you want to use. Click the image and select the «Open» button. Your image replaces the default image.
Save your change by clicking the «Save» icon on the Quick Access Toolbar.
References
Writer Bio
Emmanuelle Douglas has been an avid writer since 1990. Her first professional writing assignment was for «Oscar News,» a local corporate Intranet website. She holds a Bachelor of Science in mathematical sciences from Clemson University.
Report Templates
There are certain situations wherein one must be able to gather information on particular subjects. This can be anything from an event that took place to even an incident that people have managed to witness. You can also like report templates.

Table of Content
- Elements of a Report
- 10+ Report Templates in Word
- How to Make a Report in Word
- Types of Reports
Those who are in charge of collecting the information and showing it to the right people will need to be able to come up with a report. This article is going to teach you all that you need to know in order for you to be able to come up with one.
Elements of a Report
Should you be the person that is in charge of coming up with a report, then the firs thing that you are going to have to do is to learn about the basic elements. These are required in order for the report you make to fulfill its purpose: Provide people with information about a particular subject matter.
So knowing that here are the basic elements that just about every report is going to need:
1. Title: Before anything else, you must be able to come up with a title for the report. Having it ensures that the people who go through it will know exactly what the document is for. Whatever title you come up with has to be related to the report’s purpose. For example, let’s say that you have to make a report on the research you have done on a particular market. You will want to go with a title such as “Market Research Report” or anything else that’s similar.
2. Basic Information: Those who are in charge of making the report must provide basic information about themselves into the document. Those who will be tasked in collecting reports will always want to know who is responsible for their creation. So if you’re the person that has to make one, always put in your complete name. Other than that, you will have to provide other information such as the department that you are from and your job title.
3. Date: It is very important that you do not forget to include the date in which you made the report. This will give those who read it an idea as to when something happened or help them check if you were able to come up with the report on the day that you were supposed to.
4. Subject Details: Every report will have a particular subject that needs to be focused. What these are will depend entirely on the type of report that you have to make. This also means that the information you place in the document will depend on the type as well. So let’s say that you have to come up with a financial report for your company. This means that the document must contain information such as net assets, net liabilities, etc.
10+ Report Templates in Word
Incident Report Template

Project Management Report

Project Progress Report

Annual Business Report

Business Trip Report

Employee Incident Report

Market Research Report

Annual Sales Report

Company Report Template

Church Report Template

How to Make a Report in Word
Now that you know the basic elements of a report, the next thing that you are going to have to learn would be how you should go about in making one. Remember that the entire point of coming up with a report is so that you can professionally present information about a particular subject matter to someone who needs it. The only way you can do that is if you know exactly how to make it.
So knowing that, here are the steps that will allow you to come up with any report in Word:
1. Install and Open a Word Program: Before you can even begin making a report in Word, you are definitely going to need a Word program. Take note that there are many different types of programs that allow you to make a report in Word format, but the one we will be focusing on is Microsoft Word. This is because it is fairly easy to use, quick to learn, and it has been generally been accepted by everyone as the standard for creating just about any type of Word document.
So once you have it installed or if you already have it, then be sure to do the following:
- Open up Microsoft Word.
- Click on the “File” tab and select “New”.
- Choose if you want to start from a blank document or if you would like to make use of a template.
- If you chose to go with a template, then go through the list of available ones that you can use or download a template that you can open with Microsoft Word.
As you can see, the process is fairly quick and easy. You can also use the same process to help you come up with other types of documents as well.
2. Come Up With the Report: Again, you can always choose to start making one from scratch or use a template. Using a template is much easier as all you will have to do is to fill out the blanks and replace the dummy information. However, should you decide to make one on your own, then you must ensure that it has all of the information you need. So be sure to do the following:
- Define the purpose of the report: The only way to make sure that you know what you should put inside of the report is to know what its purpose should be. Not only will it help you do that, but it will also aid you in coming up with an appropriate title.
- Know who you should give it to: You may be required to provide the name of the person to whom you are making the report for. Make sure to get all of the information such as that person’s name and job title so that you can place it properly into the report.
- Provide all of the necessary information: Again, this will depend entirely on the type of report that you are making. So let’s say that you’re making a report about an accident that occurred. This means that not only will you have to point out what kind of accident it was, but you also need to share other details such as where it happened, when it happened, who was involved, etc.
Tips for Making a Report
- Always check the information you’ve put into it: You do not want to hand over a report that is full of inconsistencies and inaccurate information. So what you are going to have to do is to check all of your sources to confirm that all of the information that you have managed to gather is accurate. Also, doing this can also help guarantee that you are able to acquire all of the details that the report is going to need.
- Always proofread and edit your report: Before you finalize your report and hand it over to the people that need it, it’s best that you make sure that there are no grammatical or spelling errors. The best way to avoid them is by going through the report thoroughly so that you can proofread and edit anything that you need to. Best that you go through the report at least twice so that you don’t miss out on anything that you will need to correct.
Types of Reports
Now that you know what should be in a report and how to make one, next is to learn about the different types. Different types of reports mean that they have their own purposes. Knowing what they are should tell you what you should make that fits the situation. So knowing that, here are a few examples.
- Business Trip Report
- Employee Incident Report
- Market Research Report
- Management Report
- Annual Sales Report
- Assessment Report
- Company Report
Should you wish to learn more about the types you can make, or if you want to learn about the other documents that you can create, then you simply need to go through our site until you are able to get all of the information that you need.
Report FAQs
Is Word the best way to make a report?
When it comes to making any type of report, Word is the standard format. This is because it’s easier to make it in Word and the fact that the format has generally been accepted as the standard for just about any document. Just know that you can also choose to make it in other formats such as PDF, but it’s always best to stick with Word.
How can I easily make one?
Again, the easiest way to make a report is by making use of a template. All you have to do is to install a Word program, use it to open the template, and then make whatever changes or additions that you want. If you like, you can make use of the templates that are available in this article.
Making a report may not be difficult, but it’s certainly something that you are going to have to do when the time is needed. So make sure to make the most out of the information in this article to help you prepare an effective report.
More in Report Templates
| 50+ Incident Report Templates — PDF, Docs, Apple Pages | 13+ Book Report Templates |
| 77+ Daily Report Templates — Word, PDF, Excel, Google Docs | 44+ Business Report Templates — Google Docs, Apple Pages, MS Word, PDF |
| 30+ Sales Report Templates — PDF, Excel, Word | 32+ Monthly Sales Report Templates — Word, PDF, Google Docs, Apple Pages |
| 31+ Expense Report Templates — PDF, Word | Weekly Status Report Templates — 30+ Free Word Documents Download- MS Word, Apple Pages |
| Annual Report Template — 57+ Free Word, Excel, PDF, PPT, PSD | Own Executive Report Template |
| 23+ Business Report Templates- PDF, Word, Pages | Management Report Template — 35+ Word, PDF, Apple Pages, Google Docs |
Introduction
If writing a report is not something you do every day, it might be a bit daunting. How should you structure it? What should be included? There are some basics you should be aware of when it comes to creating a professional report. This includes adding a table of contents to your report, adding page numbers and properly referencing all of your sources. Let me show you how to do this effectively in Word 2013.
Introduction to the report
Here is a report that a colleague of mine has written. Even though it looks ok, he hasn’t used Word effectively. He has just applied formatting to the headings, without using any heading styles. Because of this Word has no idea about the structure of this document and it’s very hard to navigate. If I go to the “VIEW” tab and open up the “Navigation Pane” you will see that it is completely empty.
If I go to the “REFERENCES” tab and try to insert a table of contents, I get a message informing me that styles need to be applied, otherwise no entries for the table of contents can be found. I’ll click Undo to remove the table of contents holder.
How to apply heading styles in Word 2013?
The first thing I’ll do is to add heading styles to the document. To add heading styles, mark the heading you want to apply the style to, I’ll start with the title. On the “HOME” tab, right-click the style you want to apply and select “Update Title to Match Selection”.
This way the title keeps the current formatting. Next, go to the first level heading. Here I’ll mark the heading by clicking in the margin next to the heading. Instead of marking all of the headings one by one manually, click “Select” – “Select Text with Similar Formatting”. All text that has the same formatting has now been selected. Now you can apply the “Heading 1” style. To keep the look and feel of the orange formatted headings, right-click and choose “Update Heading 1 to Match Selection”. Now you can see that all the first level headings are visible in the navigation pane, making it easier to navigate.
I’ll continue to add styles to the rest of the headings. I’ll scroll down and mark the bolded text, choose “Select Text with Similar Formatting”, right-click “Heading 2” and choose “Update Heading 2 to Match Selection”. I’ll do the same thing for the third and final heading. As you can see, as I add the heading styles the hierarchy in the navigation pane grows. I’ll click the arrow to go to the top of the document.
How to insert footnotes with references in Word 2013?
Using the Navigation Pane I can easily navigate my document. In this paragraph, I can see that my colleague has included information from a report. The website has been added as a hyperlink. It’s good that he has linked to the source, but in a professional report, you ought to insert source references as footnotes so that more information can be shown and the source more easily verified. To see more information about the source I’ll open up the hyperlink by pressing the CTRL key on my keyboard and then clicking the link.
I’ll position the web page to the left on my screen by pressing Windows key arrow left and then I’ll click my document and then press Windows key arrow right. Now I can see the two windows side by side. This works if you are using Windows 7 or later. To insert a footnote, place the mouse cursor after the word or title you want to add the footnote to. Go to the “REFERENCES” tab and click “Insert Footnote”.
Now you can write the proper source reference in the footnote. Start with the author, in this case, there are three. I’ll copy the authors by marking them and pressing the keyboard shortcut CTRL + C. Place your marker by the footnote, right-click and select “Paste”, “Keep Text Only”, then add a comma. Next, copy the name of the article and copy and paste in the same way. Make the title italic by marking it and selecting italic in the floating bar, or press the keyboard shortcut CTRL+ I. I’ll add the name of the publication company, the date and then finally the web address. Since the Internet changes all the time, it’s recommended that you include the date you accessed the web page in parenthesis at the end. Finally, I’ll remove the hyperlink from the text by right-clicking and select “Remove Hyperlink”.
How to create cross-references in Word 2013?
In the next sentence, I can see that my colleague has added a reference to a paragraph later in the document called Place/Channel. To reference a section in a document properly, mark the name where you want the reference added, on the “REFERENCES” tab click “Cross-reference”. In the “Reference type” drop-down, select what it is you want to refer to and in this case, it is a heading. In the “Insert reference to” select what information you want to add to your document. Select the heading name and click “Insert”.
The name of the heading is now inserted as a cross-reference so that if you change the name of your heading in the document, the name will be updated here as well. You also have a hyperlink embedded in the reference so that the reader can easily go to that section. In order to help readers that read the report on paper, it’s good to add the page number as well. Add the text, “on page” and then click “Cross-reference” again, change the “Insert reference to” to the page number. Again, select the heading you want to refer to.
Now the page number is added to the reference.
How to add page numbers in Word 2013?
Now that we’ve added page numbers in the cross-reference I better add them to the report as well. The easiest way to add page numbers to your document is simply to go to the “INSERT” tab and in the “Header & Footer” section select “Page Number”. Here you can select a nice position and formatting for your page numbers. I’ll select to put the page number at the bottom of the page and I’ll select a design with an accent bar and the page number in the right-hand corner.
How to add document properties to the footer in Word?
Now I’d like to add some document information to the footer. First I’ll open up the footer by just double-clicking it. Instead of just writing the name of our company I’ll use a document field, that way our company name is added to the properties of the document. To insert a document field click “Document Info” and then “Document Property”. Here I’ll select “Company”.
I’ll type in the name of our company, Business Productivity FZ LLC. If you click the “FILE” menu and expand the Document Properties you can see that our company name has been added to the document information.
Next, I want to insert the title of the document. I’ll click “Document Info” and then “Document Title”. As you can see, it doesn’t actually contain the title of the report. Instead of typing in the title here I want to link it to the title on the first page of the report to make sure it gets updated if someone changes the report title. I’ll mark the title, right-click and select “Copy”. Next, I’ll click “INSERT”, “Quick Parts”, “Document Property” and then I’ll select the “Title” property.
I’ll mark the text in the field holder, right-click and paste in the title again. As you can see if I scroll down, the document title field in the footer has been automatically updated.
How to insert a caption for an image in Word?
If your report includes tables or images, it’s recommended that you insert captions. To insert a caption, mark the image, go to the “REFERENCES” tab again, and click “Insert Caption”.
Here I can choose the label, whether it’s a Table, Figure or Equation, here I’ll just keep “Figure”. I’ll type in a description of the figure; “Top 10 SmartPhone Apps in US 2013” and then click “OK”.
I’ll do the same for all the images in the report.
How to insert a table of figures in Word 2013?
Now that I have all of my figures and images in the report marked I can easily add a list of them. To insert a Table of Figures, click the “REFERENCES” tab and select “Insert Table of Figures” and then click “OK”.
A list consisting of links to all your figures in the document will be inserted into your report.
How to create a table of contents in Word 2013?
Now for the final step, I want to insert a table of contents. To insert a table of contents, go to the page where you want it located, click the “REFERENCES” tab and then “Table of Contents”.
Here I’ll select the second design. As long as you are using heading styles the table of contents is automatically populated for you. I want the first paragraph to start on its own page, so I’ll go to the “INSERT” tab and click “Page Break”. Now I have to update the table of contents since everything has shifted. I’ll right-click the table of contents, click “Update Field” and then “Update entire table”.
There, now the report is done! Now it looks much more like a professional report which will definitely reflect positively on the reader’s overall experience of the document.
2 Comments
[This article was first published on business-science.io, and kindly contributed to R-bloggers]. (You can report issue about the content on this page here)
Want to share your content on R-bloggers? click here if you have a blog, or here if you don’t.
What’s the one thing that will impress your company (that you can make in under 60 minutes)? A professional business report.
And Microsoft Word is the defacto standard (NOT Jupyter Notebooks or HTML web-reports). Even PDFs aren’t ideal, especially if they need to review and comment on them.
Table of Contents
Today I’m going to show you how to make professional Microsoft Word Reports use officedown. Here’s what you’re learning today:
- Tutorial: How to use
officedownto effortlessly produce a Microsoft Word Report (that your company will read) - Bonus: Get a Free Rmarkdown Template for making Word Reports

R-Tips Weekly
This article is part of R-Tips Weekly, a weekly video tutorial that shows you step-by-step how to do common R coding tasks. Pretty cool, right?
Here are the links to get set up. 👇
- Get the Code
- YouTube Tutorial
This Tutorial is Available in Video
I have a companion video tutorial that gives you the bonus Rmarkdown MS Word Template shown in this video (plus walks you through how to use it). And, I’m finding that a lot of my students prefer the dialogue that goes along with coding. So check out this video to see me running the code in this tutorial. 👇
Why Making Microsoft Word Reports from R is a Must
Listen, there’s one way to immediately turn off an executive…
And that’s by giving them a Jupter Notebook (I mean look at this mess).

Please don’t send Executives reports that look like this.
Nothing against those that use Jupyter Notebooks to make their analysis.
But, if you sent one of those to me (and I’m an executive that’s used to reading reports in Microsoft Office formats like Excel and Word)…
…Then I’m going to immediately hit my Email Trash Icon (and probably not tell you.)
How does that make you feel?
You just spent days on a report. And guess what, it’s not getting read.
Well let’s fix that by learning how to making Microsoft Word Reports today.
Thank You to the Developer (and Community).
Before we do our deep-dive into officedown, I want to take a brief moment to thank the developer, David Gohel. David runs a consulting company Ardata. Please connect and follow David. His work is on GitHub here.
Also I’d like to thank Adrian Olszewski, Principal Biostatistician at 2KMM for sharing the Office-verse R ecosystem with me. Without community and sharing knowledge, this R-tip wouldn’t be possible.
Free Gift: Cheat Sheet for my Top 100 R Packages (Special Data Analysis Topics Included)
Before we dive in…
You’re going to need R packages to complete the analysis that goes in your MS Word reports. So why not speed up the process?
To help, I’m going to share my secret weapon…
Even I forget which R packages to use from time to time. And this cheat sheet saves me so much time. Instead of googling to filter through 20,000 R packages to find a needle in a haystack. I keep my cheat sheet handy so I know which to use and when to use them. Seriously. This cheat sheet is my bible.

Once you download it, head over to page 3 and you’ll see several R packages I use frequently just for Data Analysis.

Which is important when you want to work in these fields:
- Machine Learning
- Time Series
- Financial Analysis
- Geospatial Analysis
- Text Analysis and NLP
- Shiny Web App Development
So steal my cheat sheet. It will save you a ton of time.
Here’s how to use officedown to start make a professional Word Report.
Step 1: Make an Rmarkdown document
Start by making a normal Rmarkdown document. Go to File > New File > R Markdown.

Step 2: Enable Officedown
Enable officedown as the Rmarkdown Output.

Get the code.
Step 3: Setup the document’s global knitr options
Use these knitr options to let officedown format the table and figure captions.

Get the code.
Step 4: Add Table of Contents
The block_toc() function allows the Word Table of Contents to be generated.

Get the code.
Here’s what the Table of Contents looks like.

Step 5: Add Figures
This is where you start building the core of your report. Officedown integrates:
- Hyperlinked Figure Captioning using
@ref(fig:fig_id) - Knitr Options like
fig.idto connect the linked references to the figures - Just add R Code inside of the Rmarkdown chunks like you would normally

Get the code.
Here’s what it looks like in the report:

Step 5: Add Tables
The last step is adding tables in your document.

Get the code.
And here’s what it looks like in the Word Report.

Step 6: Knit the Report
The last step is to click the “knit” button.

Get the code.
Viola! You get a professional report:
Bonus: Steal My Officedown Template
Want to speed up the process? You can steal my Officedown Template. All you need to do is subscribe to my R-Tips Newsletter.

Steal My Officedown MS Word Template.
Once you register, you’ll get instructions to download all of the R-Tips.
The Officedown Word Template is located in the folder 058_ms_word_reports.
💡 Conclusions
You learned how to use the officedown library to create a professional-looking Microsoft Word Report. Great work! But, there’s a lot more to becoming a data scientist.
If you’d like to become a Business Data Scientist (and have an awesome career, improve your quality of life, enjoy your job, and all the fun that comes along), then I can help with that.
My Struggles with Learning Data Science
It took me a long time to learn how to apply data science to business. And I made a lot of mistakes as I fumbled through learning R.
I specifically had a tough time navigating the ever-increasing landscape of tools and packages, trying to pick between R and Python, and getting lost along the way.
If you feel like this, you’re not alone.
In fact, that’s the driving reason that I created Business Science and Business Science University (You can read about my personal journey here).
What I found out is that:
- Data Science does not have to be difficult, it just has to be taught from a business perspective
- Anyone can learn data science fast provided they are motivated.
How I can help
If you are interested in learning R and the ecosystem of tools at a deeper level, then I have a streamlined program that will get you past your struggles and improve your career in the process.
It’s my 5-Course R-Track System. It’s an integrated system containing 5 courses that work together on a learning path. Through 8 projects, you learn everything you need to help your organization: from data science foundations, to advanced machine learning, to web applications and deployment.
The result is that you break through previous struggles, learning from my experience & our community of 2653 data scientists that are ready to help you succeed.
Ready to take the next step? Then let’s get started.

Join My 5-Course R-Track Program
(Become A 6-Figure Data Scientist)
The ability to produce a professional report design is not a dark art. By adopting some simple guidelines, you can create documents that your audience will be able to read and understand more easily.
The report designs we create for our clients are based on the science of how our brain and eyes work when they engage with information – these guidelines use that same science.
It’s all about
cognitive fluency; the ease with which we process information in the form of words
or graphics so that we understand their meaning. It’s our job to make that
process as short and simple as possible.
We’re sharing six
creative guidelines that we use to do this within our work, and that could help
give professional finesse to your own report design.
01. Add a page header
Including a page header in your report design is a simple but effective feature. Many reports are now viewed digitally, and navigation bars can help your readers to move around your content more easily. They also give structure to the page and the document as a whole, framing the content and providing a consistent reference point for readers. Use colour or a bold font to help readers see where they are in the report.

02. Use columns for body copy
The
column structure in which the words of the report are set is a key design
feature of any written document and the width of a column affects readability.
We
don’t read character by character or even word by word but instead we scan and
then pause to pick up groups of three or four words. As three or four pauses happen
before it gets tiring, we can work out that a column width should be between
9-12 words. That’s the principle.
Using
two or three columns for your text can completely reinvent the look of your
report. Try using one column for pull-out quotes, key points or imagery. It’s
worth noting that white space is not wasteful, but more of that later.


03. Experiment with fonts
Before you start, think about the style of font (or
typeface) you would like to use. Bear in mind that your choice will have an impact
on how your report is perceived by readers as well as the more pragmatic design
consideration of how easy it is for them to read it.
Try and break out of the default standard fonts, Times New
Roman and Arial for example. There are plenty of good, standard fonts to choose
from, whether you’re using Mac or Windows. Google fonts also has plenty of free
commercial typefaces to download and use.
Fonts that have a range of weights (light, regular, medium,
bold, italicised) are especially useful as you can add more sophistication to
your report design. Light weights are effective for body copy and medium and
bold for headings.

Add colour for important information such as headings
and call-outs. Try a dark grey for body copy — it’s less stark than black and can make a report feel
warmer and more appealing. Don’t go too far and too bright with the colours — readers will be put off as they reach for sunglasses and
headache tablets.
04. Reduce the font size
In general, 10pt or 11pt is the widely used default size
but in professional report design we most often use 9pt, sometimes dropping to 8pt.
Often, text in 8pt or 9pt with deeper line spacing (known as leading) can be
easier and faster to read because our eye can more easily see where the next
word or line starts.
Consider if it’s likely that the report you’re working on may be read by those, old or young, who are partially sighted. Guidance about point size can be found on the websites of the RNIB, the charity for blind and partially sighted people or the UK Association for Accessible Formats.

05. Use white space
White space does not have to be white — the term simply refers to the space around written
content, and it is certainly not wasted space.
Using white space enables you to draw your readers eye
to a particular point or paragraph that you want to highlight and then gives
your readers the room so that they can focus on the key section; understanding
rises accordingly.
White space also allows the eyes and brain to rest at
points, to stay interested as layouts differ from page to page, and prevents
the brain from tiring as quickly as it might when presented with a full page of
information to process.

06. Think
about alignment
Alignment
of words is simply the way in which you arrange the lines on the page. The most
common are justified and ranged left. The former is where the column of words
is aligned on both the right and left of a column; the latter is where the text
is aligned just on the left.
When text is justified,
each
line is the same length, so the spacing between words varies from line to line.
Justified text can look neater in smaller point sizes and wide columns, but is
harder to read as the start and of end each line is more difficult to find.
When text is ranged
left, the spacing between words is the same throughout the document,
and the staggered line lengths actually make it easier to read as our brains
more easily identify where a line starts and ends.
Our advice is to
use left-ranged text with a two or three column layout.
The way a report
is designed can say a huge amount about the value you place on your content.
Client and, more importantly, potential client perceptions will be informed by
the design of printed or online reports you produce as well as by the way they
read.
If you’d like to chat to us about how we could help you create a professional report design, call us on 01606 276176 or email us workwithus@nwc.design.