|
Function |
Description |
|---|---|
|
AVEDEV function |
Returns the average of the absolute deviations of data points from their mean |
|
AVERAGE function |
Returns the average of its arguments |
|
AVERAGEA function |
Returns the average of its arguments, including numbers, text, and logical values |
|
AVERAGEIF function |
Returns the average (arithmetic mean) of all the cells in a range that meet a given criteria |
|
AVERAGEIFS function |
Returns the average (arithmetic mean) of all cells that meet multiple criteria |
|
BETA.DIST function |
Returns the beta cumulative distribution function |
|
BETA.INV function |
Returns the inverse of the cumulative distribution function for a specified beta distribution |
|
BINOM.DIST function |
Returns the individual term binomial distribution probability |
|
BINOM.DIST.RANGE function |
Returns the probability of a trial result using a binomial distribution |
|
BINOM.INV function |
Returns the smallest value for which the cumulative binomial distribution is less than or equal to a criterion value |
|
CHISQ.DIST function |
Returns the cumulative beta probability density function |
|
CHISQ.DIST.RT function |
Returns the one-tailed probability of the chi-squared distribution |
|
CHISQ.INV function |
Returns the cumulative beta probability density function |
|
CHISQ.INV.RT function |
Returns the inverse of the one-tailed probability of the chi-squared distribution |
|
CHISQ.TEST function |
Returns the test for independence |
|
CONFIDENCE.NORM function |
Returns the confidence interval for a population mean |
|
CONFIDENCE.T function |
Returns the confidence interval for a population mean, using a Student’s t distribution |
|
CORREL function |
Returns the correlation coefficient between two data sets |
|
COUNT function |
Counts how many numbers are in the list of arguments |
|
COUNTA function |
Counts how many values are in the list of arguments |
|
COUNTBLANK function |
Counts the number of blank cells within a range |
|
COUNTIF function |
Counts the number of cells within a range that meet the given criteria |
|
COUNTIFS function |
Counts the number of cells within a range that meet multiple criteria |
|
COVARIANCE.P function |
Returns covariance, the average of the products of paired deviations |
|
COVARIANCE.S function |
Returns the sample covariance, the average of the products deviations for each data point pair in two data sets |
|
DEVSQ function |
Returns the sum of squares of deviations |
|
EXPON.DIST function |
Returns the exponential distribution |
|
F.DIST function |
Returns the F probability distribution |
|
F.DIST.RT function |
Returns the F probability distribution |
|
F.INV function |
Returns the inverse of the F probability distribution |
|
F.INV.RT function |
Returns the inverse of the F probability distribution |
|
F.TEST function |
Returns the result of an F-test |
|
FISHER function |
Returns the Fisher transformation |
|
FISHERINV function |
Returns the inverse of the Fisher transformation |
|
FORECAST function |
Returns a value along a linear trend Note: In Excel 2016, this function is replaced with FORECAST.LINEAR as part of the new Forecasting functions, but it’s still available for compatibility with earlier versions. |
|
FORECAST.ETS function |
Returns a future value based on existing (historical) values by using the AAA version of the Exponential Smoothing (ETS) algorithm |
|
FORECAST.ETS.CONFINT function |
Returns a confidence interval for the forecast value at the specified target date |
|
FORECAST.ETS.SEASONALITY function |
Returns the length of the repetitive pattern Excel detects for the specified time series |
|
FORECAST.ETS.STAT function |
Returns a statistical value as a result of time series forecasting |
|
FORECAST.LINEAR function |
Returns a future value based on existing values |
|
FREQUENCY function |
Returns a frequency distribution as a vertical array |
|
GAMMA function |
Returns the Gamma function value |
|
GAMMA.DIST function |
Returns the gamma distribution |
|
GAMMA.INV function |
Returns the inverse of the gamma cumulative distribution |
|
GAMMALN function |
Returns the natural logarithm of the gamma function, Γ(x) |
|
GAMMALN.PRECISE function |
Returns the natural logarithm of the gamma function, Γ(x) |
|
GAUSS function |
Returns 0.5 less than the standard normal cumulative distribution |
|
GEOMEAN function |
Returns the geometric mean |
|
GROWTH function |
Returns values along an exponential trend |
|
HARMEAN function |
Returns the harmonic mean |
|
HYPGEOM.DIST function |
Returns the hypergeometric distribution |
|
INTERCEPT function |
Returns the intercept of the linear regression line |
|
KURT function |
Returns the kurtosis of a data set |
|
LARGE function |
Returns the k-th largest value in a data set |
|
LINEST function |
Returns the parameters of a linear trend |
|
LOGEST function |
Returns the parameters of an exponential trend |
|
LOGNORM.DIST function |
Returns the cumulative lognormal distribution |
|
LOGNORM.INV function |
Returns the inverse of the lognormal cumulative distribution |
|
MAX function |
Returns the maximum value in a list of arguments |
|
MAXA function |
Returns the maximum value in a list of arguments, including numbers, text, and logical values |
|
MAXIFS function |
Returns the maximum value among cells specified by a given set of conditions or criteria |
|
MEDIAN function |
Returns the median of the given numbers |
|
MIN function |
Returns the minimum value in a list of arguments |
|
MINA function |
Returns the smallest value in a list of arguments, including numbers, text, and logical values |
|
MINIFS function |
Returns the minimum value among cells specified by a given set of conditions or criteria. |
|
MODE.MULT function |
Returns a vertical array of the most frequently occurring, or repetitive values in an array or range of data |
|
MODE.SNGL function |
Returns the most common value in a data set |
|
NEGBINOM.DIST function |
Returns the negative binomial distribution |
|
NORM.DIST function |
Returns the normal cumulative distribution |
|
NORM.INV function |
Returns the inverse of the normal cumulative distribution |
|
NORM.S.DIST function |
Returns the standard normal cumulative distribution |
|
NORM.S.INV function |
Returns the inverse of the standard normal cumulative distribution |
|
PEARSON function |
Returns the Pearson product moment correlation coefficient |
|
PERCENTILE.EXC function |
Returns the k-th percentile of values in a range, where k is in the range 0..1, exclusive |
|
PERCENTILE.INC function |
Returns the k-th percentile of values in a range |
|
PERCENTRANK.EXC function |
Returns the rank of a value in a data set as a percentage (0..1, exclusive) of the data set |
|
PERCENTRANK.INC function |
Returns the percentage rank of a value in a data set |
|
PERMUT function |
Returns the number of permutations for a given number of objects |
|
PERMUTATIONA function |
Returns the number of permutations for a given number of objects (with repetitions) that can be selected from the total objects |
|
PHI function |
Returns the value of the density function for a standard normal distribution |
|
POISSON.DIST function |
Returns the Poisson distribution |
|
PROB function |
Returns the probability that values in a range are between two limits |
|
QUARTILE.EXC function |
Returns the quartile of the data set, based on percentile values from 0..1, exclusive |
|
QUARTILE.INC function |
Returns the quartile of a data set |
|
RANK.AVG function |
Returns the rank of a number in a list of numbers |
|
RANK.EQ function |
Returns the rank of a number in a list of numbers |
|
RSQ function |
Returns the square of the Pearson product moment correlation coefficient |
|
SKEW function |
Returns the skewness of a distribution |
|
SKEW.P function |
Returns the skewness of a distribution based on a population: a characterization of the degree of asymmetry of a distribution around its mean |
|
SLOPE function |
Returns the slope of the linear regression line |
|
SMALL function |
Returns the k-th smallest value in a data set |
|
STANDARDIZE function |
Returns a normalized value |
|
STDEV.P function |
Calculates standard deviation based on the entire population |
|
STDEV.S function |
Estimates standard deviation based on a sample |
|
STDEVA function |
Estimates standard deviation based on a sample, including numbers, text, and logical values |
|
STDEVPA function |
Calculates standard deviation based on the entire population, including numbers, text, and logical values |
|
STEYX function |
Returns the standard error of the predicted y-value for each x in the regression |
|
T.DIST function |
Returns the Percentage Points (probability) for the Student t-distribution |
|
T.DIST.2T function |
Returns the Percentage Points (probability) for the Student t-distribution |
|
T.DIST.RT function |
Returns the Student’s t-distribution |
|
T.INV function |
Returns the t-value of the Student’s t-distribution as a function of the probability and the degrees of freedom |
|
T.INV.2T function |
Returns the inverse of the Student’s t-distribution |
|
T.TEST function |
Returns the probability associated with a Student’s t-test |
|
TREND function |
Returns values along a linear trend |
|
TRIMMEAN function |
Returns the mean of the interior of a data set |
|
VAR.P function |
Calculates variance based on the entire population |
|
VAR.S function |
Estimates variance based on a sample |
|
VARA function |
Estimates variance based on a sample, including numbers, text, and logical values |
|
VARPA function |
Calculates variance based on the entire population, including numbers, text, and logical values |
|
WEIBULL.DIST function |
Returns the Weibull distribution |
|
Z.TEST function |
Returns the one-tailed probability-value of a z-test |
When we need to collect data from others, they may write different things from their perspective. Still, we need to make all the related stories under one. Also, it is common that while entering the data, they make mistakes because of typo errors. For example, assume in certain cells, if we ask users to enter either “YES” or “NO,” one will enter “Y,” someone will insert “YES” like this, and we may end up getting a different kind of results. So in such cases, creating a list of values as pre-determined values allows the users only to choose from the list instead of users entering their values. Therefore, in this article, we will show you how to create a list of values in Excel.
Table of contents
- Create List in Excel
- #1 – Create a Drop-Down List in Excel
- #2 – Create List of Values from Cells
- #3 – Create List through Named Manager
- Things to Remember
- Recommended Articles
You can download this Create List Excel Template here – Create List Excel Template
#1 – Create a Drop-Down List in Excel
We can create a drop-down list in Excel using the “Data Validation in excelThe data validation in excel helps control the kind of input entered by a user in the worksheet.read more” tool, so as the word itself says, data will be validated even before the user decides to enter. So, all the values that need to be entered are pre-validated by creating a drop-down list in Excel. For example, assume we need to allow the user to choose only “Agree” and “Not Agree,” so we will create a list of values in the drop-down list.
- In the Excel worksheet under the “Data” tab, we have an option called “Data Validation” from this again, choose “Data Validation.”
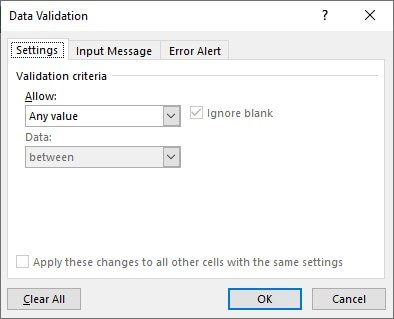
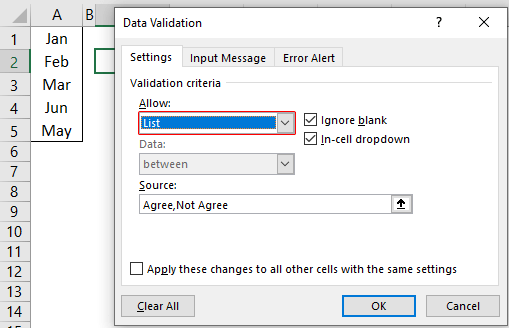
- As a result, this will open the “Data Validation” tool window.
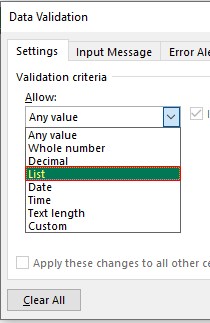
- The “Settings” tab will be shown by default, and now we need to create validation criteria. Since we are creating a list of values, choose “List” as the option from the “Allow” drop-down list.
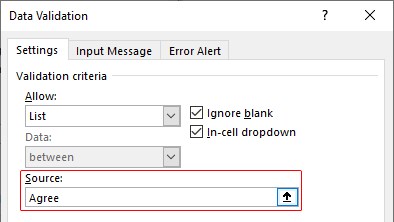
- For this “List,” we can give a list of values to be validated in the following way, i.e., by directly entering the values in the “Source” list.
- Enter the first value as “Agree.”
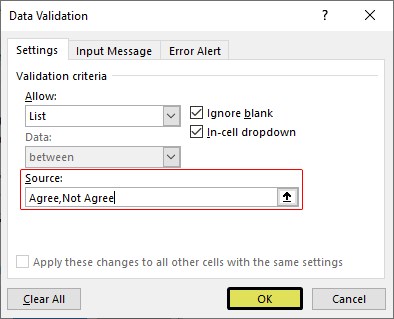
- Once the first value to be validated is entered, we need to enter “comma” (,) as the list separator before entering the next value. So, enter “comma” and enter the following values as “Not Agree.”
- After that, click on “Ok,” and the list of values may appear in the form of the “drop-down” list.
#2 – Create a List of Values from Cells
The above method is to get started, but imagine the scenario of creating a long list of values or your list of values changing now and then. Then, it may get difficult to return and edit the list of values manually. So, by entering values in the cell, we can easily create a list of values in Excel.
Follow the steps to create a list from cell values.
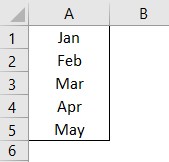
- We must first insert all the values in the cells.
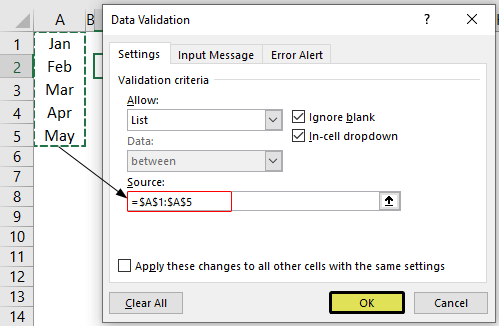
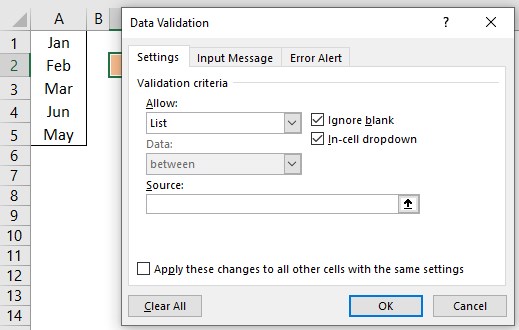
- Then, open “Data Validation” and choose the validation type as “List.”
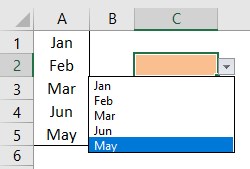
- Next, in the “Source” box, we need to place the cursor and select the list of values from the range of cells A1 to A5.
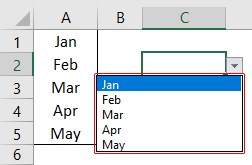
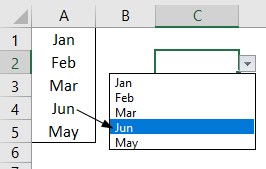
- Click on “OK,” and we will have the list ready in cell C2.
So values to this list are supplied from the range of cells A1 to A5. Any changes in these referenced cells will also impact the drop-down list.
For example, in cell A4, we have a value as “Apr,” but now we will change that to “Jun” and see what happens in the drop-down list.
Now, look at the result of the drop-down list. Instead of “Apr,” we see “Jun” because we had given the list source as cell range, not manual entries.
#3 – Create List through Named Manager
There is another way to create a list of values, i.e., through named ranges in excelName range in Excel is a name given to a range for the future reference. To name a range, first select the range of data and then insert a table to the range, then put a name to the range from the name box on the left-hand side of the window.read more.
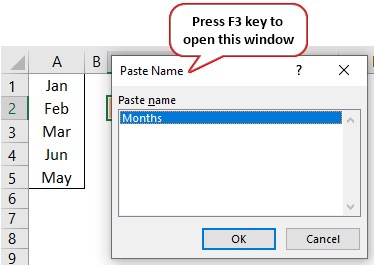
- We have values from A1 to A5 in the above example, naming this range “Months.”
- Now, select the cell where we need to create a list and open the drop-down list.
- Now place the cursor in the “Source” box and press the F3 key to an open list of named ranges.
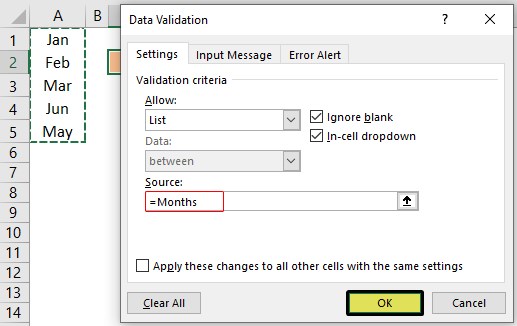
- As we can see above, we have a list of names, choose the name “Months” and click on “OK” to get the name to the “Source” box.
- Click on “OK,” and the drop-down list is ready.
Things to Remember
- The shortcut key to open data validation is “ALT + A + V + V.“
- We must always create a list of values in the cells so that it may impact the drop-down list if any change happens in the referenced cells.
Recommended Articles
This article has been a guide to Excel Create List. Here, we learn how to create a list of values in Excel also, create a simple drop-down method and make a list through name manager along with examples and downloadable Excel templates. You may learn more about Excel from the following articles: –
- Custom List in Excel
- Drop Down List in Excel
- Compare Two Lists in Excel
- How to Randomize List in Excel?
So, there are times when you would like to know that a value is in a list or not. We have done this using VLOOKUP. But we can do the same thing using COUNTIF function too. So in this article, we will learn how to check if a values is in a list or not using various ways.
Check If Value In Range Using COUNTIF Function
So as we know, using COUNTIF function in excel we can know how many times a specific value occurs in a range. So if we count for a specific value in a range and its greater than zero, it would mean that it is in the range. Isn’t it?
Generic Formula
=COUNTIF(range,value)>0
Range: The range in which you want to check if the value exist in range or not.
Value: The value that you want to check in the range.
Let’s see an example:
Excel Find Value is in Range Example
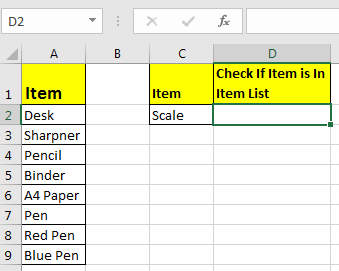
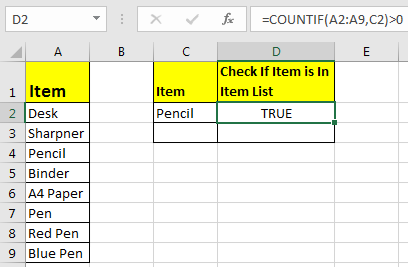
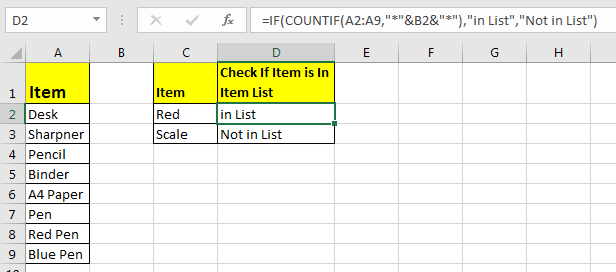
For this example, we have below sample data. We need a check-in the cell D2, if the given item in C2 exists in range A2:A9 or say item list. If it’s there then, print TRUE else FALSE.
Write this formula in cell D2:
Since C2 contains “scale” and it’s not in the item list, it shows FALSE. Exactly as we wanted. Now if you replace “scale” with “Pencil” in the formula above, it’ll show TRUE.
Now, this TRUE and FALSE looks very back and white. How about customizing the output. I mean, how about we show, “found” or “not found” when value is in list and when it is not respectively.
Since this test gives us TRUE and FALSE, we can use it with IF function of excel.
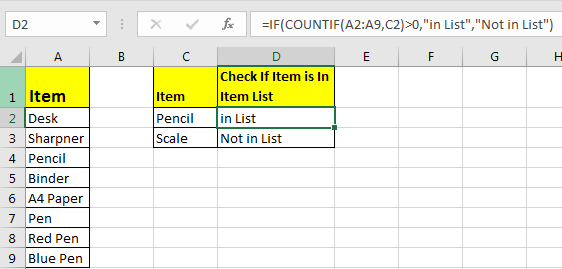
Write this formula:
=IF(COUNTIF(A2:A9,C2)>0,»in List»,»Not in List»)
You will have this as your output.
What If you remove “>0” from this if formula?
=IF(COUNTIF(A2:A9,C2),»in List»,»Not in List»)
It will work fine. You will have same result as above. Why? Because IF function in excel treats any value greater than 0 as TRUE.
How to check if a value is in Range with Wild Card Operators
Sometimes you would want to know if there is any match of your item in the list or not. I mean when you don’t want an exact match but any match.
For example, if in the above-given list, you want to check if there is anything with “red”. To do so, write this formula.
=IF(COUNTIF(A2:A9,»*red*»),»in List»,»Not in List»)
This will return a TRUE since we have “red pen” in our list. If you replace red with pink it will return FALSE. Try it.
Now here I have hardcoded the value in list but if your value is in a cell, say in our favourite cell B2 then write this formula.
IF(COUNTIF(A2:A9,»*»&B2&»*»),»in List»,»Not in List»)
There’s one more way to do the same. We can use the MATCH function in excel to check if the column contains a value. Let’s see how.
Find if a Value is in a List Using MATCH Function
So as we all know that MATCH function in excel returns the index of a value if found, else returns #N/A error. So we can use the ISNUMBER to check if the function returns a number.
If it returns a number ISNUMBER will show TRUE, which means it’s found else FALSE, and you know what that means.
Write this formula in cell C2:
=ISNUMBER(MATCH(C2,A2:A9,0))
The MATCH function looks for an exact match of value in cell C2 in range A2:A9. Since DESK is on the list, it shows a TRUE value and FALSE for SCALE.
So yeah, these are the ways, using which you can find if a value is in the list or not and then take action on them as you like using IF function. I explained how to find value in a range in the best way possible. Let me know if you have any thoughts. The comments section is all yours.
Related Articles:
How to Check If Cell Contains Specific Text in Excel
How to Check A list of Texts In String in Excel
How to take the Average Difference between lists in Excel
How to Get Every Nth Value From A list in Excel
Popular Articles:
50 Excel Shortcuts to Increase Your Productivity
How to use the VLOOKUP Function in Excel
How to use the COUNTIF function in Excel
How to use the SUMIF Function in Excel
Listing the files in a folder is one of the activities which cannot be achieved using normal Excel formulas. I could tell you to turn to VBA macros or PowerQuery, but then any non-VBA and non-PowerQuery users would close this post instantly. But wait! Back away from the close button, there is another option.
For listing files in a folder we can also use a little-known feature from Excel version 4, which still works today, the FILES function.
If you search through the list of Excel functions, FILES is not listed. The FILES function is based on an old Excel feature, which has to be applied in a special way. The instructions below will show you step-by-step how to use it.
Create a named range for the FILES function
The first step is to create a named range, which contains the FILES function. Within the Excel Ribbon click Formulas -> Define Name
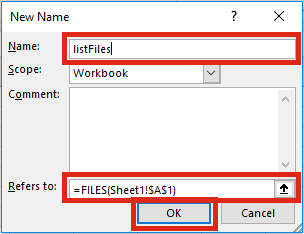
Within the New Name window set the following criteria:
- Name: listFiles
Can be any name you wish, but for our example we will be using listFiles. - Refers to: =FILES(Sheet1!$A$1)
Sheet1!$A$1 is the sheet and cell reference containing the name of the folder from which the files are to be listed.
Click OK to close the New Name window.
Apply the function to list files
The second step is to set-up the worksheet to use the named range.
In Cell A1 (or whichever cell reference used in the Refers to box) enter the folder path from which to list the files, followed by an Asterisk ( * ). The Asterisk is the wildcard character to find any text, so it will list all the files in the folder.
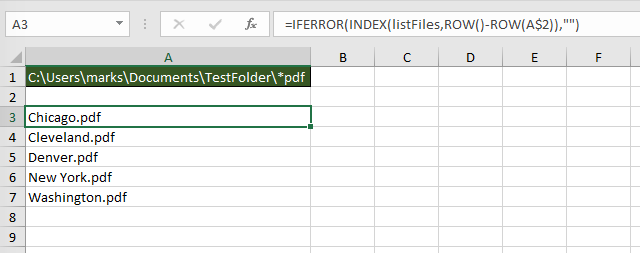
Select the cell in which to start the list of files (Cell A3 in the screenshot below), enter the following formula.
=INDEX(listFiles,1)
The result of the function will be the name of the first file in the folder.
To retrieve the second file from the folder enter the following formula
=INDEX(listFiles,2)
It would be painful to change the file reference number within each formula individually, especially if there are hundreds of files. The good news is, we can use another formula to calculate the reference number automatically.
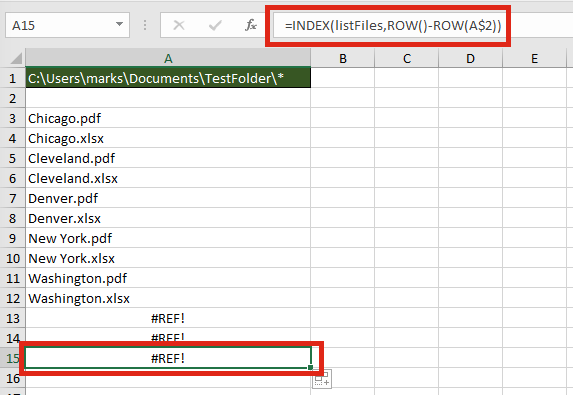
=INDEX(listFiles,ROW()-ROW(A$2))
The ROW() function is used to retrieve the row number of a cell reference. When used without a cell reference, it returns the row number of the cell in which the function is used. When used with a cell reference it returns the row number of that cell. Using the ROWS function, it is possible to create a sequential list of numbers starting at 1, and increasing by 1 for each cell the formula is copied into.
If the formula is copied down further than the number of files in the folder, it will return a #REF! error.
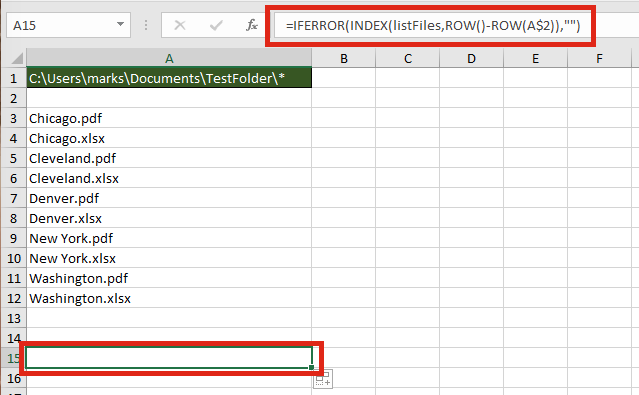
Finally, wrap the formula within an IFERROR function to return a blank cell, rather than an error.
=IFERROR(INDEX(listFiles,ROW()-ROW(A$2)),"")
Listing specific types of files
The FILES function does not just list Excel files; it lists all file types; pdf, csv, mp3, zip, any file type you can think of. By extending the use of wildcards within the file path it is possible to restrict the list to specific file types, or to specific file names.
The screenshot below shows how to return only files with “pdf” as the last three characters of the file name.
The wildcards which can be applied are:
- Question mark ( ? ) – Can take the place of any single character.
- Asterisk ( * ) – Represents any number of characters
- Tilde ( ~ ) – Used as an escape character to search for an asterisk or question mark within the file name, rather than as a wildcard.
The screenshot below shows how to return only files with the name of “New York.“, followed by exactly three characters.
Advanced uses for the FILES named range
Below are some ideas of how else you could use the FILES function.
Count the number of files
The named range created works like any other named range. However, rather than containing cells, it contains values. Therefore, if you want to calculate the number of files within the folder, or which meet the wildcard pattern use the following formula:
=COUNTA(listFiles)
Create hyperlinks to the files
Wouldn’t it be great to click on the file name to open it automatically? Well . . . just add in the HYPERLINK function and you can.
The formula in Cell A3 is:
=IFERROR(HYPERLINK(LEFT($A$1,LEN($A$1)-1)&INDEX(listFiles,ROW()-ROW(A$2)),
INDEX(listFiles,ROW()-ROW(A$2))),"")
Check if a specific file exists within a folder
It isn’t necessary to list all the files to find out if a file exists within the folder. The MATCH function will return the position of the file within the folder.
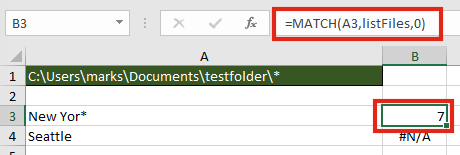
The formula in cell B3 is:
=MATCH(A3,listFiles,0)
In our example, a file which contains the text “New Yor*” exists, as the 7th file, therefore a 7 is returned. Cell B4 displays the #N/A error because “Seattle” does not exist in the folder.
Find the name of the next or previous file
The files returned are in alphabetical order, therefore it is possible to find the next or previous file using the INDEX / MATCH combination.
The next file after “Denver.xlsx” is “New York.pdf“. The formula in Cell B3 is:
=INDEX(listFiles,MATCH(A3,listFiles,0)+1)
Retrieve values from each file with INDIRECT
The INDIRECT function can construct a cell reference using text strings. Having retrieved the list of files in a folder, it would be possible to obtain values from those files.
The formula in Cell B3 is:
=INDIRECT("'"&LEFT($A$1,LEN($A$1)-1)&"["&A3&"]Sheet1'!$A$1")
For INDIRECT to calculate correctly the file does need to be open, so this may be a significant flaw in this option.
Usage notes
When working with the FILES function there are a few things to be aware of:
- The file path and file name is not case sensitive
- Files are returned in alphabetical order
- Folders and hidden files are not returned by the function
- The workbook must be saved as a “.xlsm” file format
Further reading
There are variety of other Excel 4 functions available which still work in Excel. Check out this post to find out how to apply them and download the Excel 4 Macro functions reference guide.
If you decide to use a VBA method, check out this post.
About the author
Hey, I’m Mark, and I run Excel Off The Grid.
My parents tell me that at the age of 7 I declared I was going to become a qualified accountant. I was either psychic or had no imagination, as that is exactly what happened. However, it wasn’t until I was 35 that my journey really began.
In 2015, I started a new job, for which I was regularly working after 10pm. As a result, I rarely saw my children during the week. So, I started searching for the secrets to automating Excel. I discovered that by building a small number of simple tools, I could combine them together in different ways to automate nearly all my regular tasks. This meant I could work less hours (and I got pay raises!). Today, I teach these techniques to other professionals in our training program so they too can spend less time at work (and more time with their children and doing the things they love).
Do you need help adapting this post to your needs?
I’m guessing the examples in this post don’t exactly match your situation. We all use Excel differently, so it’s impossible to write a post that will meet everybody’s needs. By taking the time to understand the techniques and principles in this post (and elsewhere on this site), you should be able to adapt it to your needs.
But, if you’re still struggling you should:
- Read other blogs, or watch YouTube videos on the same topic. You will benefit much more by discovering your own solutions.
- Ask the ‘Excel Ninja’ in your office. It’s amazing what things other people know.
- Ask a question in a forum like Mr Excel, or the Microsoft Answers Community. Remember, the people on these forums are generally giving their time for free. So take care to craft your question, make sure it’s clear and concise. List all the things you’ve tried, and provide screenshots, code segments and example workbooks.
- Use Excel Rescue, who are my consultancy partner. They help by providing solutions to smaller Excel problems.
What next?
Don’t go yet, there is plenty more to learn on Excel Off The Grid. Check out the latest posts:
There are many scenarios you may come across while working in Excel where you only desire unique values in a list. You might want to rid your data of duplicates to create summaries, populate drop-down lists, or remove duplicates that found their way into your spreadsheet.
Luckily, Microsoft Excel offers many ways to accomplish summarizing values into a unique listing and depending on your particular situation, you may use different methods to accomplish the task at hand.
In this article, we’ll cover a bunch of different ways to identify those unique values so you have a full set of tactics to handle anything thrown your way. Let’s dive in!
1. Use The UNIQUE Function
With the release of Dynamic Array functions in 2020, Excel now offers a powerful function right out of the box to provide a simple way to pull together a list of unique values. Simply input the range you would like to analyze inside the UNIQUE Function and you’ll have the unique results delivered in a Spill Range below the formula.
If you’re looking for a more long-term solution, convert your data set into an Excel Table (ctrl + t) and point your UNIQUE function to read the table column. This will allow you to always have a more dynamic listing as your data grows or shrinks over time.
Pro Tip: If you want your list in alphabetical order add the Sort Function to your formula:
=SORT(UNIQUE(Table1[State]))
2. Use An Array Formula
Before the UNIQUE function was released, Excel users were left using more complex methods to compile a list of unique values from a range. Pretty much all of these methods involved using array formulas (think Ctrl+Shift+Enter) to output the end result. The formula I will share in this post does not require keying in Ctrl+Shift+Enter to activate it, hence why I prefer it. The downside to using an Array formula over an Dynamic Array function is you have to carry it down manually, there is no Spill Range functionality that will automatically resize your list.
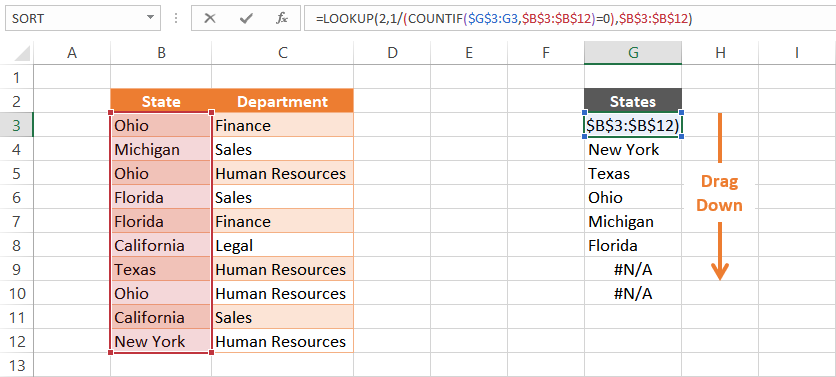
I won’t go into the details of how this formula works (if interested go here), just know if you set it up properly it will magically work. Make sure you pay close attention to your dollar signs at the beginning of the COUNTIF function. It does matter that the first cell reference stays static while the other one changes as you carry the formula down (ie $G$3:G3 in the below example).
Finally, after you setup the first formula, you’ll need to drag the formula down until you start seeing #N/As. You’ll want to monitor your list if your data will be changing in the future to ensure it is picking up all the unique results. As a rule, I always make note to ensure at least one #N/A is showing at the bottom of my list.
FORMULA: =LOOKUP(2,1/(COUNTIF($G$3:G3,$B$3:$B$12)=0),$B$3:$B$12)
3. Apply A Filter
If you would like to see a list of unique values without necessarily needing to store the list, you can utilize a cell Filter (ctrl + shift + L). Apply a filter to your data and click the filter arrow to see a list showing all the unique values within that particular column of data.
4. Pivot Table
A Pivot Table is another good way to list out unique values. Select your data range (ensuring every column has a unique header value) and go to Insert > Pivot Table. When the Insert Dialog box appears , simply hit the OK button and you can start pivoting your data.
Drag the name of the column you would like to see a unique list of value for into the “Rows” quadrant. You should instantly see your list populate within the Pivot Table.
5. Remove Duplicates
If you actually want to modify your data so it only has unique values, you can utilize Excel’s Remove Duplicate button. This feature can be used on a range of cells or within an Excel Table.
Follow these steps to utilize this functionality:
-
Select your range of data
-
Navigate to the Data Ribbon tab.
-
Click the Remove Duplicates button within the Data Tools button group
-
Check the combination of columns you’d like to be unique
6. Highlight Duplicates With Conditional Formatting
You may run into situations where you want to quickly visualize if there are any duplicates in your data set. This is where you can apply a little bit of conditional formatting and luckily there is a preset to flag duplicate values!
Just follow these simple steps:
-
Highlight the cell range you want to analyze
-
Navigate to the Conditional Formatting button on the Home tab
-
Select Highlight Cells Rules
-
Select Duplicate Values…
-
Click OK
7. Use A Counting Formula
You might want to pursue utilizing a formula to flag your duplicate values. This can be done by using the COUNTIF() function. The below example shows how you can analyze each cell in the data range and understand if that value occurs more than once. If you have any count that is great than 1, you know there’s a duplicate within your data set.
Example Formula: =COUNTIF($D$4:$D$13, D4)
After you have implemented the formula, simply apply a filter and filter out all the “1” values.
If you are more concerned with having a duplicate row across multiple columns, you can add a helper column (Column D in the below example) that joins the values of the columns you want to ensure are unique. After the helper column is created, point your COUNTIF function to it and repeat the steps in the prior example.
Any Others I Missed?
Whew, that was a lot of techniques we went through to get to pretty much the same result. Hopefully, you start to realize as you find yourself needing to pull together a list of unique values, how valuable knowing all the options available to you in Excel. I’m sure there were other great methods that I overlooked or haven’t discovered yet. Please let me know if you have any tips in the comments section and I can growth this article even further!
I Hope This Helped!
Hopefully, I was able to explain how you can use a variety of methods to create unique lists of your data. If you have any questions about this technique or suggestions on how to improve it, please let me know in the comments section below.
About The Author
Hey there! I’m Chris and I run TheSpreadsheetGuru website in my spare time. By day, I’m actually a finance professional who relies on Microsoft Excel quite heavily in the corporate world. I love taking the things I learn in the “real world” and sharing them with everyone here on this site so that you too can become a spreadsheet guru at your company.
Through my years in the corporate world, I’ve been able to pick up on opportunities to make working with Excel better and have built a variety of Excel add-ins, from inserting tickmark symbols to automating copy/pasting from Excel to PowerPoint. If you’d like to keep up to date with the latest Excel news and directly get emailed the most meaningful Excel tips I’ve learned over the years, you can sign up for my free newsletters. I hope I was able to provide you some value today and hope to see you back here soon! — Chris
| Function | Version | Purpose | Arguments |
|---|---|---|---|
| AND | Excel 2003 | Test multiple conditions with AND | logical1 logical2 … |
| FALSE | Excel 2003 | Generate the logical value FALSE | |
| IF | Excel 2003 | Test for a specific condition | logical_test value_if_true value_if_false |
| IFERROR | Excel 2007 | Trap and handle errors | value value_if_error |
| IFNA | Excel 2013 | Trap and handle #N/A errors | value value_if_na |
| IFS | Excel 2019 | Test multiple conditions, return first true | test1 value1 test2, value2 … |
| NOT | Excel 2003 | Reverse arguments or results | logical |
| OR | Excel 2003 | Test multiple conditions with OR | logical1 logical2 … |
| SWITCH | Excel 2019 | Match multiple values, return first match | expression val1/result1 val2/result2 … default |
| TRUE | Excel 2003 | Generate the logical value TRUE | |
| XOR | Excel 2013 | Perform exclusive OR | logical1 logical2 … |
| Function | Version | Purpose | Arguments |
|---|---|---|---|
| DATE | Excel 2003 | Create a date with year, month, and day | year month day |
| DATEDIF | Excel 2003 | Get days, months, or years between two dates | start_date end_date unit |
| DATEVALUE | Excel 2003 | Convert a date in text format to a valid date | date_text |
| DAY | Excel 2003 | Get the day as a number (1-31) from a date | date |
| DAYS | Excel 2013 | Count days between dates | end_date start_date |
| DAYS360 | Excel 2003 | Get days between 2 dates in a 360-day year | start_date end_date method |
| EDATE | Excel 2003 | Shift date n months in future or past | start_date months |
| EOMONTH | Excel 2003 | Get last day of month n months in future or past | start_date months |
| HOUR | Excel 2003 | Get the hour as a number (0-23) from a Time | serial_number |
| ISOWEEKNUM | Excel 2013 | Get ISO week number for a given date | date |
| MINUTE | Excel 2003 | Get minute as a number (0-59) from time | serial_number |
| MONTH | Excel 2003 | Get month as a number (1-12) from a date | serial_number |
| NETWORKDAYS | Excel 2003 | Get the number of working days between two dates | start_date end_date holidays |
| NETWORKDAYS.INTL | Excel 2010 | Get work days between two dates | start_date end_date weekend holidays |
| NOW | Excel 2003 | Get the current date and time | |
| SECOND | Excel 2003 | Get the Second as a number (0-59) from a Time | serial_number |
| TIME | Excel 2003 | Create a time with hours, minutes, and seconds | hour minute second |
| TIMEVALUE | Excel 2003 | Get a valid time from a text string | time_text |
| TODAY | Excel 2003 | Get the current date | |
| WEEKDAY | Excel 2003 | Get the day of the week as a number | serial_number return_type |
| WEEKNUM | Excel 2003 | Get the week number for a given date | serial_num return_type |
| WORKDAY | Excel 2003 | Get a date n working days in the future or past | start_date days holidays |
| WORKDAY.INTL | Excel 2010 | Get date n working days in future or past | start_date days weekend holidays |
| YEAR | Excel 2003 | Get the year from a date | date |
| YEARFRAC | Excel 2003 | Get the fraction of a year between two dates | start_date end_date basis |
| Function | Version | Purpose | Arguments |
|---|---|---|---|
| ADDRESS | Excel 2003 | Create a cell address from a row and column number | row_num col_num abs_num a1 sheet |
| AREAS | Excel 2003 | Get the number of areas in a reference. | reference |
| CHOOSE | Excel 2003 | Get a value from a list based on position | index_num value1 value2 … |
| COLUMN | Excel 2003 | Get the column number of a reference. | reference |
| COLUMNS | Excel 2003 | Get the number of columns in an array or reference. | array |
| FIELDVALUE | Excel 365 | Extract field value from a data type | value field_name |
| FORMULATEXT | Excel 2013 | Get the formula in a cell | reference |
| GETPIVOTDATA | Excel 2003 | Retrieve data from a pivot table in a formula | data_field pivot_table field1, item1 … |
| HLOOKUP | Excel 2003 | Look up a value in a table arranged horizontally | lookup_value table_array row_index range_lookup |
| HYPERLINK | Excel 2003 | Create a clickable link. | link_location friendly_name |
| INDEX | Excel 2003 | Get a value in a list or table based on location | array row_num col_num area_num |
| INDIRECT | Excel 2003 | Create a reference from text | ref_text a1 |
| LOOKUP | Excel 2003 | Look up a value in a one-column range | lookup_value lookup_vector result_vector |
| MATCH | Excel 2003 | Get the position of an item in an array | lookup_value lookup_array match_type |
| OFFSET | Excel 2003 | Create a reference offset from given starting point | reference rows cols height width |
| ROW | Excel 2003 | Get the row number of a reference | reference |
| ROWS | Excel 2003 | Get the number of rows in an array or reference. | array |
| TRANSPOSE | Excel 2003 | Flip the orientation of a range of cells | array |
| VLOOKUP | Excel 2003 | Lookup a value in a table by matching on the first column | lookup_value table_array column_index_num range_lookup |
| Function | Version | Purpose | Arguments |
|---|---|---|---|
| CHAR | Excel 2003 | Get a character from a number | number |
| CLEAN | Excel 2003 | Strip non-printable characters from text | text |
| CODE | Excel 2003 | Get the code for a character | text |
| CONCAT | Excel 2019 | Join text values without delimiter | text1 text2 … |
| CONCATENATE | Excel 2003 | Join text together | text1 text2 text3 … |
| DOLLAR | Excel 2003 | Convert a number to text in currency format | number decimals |
| EXACT | Excel 2003 | Compare two text strings | text1 text2 |
| FIND | Excel 2003 | Get location substring in a string | find_text within_text start_num |
| FIXED | Excel 2003 | Format number as text with fixed decimals | number decimals no_commas |
| LEFT | Excel 2003 | Extract text from the left of a string | text num_chars |
| LEN | Excel 2003 | Get the length of text. | text |
| LOWER | Excel 2003 | Convert text to lower case | text |
| MID | Excel 2003 | Extract text from inside a string | text start_num num_chars |
| NUMBERVALUE | Excel 2013 | Convert text to number with custom separators | text decimal_separator group_separator |
| PROPER | Excel 2003 | Capitalize the first letter in each word | text |
| REPLACE | Excel 2003 | Replace text based on location | old_text start_num num_chars new_text |
| REPT | Excel 2003 | Repeat text as specified | text number_times |
| RIGHT | Excel 2003 | Extract text from the right of a string | text num_chars |
| SEARCH | Excel 2003 | Get the location of substring in a string | find_text within_text start_num |
| SUBSTITUTE | Excel 2003 | Replace text based on content | text old_text new_text instance |
| TEXT | Excel 2003 | Convert a number to text in a number format | value format_text |
| TEXTJOIN | Excel 2019 | Join text values with a delimiter | delimiter ignore_empty text1 text2 … |
| TRIM | Excel 2003 | Remove extra spaces from text | text |
| UNICHAR | Excel 2013 | Get Unicode character by number | number |
| UNICODE | Excel 2013 | Get number from Unicode character | text |
| UPPER | Excel 2003 | Convert text to upper case | text |
| VALUE | Excel 2003 | Convert text to a number | text |
| Function | Version | Purpose | Arguments |
|---|---|---|---|
| ARRAYTOTEXT | Excel 365 | Converts array or range to a text string | array format |
| BYCOL | Excel 365 | Apply function to column | array lambda |
| BYROW | Excel 365 | Apply function to row | array lambda |
| CHOOSECOLS | Excel 365 | Return specific columns from an array | array col_num1 col_num2 … |
| CHOOSEROWS | Excel 365 | Return specific rows from an array | array row_num1 row_num2 … |
| DROP | Excel 365 | Remove portion of an array | array rows col |
| EXPAND | Excel 365 | Expand array by adding rows or columns | array rows columns pad_with |
| FILTER | Excel 2021 | Filters range with given criteria | array include if_empty |
| HSTACK | Excel 365 | Combine ranges or arrays horizontally | array1 array2 … |
| ISOMITTED | Excel 365 | Check for optional arguments in LAMBDAs | argument |
| LAMBDA | Excel 365 | Create custom function | parameter … calculation |
| LET | Excel 2021 | Assign variables inside formula | name1 value1 name2/value2 … result |
| MAKEARRAY | Excel 365 | Create array with calculated values | rows columns lambda |
| MAP | Excel 365 | Map array to custom function | array1 array2 … lambda |
| RANDARRAY | Excel 2021 | Get array of random numbers | rows columns min max integer |
| REDUCE | Excel 365 | Reduce an array | initial_value array lambda |
| SCAN | Excel 365 | Scan array and return intermediate results | initial_value array lambda |
| SEQUENCE | Excel 2021 | Get array of list of sequential numbers | rows columns start step |
| SORT | Excel 2021 | Sorts range or array | array sort_index sort_order by_col |
| SORTBY | Excel 2021 | Sorts range or array by column | array by_array sort_order array/order … |
| STOCKHISTORY | Excel 365 | Retrieve stock price information | stock start_date end_date interval headers properties … |
| TAKE | Excel 365 | Get a subset of an array | array rows col |
| TEXTAFTER | Excel 365 | Extract text after delimiter | text delimiter instance_num match_mode match_end if_not_found |
| TEXTBEFORE | Excel 365 | Extract text before delimiter | text delimiter instance_num match_mode match_end if_not_found |
| TEXTSPLIT | Excel 365 | Split a text string with a delimiter | text col_delimiter row_delimiter ignore_empty match_mode pad_with |
| TOCOL | Excel 365 | Transform array to single column | array ignore scan_by_column |
| TOROW | Excel 365 | Transform array to single row | array ignore scan_by_column |
| UNIQUE | Excel 2021 | Extract unique values from range | array by_col exactly_once |
| VALUETOTEXT | Excel 365 | Converts a value to a text string | value format |
| VSTACK | Excel 365 | Combine ranges or arrays vertically | array1 array2 … |
| WRAPCOLS | Excel 365 | Wrap array into columns | vector wrap_count pad_with |
| WRAPROWS | Excel 365 | Wrap array into rows | vector wrap_count pad_with |
| XLOOKUP | Excel 2021 | Lookup values in range or array | lookup lookup_array return_array not_found match_mode search_mode |
| XMATCH | Excel 2021 | Get the position of an item in a list or table | lookup_value lookup_array match_mode search_mode |
| Function | Version | Purpose | Arguments |
|---|---|---|---|
| BIN2DEC | Excel 2003 | Converts a binary number to decimal | number |
| BIN2HEX | Excel 2003 | Converts a binary number to hexadecimal | number places |
| BIN2OCT | Excel 2003 | Converts a binary number to octal | number places |
| BITAND | Excel 2013 | Returns a ‘Bitwise And’ of two numbers | number1 number2 |
| BITLSHIFT | Excel 2013 | Returns a number shifted left by some number of bits | number shift_amount |
| BITOR | Excel 2013 | Returns a ‘Bitwise Or’ of two numbers | number1 number2 |
| BITRSHIFT | Excel 2013 | Returns a number shifted right by some number of bits | number shift_amount |
| BITXOR | Excel 2013 | Returns a ‘Bitwise Xor’ of two numbers | number1 number2 |
| COMPLEX | Excel 2003 | Convert coefficients to complex number | real_num i_num suffix |
| CONVERT | Excel 2003 | Convert measurement units | number from_unit to_unit |
| DEC2BIN | Excel 2003 | Converts a decimal number to binary | number places |
| DEC2HEX | Excel 2003 | Converts a decimal number to hexadecimal | number places |
| DEC2OCT | Excel 2003 | Converts a decimal number to octal | number places |
| DELTA | Excel 2003 | Test two values are equal | number1 number2 |
| HEX2BIN | Excel 2003 | Converts a hexadecimal number to binary | number places |
| HEX2DEC | Excel 2003 | Converts a hexadecimal number to decimal | number |
| HEX2OCT | Excel 2003 | Converts a hexadecimal number to octal | number places |
| IMABS | Excel 2003 | Get absolute value of complex number | inumber |
| IMAGINARY | Excel 2003 | Get imaginary coefficient of complex number | inumber |
| IMPOWER | Excel 2003 | Raise complex number to given power | inumber number |
| IMPRODUCT | Excel 2003 | Get product of complex numbers | inumber1 inumber2 … |
| IMREAL | Excel 2003 | Get real coefficient of complex number | inumber |
| IMSUB | Excel 2003 | Get difference between two complex numbers | inumber1 inumber2 |
| IMSUM | Excel 2003 | Get sum of complex numbers | inumber1 inumber2 … |
| Function | Version | Purpose | Arguments |
|---|---|---|---|
| ACCRINT | Excel 2003 | Get accrued interest periodic | id fd sd rate par freq basis calc |
| ACCRINTM | Excel 2003 | Get accrued interest at maturity | id sd rate par basis |
| AMORDEGRC | Excel 2003 | Depreciation for accounting period coefficient | cost purchase first salvage period rate basis |
| AMORLINC | Excel 2003 | Depreciation for accounting period | cost purchase first salvage period rate basis |
| COUPDAYBS | Excel 2003 | Get days from coupon period to settlement date | settlement maturity frequency basis |
| COUPDAYS | Excel 2003 | Get days in coupon period incl settlement date | settlement maturity frequency basis |
| COUPDAYSNC | Excel 2003 | Get days from settlement date to next coupon date | settlement maturity frequency basis |
| COUPNCD | Excel 2003 | Get next coupon date after settlement date | settlement maturity frequency basis |
| COUPNUM | Excel 2003 | Get number of coupons payable | settlement maturity frequency basis |
| COUPPCD | Excel 2003 | Get previous coupon date before settlement date | settlement maturity frequency basis |
| CUMIPMT | Excel 2003 | Get cumulative interest paid on a loan | rate nper pv start_period end_period type |
| CUMPRINC | Excel 2003 | Get cumulative principal paid on a loan | rate nper pv start_period end_period type |
| DB | Excel 2003 | Depreciation — fixed-declining balance | cost salvage life period month |
| DDB | Excel 2003 | Depreciation — double-declining | cost salvage life period factor |
| DISC | Excel 2003 | Get discount rate for a security | settlement maturity pr redemption basis |
| DOLLARDE | Excel 2003 | Convert dollar price as fraction to decimal | fractional_dollar fraction |
| DOLLARFR | Excel 2003 | Convert price to fractional notation | decimal_dollar fraction |
| DURATION | Excel 2003 | Get annual duration with periodic interest | settlement maturity coupon yld freq basis |
| EFFECT | Excel 2003 | Get effective annual interest rate | nominal_rate npery |
| FV | Excel 2003 | Get the future value of an investment | rate nper pmt pv type |
| FVSCHEDULE | Excel 2003 | Get future value of principal compound interest | principal schedule |
| INTRATE | Excel 2003 | Get interest rate for fully invested security | settlement maturity investment redemption basis |
| IPMT | Excel 2003 | Get interest in given period | rate per nper pv fv type |
| IRR | Excel 2003 | Calculate internal rate of return | values guess |
| ISPMT | Excel 2003 | Get interest paid for specific period | rate per nper pv |
| MDURATION | Excel 2003 | Get Macauley modified duration par value of $100 | settlement maturity coupon yld freq basis |
| MIRR | Excel 2003 | Calculate modified internal rate of return | values finance_rate reinvest_rate |
| NOMINAL | Excel 2003 | Get annual nominal interest rate | effect_rate npery |
| NPER | Excel 2003 | Get number of periods for loan or investment | rate pmt pv fv type |
| NPV | Excel 2003 | Calculate net present value | rate value1 value2 … |
| ODDFPRICE | Excel 2003 | Get price per $100 odd first period | sd md id fd rate yld redem freq basis |
| ODDFYIELD | Excel 2003 | Get yield security with odd first period | sd md id fd rate pr redem freq basis |
| ODDLPRICE | Excel 2003 | Get price per $100 face value with odd last period | sd md id rate yld redem freq basis |
| ODDLYIELD | Excel 2003 | Get yield of security with odd last period | sd md ld rate pr redem freq basis |
| PDURATION | Excel 2013 | Get periods required to reach given value | rate pv fv |
| PMT | Excel 2003 | Get the periodic payment for a loan | rate nper pv fv type |
| PPMT | Excel 2003 | Get principal payment in given period | rate per nper pv fv type |
| PRICE | Excel 2003 | Get price per $100 face value — periodic interest | sd md rate yld redemption frequency basis |
| PRICEDISC | Excel 2003 | Get price per $100 discounted security | sd md discount redemption basis |
| PRICEMAT | Excel 2003 | Get price per $100 interest at maturity | sd md id rate yld basis |
| PV | Excel 2003 | Get the present value of an investment | rate nper pmt fv type |
| RATE | Excel 2003 | Get the interest rate per period of an annuity | nper pmt pv fv type guess |
| RECEIVED | Excel 2003 | Get amount received at maturity | settlement maturity investment discount basis |
| RRI | Excel 2013 | Get equivalent interest rate for growth | nper pv fv |
| SLN | Excel 2003 | Depreciation — straight-line | cost salvage life |
| SYD | Excel 2003 | Depreciation — sum-of-years | cost salvage life period |
| TBILLEQ | Excel 2003 | Get bond-equivalent yield for a Treasury bill | settlement maturity discount |
| TBILLPRICE | Excel 2003 | Get price per $100 Treasury bill | settlement maturity discount |
| TBILLYIELD | Excel 2003 | Get yield for a Treasury bill | settlement maturity price |
| VDB | Excel 2003 | Depreciation — double-declining variable | cost salvage life start end factor no_switch |
| XIRR | Excel 2003 | Calculate internal rate of return for irregular cash flows | values dates guess |
| XNPV | Excel 2003 | Calculate net present value for irregular cash flows | rate values dates |
| YIELD | Excel 2003 | Get yield for security that pays periodic interest | sd md rate pr redemption frequency basis |
| YIELDDISC | Excel 2003 | Get annual yield for discounted security | sd md pr redemption basis |
| YIELDMAT | Excel 2003 | Get annual yield of security interest at maturity | sd md id rate pr basis |
| Function | Version | Purpose | Arguments |
|---|---|---|---|
| CELL | Excel 2003 | Get information about a cell | info_type reference |
| ERROR.TYPE | Excel 2003 | Test for a specific error value | error_val |
| INFO | Excel 2003 | Get information about current environment | type_text |
| ISBLANK | Excel 2003 | Test if a cell is empty | value |
| ISERR | Excel 2003 | Test for any error but #N/A | value |
| ISERROR | Excel 2003 | Test for any error | value |
| ISEVEN | Excel 2003 | Test if a value is even | value |
| ISFORMULA | Excel 2013 | Test if cell contains a formula | reference |
| ISLOGICAL | Excel 2003 | Test if a value is logical | value |
| ISNA | Excel 2003 | Test for the #N/A error | value |
| ISNONTEXT | Excel 2003 | Test for a non-text value | value |
| ISNUMBER | Excel 2003 | Test for numeric value | value |
| ISODD | Excel 2003 | Test if a value is odd | value |
| ISREF | Excel 2003 | Test for a reference | value |
| ISTEXT | Excel 2003 | Test for a text value | value |
| N | Excel 2003 | Convert a value to a number | value |
| NA | Excel 2003 | Create an #N/A error | |
| SHEET | Excel 2013 | Get sheet index number | value |
| SHEETS | Excel 2013 | Get number of sheets in a reference | reference |
| T | Excel 2003 | Filter text values only | value |
| TYPE | Excel 2003 | Get the type of value in a cell | value |
| Function | Version | Purpose | Arguments |
|---|---|---|---|
| ABS | Excel 2003 | Find the absolute value of a number | number |
| AGGREGATE | Excel 2010 | Return aggregate calculation | function_num options ref1 ref2 … |
| ARABIC | Excel 2013 | Converts a Roman numerals to an Arabic numerals | roman_text |
| BASE | Excel 2013 | Convert number to another base. | number radix min_length |
| CEILING | Excel 2003 | Round a number up to nearest multiple | number significance |
| CEILING.MATH | Excel 2013 | Round a number up to nearest multiple | number significance mode |
| CEILING.PRECISE | Excel 2010 | Round a number up to nearest multiple | number significance |
| COMBIN | Excel 2003 | Get number of combinations without repetitions | number number_chosen |
| COMBINA | Excel 2013 | Get number of combinations with repetitions | number number_chosen |
| DECIMAL | Excel 2013 | Convert a number in a different base to a decimal number | number radix |
| EVEN | Excel 2003 | Round a number up to the next even integer | number |
| EXP | Excel 2003 | Find the value of e raised to the power of a number | number |
| FACT | Excel 2003 | Find the factorial of a number | number |
| FACTDOUBLE | Excel 2003 | Get double factorial of a number | number |
| FLOOR | Excel 2003 | Round a number down to the nearest specified multiple | number significance |
| FLOOR.MATH | Excel 2013 | Round number down to nearest multiple | number significance mode |
| FLOOR.PRECISE | Excel 2010 | Round number down to nearest multiple | number significance |
| GCD | Excel 2003 | Get the greatest common divisor of numbers | number1 number2 … |
| INT | Excel 2003 | Get the integer part of a number by rounding down | number |
| LCM | Excel 2003 | Get the least common multiple of numbers | number1 number2 … |
| LN | Excel 2003 | Get the natural logarithm of a number | number |
| LOG | Excel 2003 | Get the logarithm of a number | number base |
| LOG10 | Excel 2003 | Get the base-10 logarithm of a number | number |
| MDETERM | Excel 2003 | Get matrix determinant of given array | array |
| MINVERSE | Excel 2003 | Get inverse matrix of array | array |
| MMULT | Excel 2003 | Perform matrix multiplication | array1 array2 |
| MOD | Excel 2003 | Get the remainder from division | number divisor |
| MROUND | Excel 2003 | Round a number to the nearest specified multiple | number significance |
| MUNIT | Excel 2013 | Return unit matrix for a given dimension | dimension |
| ODD | Excel 2003 | Round a number up to the next odd integer | number |
| PI | Excel 2003 | Get the value of π | |
| POWER | Excel 2003 | Raise a number to a power | number power |
| PRODUCT | Excel 2003 | Get the product of supplied numbers | number1 number2 … |
| QUOTIENT | Excel 2003 | Returns the quotient without a remainder. | numerator denominator |
| RAND | Excel 2003 | Get a random number between 0 and 1 | |
| RANDBETWEEN | Excel 2003 | Get a random integer between two values | bottom top |
| ROMAN | Excel 2003 | Converts numbers to Roman numerals | number form |
| ROUND | Excel 2003 | Round a number to a given number of digits | number num_digits |
| ROUNDDOWN | Excel 2003 | Round down to given number of digits | number num_digits |
| ROUNDUP | Excel 2003 | Round a number up to a given number of digits | number num_digits |
| SIGN | Excel 2003 | Get the sign of a number | number |
| SQRT | Excel 2003 | Find the positive square root of a number | number |
| SUBTOTAL | Excel 2003 | Get a subtotal in a list or database | function_num ref1 ref2 … |
| SUM | Excel 2003 | Add numbers together | number1 number2 number3 … |
| SUMIF | Excel 2003 | Sum cells in a range that meet criteria | range criteria sum_range |
| SUMIFS | Excel 2007 | Sum cells in a range that meet criteria | sum_range range1 criteria1 range2 criteria2 … |
| SUMPRODUCT | Excel 2003 | Multiply, then sum arrays | array1 array2 … |
| SUMSQ | Excel 2003 | Get sum of squares of supplied values | number1 number2 … |
| SUMX2MY2 | Excel 2003 | Sum of difference of squares in two arrays | array_x array_y |
| SUMX2PY2 | Excel 2003 | Get sum of squares in two arrays | array_x array_y |
| SUMXMY2 | Excel 2003 | Sum of squares of differences in two arrays | array_x array_y |
| TRUNC | Excel 2003 | Truncate a number to a given precision | number num_digits |
| Function | Version | Purpose | Arguments |
|---|---|---|---|
| ACOS | Excel 2003 | Get the inverse cosine of a value, in radians. | number |
| ASIN | Excel 2003 | Return the inverse sine of a value in radians. | number |
| ATAN | Excel 2003 | Get arctangent of a number | number |
| ATAN2 | Excel 2003 | Get arctangent from x- and y-coordinates | x_num y_num |
| COS | Excel 2003 | Get the cosine of an angle provided in radians. | number |
| COSH | Excel 2003 | Get hyperbolic cosine of a number | number |
| COT | Excel 2013 | Get the cotangent of an angle. | number |
| CSC | Excel 2013 | Get cosecant of an angle | number |
| DEGREES | Excel 2003 | Converts radians to degrees | angle |
| RADIANS | Excel 2003 | Converts degrees into radians | angle |
| SEC | Excel 2013 | Get secant of an angle | number |
| SIN | Excel 2003 | Get the sine of an angle provided in radians. | number |
| SINH | Excel 2003 | Get hyperbolic sine of a number. | number |
| TAN | Excel 2003 | Get the tangent of an angle | number |
| Function | Version | Purpose | Arguments |
|---|---|---|---|
| AVEDEV | Excel 2003 | Get sum of squared deviations | number1 number2 … |
| AVERAGE | Excel 2003 | Get the average of a group of numbers | number1 number2 … |
| AVERAGEA | Excel 2003 | Get the average of a group of numbers and text | value1 value2 … |
| AVERAGEIF | Excel 2007 | Get the average of numbers that meet criteria. | range criteria average_range |
| AVERAGEIFS | Excel 2007 | Average cells that match multiple criteria | avg_rng range1 criteria1 range2 criteria2 … |
| BINOM.DIST | Excel 2010 | Get binomial distribution probability | number_s trials probability_s cumulative |
| BINOMDIST | Excel 2003 | Get binomial distribution probability | number_s trials probability_s cumulative |
| COUNT | Excel 2003 | Count numbers | value1 value2 … |
| COUNTA | Excel 2003 | Count the number of non-blank cells | value1 value2 … |
| COUNTBLANK | Excel 2003 | Count cells that are blank | range |
| COUNTIF | Excel 2003 | Count cells that match criteria | range criteria |
| COUNTIFS | Excel 2007 | Count cells that match multiple criteria | range1 criteria1 range2 criteria2 … |
| DEVSQ | Excel 2003 | Get sum of squared deviations | number1 number2 … |
| FORECAST | Excel 2003 | Predict value along a linear trend | x known_ys kown_xs |
| FORECAST.ETS | Excel 2016 | Predict value with a seasonal trend | target_date values timeline seasonality data_completion aggregation |
| FORECAST.ETS.CONFINT | Excel 2016 | Get confidence interval for forecast value at given date | target_date values timeline confidence_level seasonality data_completion aggregation |
| FORECAST.ETS.SEASONALITY | Excel 2016 | Get length of the seasonal pattern | values timeline data_completion aggregation |
| FORECAST.ETS.STAT | Excel 2016 | Get statistical value related to forecasting | values timeline statistic_type seasonality data_completion aggregation |
| FORECAST.LINEAR | Excel 2016 | Predict value along a linear trend | x known_ys kown_xs |
| FREQUENCY | Excel 2003 | Get the frequency of values in a data set | data_array bins_array |
| GEOMEAN | Excel 2003 | Calculate geometric mean | number1 number2 … |
| HARMEAN | Excel 2003 | Calculate harmonic mean | number1 number2 … |
| INTERCEPT | Excel 2003 | Get intercept of linear regression line | known_ys known_xs |
| LARGE | Excel 2003 | Get nth largest value | array k |
| LINEST | Excel 2003 | Get parameters of linear trend | known_ys known_xs const stats |
| MAX | Excel 2003 | Get the largest value | number1 number2 … |
| MAXA | Excel 2003 | Return largest value. | value1 value2 … |
| MAXIFS | Excel 2019 | Get maximum value with criteria | max_range range1 criteria1 range2 criteria2 … |
| MEDIAN | Excel 2003 | Get the median of a group of numbers | number1 number2 … |
| MIN | Excel 2003 | Get the smallest value. | number1 number2 … |
| MINA | Excel 2003 | Return smallest value. | value1 value2 … |
| MINIFS | Excel 2019 | Get minimum value with criteria | min_range range1 criteria1 range2 criteria2 … |
| MODE | Excel 2003 | Get most frequently occurring number | number1 number2 … |
| MODE.MULT | Excel 2010 | Get most frequently occurring numbers | number1 number2 … |
| MODE.SNGL | Excel 2010 | Get most frequently occurring number | number1 number2 … |
| NORM.DIST | Excel 2010 | Get values and areas for the normal distribution | x mean standard_dev cumulative |
| NORM.INV | Excel 2010 | Get the inverse of normal cumulative distribution | probability mean standard_dev |
| NORM.S.DIST | Excel 2010 | Get the standard normal CDF and PDF. | z cumulative |
| NORM.S.INV | Excel 2010 | Get inverse of the standard normal cumulative distribution | probability |
| PERCENTILE | Excel 2003 | Get kth percentile | array k |
| PERCENTILE.EXC | Excel 2010 | Get kth percentile | array k |
| PERCENTILE.INC | Excel 2010 | Get kth percentile | array k |
| PERCENTRANK | Excel 2003 | Get percentile rank, inclusive | array x significance |
| PERCENTRANK.EXC | Excel 2010 | Get percentile rank, exclusive | array x significance |
| PERCENTRANK.INC | Excel 2010 | Get percentile rank, inclusive | array x significance |
| PERMUT | Excel 2003 | Get number of permutations without repetitions | number number_chosen |
| PERMUTATIONA | Excel 2013 | Get number of permutations with repetitions | number number_chosen |
| QUARTILE | Excel 2003 | Get the quartile in a data set | array quart |
| QUARTILE.EXC | Excel 2010 | Get the quartile in a data set | array quart |
| QUARTILE.INC | Excel 2010 | Get the quartile in a data set | array quart |
| RANK | Excel 2003 | Rank a number against a range of numbers | number ref order |
| RANK.AVG | Excel 2010 | Rank a number against a range of numbers | number ref order |
| RANK.EQ | Excel 2010 | Rank a number against a range of numbers | number ref order |
| SKEW | Excel 2003 | Get skewness of a distribution | number1 number2 … |
| SKEW.P | Excel 2013 | Get skewness of a distribution based on population | number1 number2 … |
| SLOPE | Excel 2003 | Get slope of linear regression line | known_ys known_xs |
| SMALL | Excel 2003 | Get nth smallest value | array k |
| STANDARDIZE | Excel 2003 | Calculate a normalized value (z-score) | x mean standard_dev |
| STDEV | Excel 2003 | Get the standard deviation in a sample | number1 number2 … |
| STDEV.P | Excel 2010 | Get standard deviation of population | number1 number2 … |
| STDEV.S | Excel 2010 | Get the standard deviation in a sample | number1 number2 … |
| STDEVA | Excel 2003 | Get standard deviation in a sample | number1 number2 … |
| STDEVP | Excel 2003 | Get standard deviation of population | number1 number2 … |
| STDEVPA | Excel 2003 | Get standard deviation for a population | number1 number2 … |
| TRIMMEAN | Excel 2003 | Calculate mean excluding outliers | array percent |
| VAR | Excel 2003 | Get variation of a sample | number1 number2 … |
| VAR.P | Excel 2010 | Get variation of population | number1 number2 … |
| VAR.S | Excel 2010 | Get variation of a sample | number1 number2 … |
| VARA | Excel 2003 | Get variation of a sample | number1 number2 … |
| VARP | Excel 2003 | Get variation of a population | number1 number2 … |
| VARPA | Excel 2003 | Get variation of a population | number1 number2 … |
| Function | Version | Purpose | Arguments |
|---|---|---|---|
| ENCODEURL | Excel 2013 | Get URL-encoded string | text |
| FILTERXML | Excel 2013 | Get data from XML with Xpath | xml xpath |
| WEBSERVICE | Excel 2013 | Get data from a web service | url |
| Function | Version | Purpose | Arguments |
|---|---|---|---|
| DAVERAGE | Excel 2003 | Get average from matching records | database field criteria |
| DCOUNT | Excel 2003 | Count matching records in a database | database field criteria |
| DCOUNTA | Excel 2003 | Count matching records in a database | database field criteria |
| DGET | Excel 2003 | Get value from matching record | database field criteria |
| DMAX | Excel 2003 | Get max from matching records | database field criteria |
| DMIN | Excel 2003 | Get min from matching records | database field criteria |
| DPRODUCT | Excel 2003 | Get product from matching records | database field criteria |
| DSTDEV | Excel 2003 | Get standard deviation of sample in matching records | database field criteria |
| DSTDEVP | Excel 2003 | Get standard deviation of population in matching records | database field criteria |
| DSUM | Excel 2003 | Get sum from matching records | database field criteria |
| DVAR | Excel 2003 | Get sample variance for matching records | database field criteria |
| DVARP | Excel 2003 | Get population variance for matching records | database field criteria |
The complete Excel Functions list includes lookup, logic, date and time, text, information, and math functions with examples. Excel Functions are built-in presets, so Excel functions are hard-coded formulas with short, user-friendly names.
The list contains 300+ built-in Excel functions. Furthermore, look at the library of useful advanced functions (UDFs). If you want to jump to a specific category, use the list below; else, use the Search box for the latest tutorials.
- User-defined functions (must-have)
- Logical
- Text
- Lookup
- Date and Time
- Dynamic array
- Information
- Math
- Statistical
- Financial
Excel Function List
Logical
The functions below use logical tests and logical operators to evaluate a formula. Learn more about Boolean expressions.
LOOKUP
Here is the list of lookup functions in Excel. Of course, we already know that XLOOKUP changes everything. But it is worth keeping in mind the older lookup functions too.
User-defined functions
UDFs are advanced functions.
Date and Time
Date and Time functions help you create calculations based on dates and times.
Text
Text functions in Excel enable you to perform various calculations using strings.
Dynamic Array
Dynamic Arrays are resizable arrays. From now, Excel calculates the array automatically and returns values into multiple cells based on a formula entered in a single cell.
Information
Take a quick overview of information functions in Excel.
Math
Math Functions are great.
Math – Part 2
Financial
Use financial functions if you want.
Financial – Part 2
Statistical
Statistical – Part 2
Trigonometry
Engineering
Database
How to use Excel Functions?
To use a function, type an equal sign (=) in the formula bar or the cell to enter a function you want to use. After that, enter the function’s name and the arguments. There are custom functions in Excel, user-defined functions. If you want to learn more about how to solve complex tasks using UDFs, read our guide.


