Project Online Desktop Client Project Professional 2021 Project Standard 2021 Project Professional 2019 Project Standard 2019 Project Professional 2016 Project Standard 2016 Project Professional 2013 Project Standard 2013 Project 2010 Project Standard 2010 Project 2007 Project Standard 2007 More…Less
When you add lead time to a task, work on that task overlaps work on its predecessor. When you add lag time, you delay the start time of the successor task. Before you can start adding lead or lag time, you need to create a dependency between the two tasks.
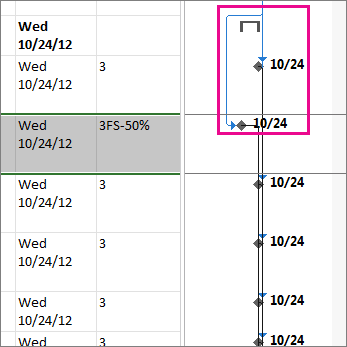
Here’s how lead time looks in a Gantt chart:
Add lead or lag time
-
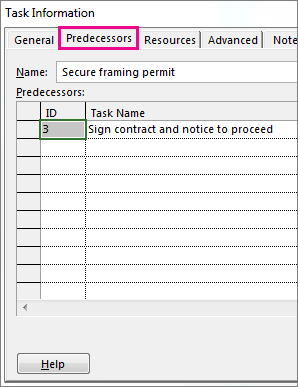
Double-click a task name, and then click the Predecessors tab in the Task Information box.
 ©
© -
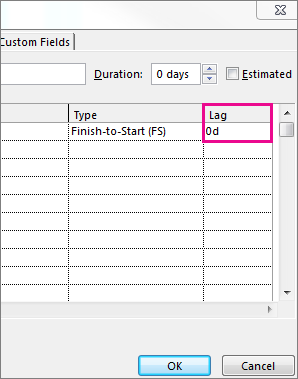
In the Lag column, type the lead time or lag time you want.
-
To add lead time, type a negative number or a negative percentage (for example, —50%).
Lead time is an overlap between two tasks, where those two tasks share a dependency (a relationship between tasks). For example, if you want the second task to start even though the first task is only half complete, create a finish-to-start dependency between the two tasks, and then add a lead time of 50 percent for the second task.
-
To add lag time, type a positive number or percentage (for example, 2d).
Lag time creates a delay between two tasks that share a dependency. For example, if you want a 2 day delay between the end of the first task and the start of the second, create a finish-to-start dependency between the two tasks, and then add 2 days of lag time before the start of the second task.
-
 ©
©
These instructions are specific to Microsoft Project 2007.
Add lead or lag time
Lead time and lag time can be entered either as a duration (for example, two days after the completion of the task) or as a percentage of the duration of the predecessor task (for example, begin the task when the predecessor’s duration is 50% complete).
-
On the View menu, click Gantt Chart.
-
In the Task Name field, select the task for which you want to set lead time or lag time, and then click Task Information
. -
Click the Predecessors tab.
-
In the Lag field, type the lead time or lag time that you want, either as a duration or as a percentage of the duration of the predecessor task:
-
To enter lead time, type either a negative number or a negative percentage (such as -2d for two days of lead time).
-
To enter lag time, type either a positive number or a positive percentage (such as 50% for half of the predecessor task’s duration in lag time).
-
 .
.Notes:
-
You can set lead time or lag time between a maximum of two tasks, and the lead or lag time must be set after a dependency is created between those tasks.
-
You can quickly add lead time or lag time to a successor task by double-clicking the link line on the Gantt Chart view and then typing the amount or percentage of lead time or lag time in the Lag field.
Need more help?
Want more options?
Explore subscription benefits, browse training courses, learn how to secure your device, and more.
Communities help you ask and answer questions, give feedback, and hear from experts with rich knowledge.
Cajuns2009
New Member
- Joined
- May 14, 2015
- Messages
- 1
-
#1
Hello Everyone!
I could use some help figuring out a way to make a good lead and easy lead time formula. Long story short, If I am ordering a piece of fabric and the lead time is 10-12 weeks. I would like to be able to insert 10 to 12 weeks, and excel show me the dates that would fall under for real time. I was thinking of using something like the =networkdays but I am just to confused. I would like it to make sure the dates don’t fall on weekends or holidays if that is possible,
So for instance today being 7/14/16
| Lead Time | Estimated Arrival | |
| 4 weeks | 6 weeks | 8/25/2016 |
| 10 weeks | 12 weeks | 10/6/2016 |
<tbody>
</tbody>
Thank you guys so much for the help!
Takt Time, Cycle Time, and Lead Time are important time measurements used by managers in companies and factories to help them:
- better understand where to make improvements in the process of product production
- better understand where to make improvements in resource use
- better understand where to make improvements in team workflow
Each of the listed time measurements is distinct from the other two. Yet, people often confuse the three.
So, what is Takt Time?
What is Cycle Time?
What is Lead Time?
How do we measure and calculate them?
And how do they relate to one another?
Here’s everything you need to know + useful calculators you can use to easily calculate your Takt Time, Cycle Time, and Lead Time in Excel.
TAKT TIME
What is Takt Time?
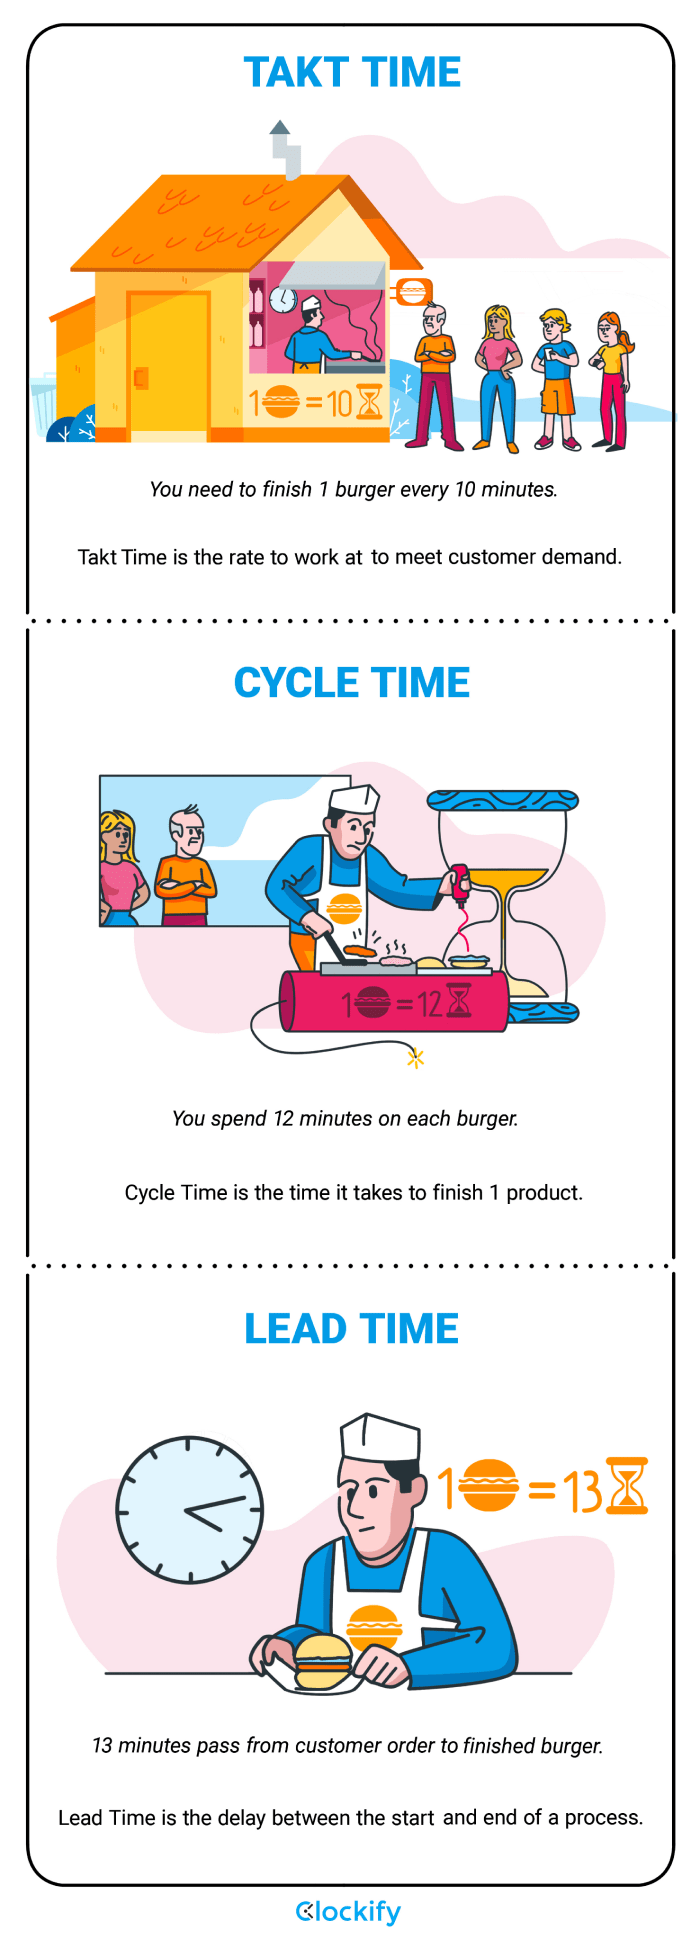
According to the Takt Time definition, Takt Time is the “takt” rate at which you need to work and finish the production process in order to meet customer demand.
Let’s look at a rough example, to illustrate:
If one customer buys 1 product every 2 hours, then you have 2 hours to finish 1 product — 2 hours is your Takt Time. In line with that, finishing 1 product every 2 hours is your takt rate.
Knowing your Takt Time will help you optimize your production process in such a way that you meet the realistic customer demand — if you follow your expected takt rate, you won’t make less or more products that you actually need.
Takt Time originated in the German aircraft industry in late 1930. The name for this concept originates from the German word “takt”, which stands for “beat”, “rhythm, ”or “pulse” — the entire phrase originated from the German word “Taktziel” (which literally translates to “Takt Time”). The company Toyota took on the concept used by the German aircraft industry and reinvented it to the Takt Time concept we know and implement today.
How to calculate Takt Time?
There are two components crucial for your Takt Time calculation:
- Your Net Production Time (NPT)
- Your Customer Demand
The Net Production Time (NPT) is the clean time your team has at their disposal to finish a product. To calculate your NPT, you can subtract the time your team spends on downtime (lunch breaks, other breaks, meetings, machine maintenance…) from the total time your team spends at work. That’s how the formula usually goes.
However, it would be quicker if you were to track only the clean time you spend on the production process. You can use our time tracker Clockify to track your Net Production Time for a product and separate it from your downtime. Now, tracking the time you spend on downtime may not be crucial for your Takt Time calculations, but it can be useful on its own — you may find that you waste a lot of time, time you could be putting to better use.
Your Customer Demand is the number of products your customers buy on a regular basis — usually, your customer demand is counted on a daily basis.
And here is the formula:
Takt Time = Net Production Time/Customer Demand
Now, this formula is simple enough. However, your calculation will be more complicated if your company produces several different products, each with its own customer demand. In such a case, you’ll need to divide your day across different production processes or create separate teams for each type of product.
ℹ️
You can easily overcome this challenge with a project time tracker, by tracking Net Production Time for the production processes of the different products separately (by creating separate projects for each product), or by tracking time per team (by creating separate workspaces, where each workspace holds one team).
Takt Time example ( + Takt Time calculator in Excel)
Say you manage a raggedy doll factory, and you want to know how to calculate the Takt Time for Team #1, responsible for making Doll #1 (Jessica) on a daily basis.
Say that Team #1 needs to assemble 55 dolls during a 10-hour shift – and your time tracking results show that you spend a clean 9 hours and 10 minutes (550 minutes) of that 10-hour shift working on product production:
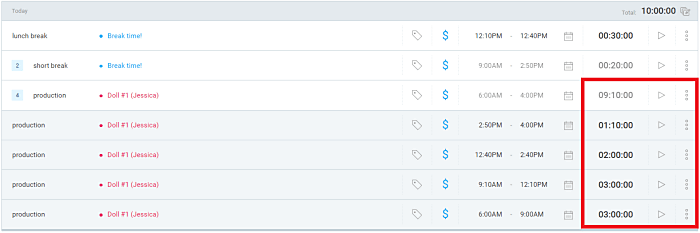
Net Production Time = 550 minutes
Daily Customer Demand = 55 dolls
Takt Time = Net Production Time/ Daily Customer Demand
Takt Time = 550 minutes/ 55 dolls = 10 min/doll
So, according to this calculation, Team #1 is expected to assemble one Doll #1 (Jessica) per 10 minutes (600 seconds), in order to meet the Customer Demand.
Takt Time calculator in Excel — You can use this calculator to calculate the takt rate at which you need to work to meet customer demand.
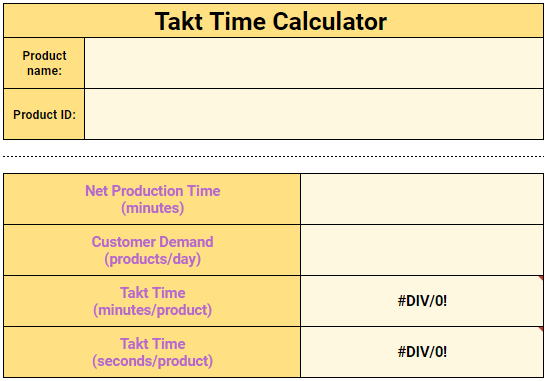
🔽 Click here to DOWNLOAD Takt Time calculator in Excel
CYCLE TIME
What is Cycle Time?
According to the Cycle Time definition, Cycle Time is the time it takes you to complete the production process of one product, from start to finish.
Cycle Time vs Throughput Time
To better understand Cycle Time, it’s best that we relate it to Throughput Time.
Throughput Time is the number of units you produce in the production process during a specific period of time.
In line with that, Cycle Time is the average amount of time you need in order to produce one unit.
For example, during a specified period of time (once again, this is your Net Production time, and let’s say it equals 60 minutes) you produce 6 units — 6 units per 60 minutes, this is your Throughput Time. We can further conclude that it takes you 10 minutes to produce one unit during that 60 minutes (6 X 10 = 60) — 10 minutes per product, this is your Cycle Time.
How to measure Cycle Time?
The Total Cycle Time formula takes into account your Net Production Time and the number of units you produce during this time — all for the purpose of singling out the amount of time you really spend producing one unit.
Cycle Time = Net Production Time/Number of Units made
Cycle Time example (+ Cycle Time Calculator in Excel)
Let’s take the doll factory example once again, and look at the Cycle Time for Doll# 1 (Jessica). We’ll take the same Net Production Time, and assume that 45 dolls are really made during this time:
Net Production Time = 550 minutes
Number of units made = 45 dolls
(Daily Customer Demand = 55 dolls)
Cycle Time = Net Production Time/Number of units made
Cycle Time = 550 minutes/ 45 dolls = 12,22 minutes/doll
Further observations about this Cycle Time example
Currently, with a Cycle Time of 12,22 minutes, you’re running 2,22 minutes behind for each doll — considering that your Cycle Time is longer than your Takt Time.
In the end, that builds up to 672,1 minutes you’d need to meet customer demand, making you about 2 hours and 2 minutes short in total each day ((672,1 – 550) / 60). In other words, you’re currently falling short of your customer demand by 10 Jessica dolls.
However, having a shorter Cycle Time than your Takt Time is also a problem. If this is the case, you may be producing more dolls than you need to meet customer demand.
For example, say that your Cycle Time is 7,34 minutes for each doll, and you maintain this cycle for the expected 550 minutes.
By the time only 403,7 minutes have elapsed (7,34 X 55) you will have met your daily customer demand. If you continue at this pace, you’ll eventually assemble about 75 dolls (550 / 7,34), surpassing your daily customer demand by 20. So, if you continue working at this pace, you’ll get stuck with 20 more Jessica dolls in your storage space every day.
In conclusion, it would be ideal if your Takt Time and Cycle Time were equal.
Takt Time vs Cycle Time: How to sync the two
In order to meet your customer demand, you’ll need to make some tweaks in your workflow, and adjust your Cycle Time to your ideal Takt Time.
Use time management and productivity techniques to make sure you speed up your work process and consider hiring more workers, to better meet the customer demand.
As suggested earlier, you can also track your downtime as a separate project, and analyze whether you could allocate some of that time to the production process.
For example, if you spend 50 minutes on routine daily meetings, perhaps you can cut them in half, and allocate the other 25 minutes to production time.
Cycle Time calculator in Excel — You can use this calculator to calculate your Cycle Time, in order to compare it with your Takt Time and decide whether you’re pacing your production process well.
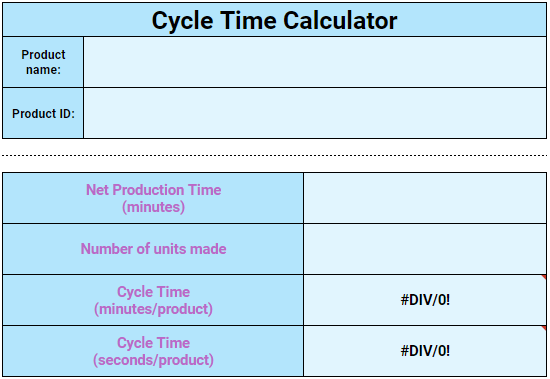
🔽 Click here to DOWNLOAD Cycle Time calculator in Excel
LEAD TIME
What is Lead Time?
In general, Lead Time is the delay that occurs between the initiation and completion of a process. When it comes to the exact definition of Lead Time, there are several varying answers that depend on the industry.
Most prominently, Lead Time is used in manufacturing, supply chain management, and project management:
- In manufacturing, Lead Time involves pre-processing time (the time needed to make plans and handle paperwork), processing time (the time needed to manufacture the product), and post-processing time (the time needed to deliver the product to the customer).
- In supply chain management, Lead Time involves the time that passes between the moment you place an order for supplies, to the moment the supply delivery arrives from the supplier.
- In project management, Lead Time involves the time it takes to complete a set of tasks in a project. It involves the dependency between activities and points to overlaps between the two.
Lead Time in manufacturing is the Lead Time linked to Takt Time and Cycle Time, so we’ll mostly focus on it. But, we’ll also illustrate Lead Time in project management and supply chain management, to explain the differences between these three main types of Lead Time.
How to measure Lead Time?
How to measure Lead Time (manufacturing)
In order to measure your Lead Time in manufacturing, you’ll need to consider the time you spend on pre-processing, processing, and post-processing activities.
Bear in mind that you can parse your pre-processing, processing, and post-processing activities into even smaller units of time, for better clarity:
- Order Lead Time — the time that elapses between the time you receive the customer order to the time the customer order is delivered.
- Order Handling Lead Time — the time that elapses between the time you receive the order and the time when you create an official sales order request.
- Manufacturing Lead Time — the time that elapses from the sales order request to completed production.
- Production Lead Time — the time that elapses from the start of physical production to completed production.
- Delivery Lead Time — the time that elapses from finished production to product delivery to the customer.
As you’ve probably noticed, some of these Lead Times overlap — And, Order Lead Time encompasses all the process stages. And here’s the final formula:
Lead Time (manufacturing) = Pre-processing time + Processing time + Post-processing time
Manufacturing Lead Time example (+ Lead Time Calculator in Excel)
Let’s see how you can calculate your Lead Time for Doll Type #1 (Jessica).
You’ll need to think about your pre-processing, processing, and post-processing times in order to carry out the calculations.
Say that your pre-processing time involves receiving the orders, reviewing the number of orders for that day, and making sales requests to your production team. You track time on all these activities and see that they take 10 minutes to complete for each order. Roughly speaking, this pre-processing time involves Order Handling Time and Manufacturing Lead Time.
Your processing time is your Cycle Time, which should ideally match your Takt Time. You’ve worked on tweaking your workflow, and now your time tracking results show that your processing time for each product equals the perfect 10 minutes you need to finish 55 products in a day. Roughly speaking, this processing time involves Manufacturing Lead Time and Production Lead Time.
Let’s say that you deliver the Jessica dolls every day to the customers’ home addresses. Roughly speaking, this post-processing time involves Delivery Lead Time, and it takes you up to 1 day for each product.
Pre-processing time = 10 minutes
Processing time = 10 minutes
Post-processing time = 1 day (1440 minutes)
Lead Time (manufacturing) = Pre-processing time + Processing time + Post-processing time
Lead Time (manufacturing) = 10 minutes + 10 minutes + 1440 minutes = 1460 minutes
So, the Lead Time for the Jessica doll says that the customer can count on receiving the doll 1460 minutes from the time of order.
Now, depending on the complexity of your production process, and whether you ship your products to distant cities or abroad, you can also count your Lead Time in hours or days.
Lead Time Calculator in Excel — You can use this calculator to calculate your Lead Time, to understand how long customers usually need to wait from the moment they order a product.
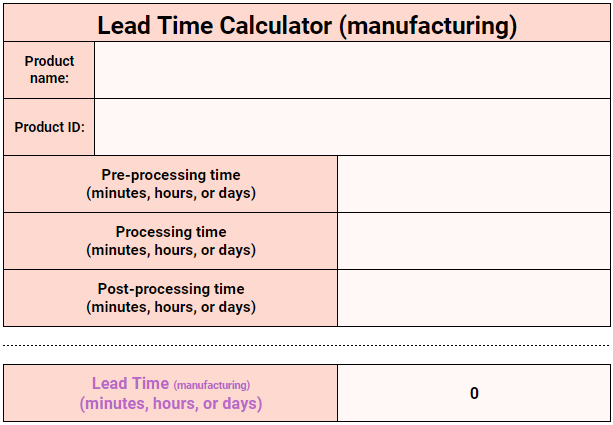
🔽 Click here to DOWNLOAD Lead Time calculator in Excel
Lead Time vs Cycle Time
Now, as previously mentioned, the Lead Time used in manufacturing is the time component usually associated with Takt Time and Cycle Time. Namely, as Lead Time encompasses the time from product order to product delivery, it also includes Cycle Time as a vital sub-component (Cycle Time = processing time).
Takt Time + Cycle Time + Lead Time Calculator — You can use this calculator to calculate your Takt Time, Cycle Time, and Lead Time, all in one place, and then make conclusions about the processes associated with your product. Is your Cycle Time too long? Is your Takt Time realistic? Is your Lead Time short enough to satisfy your customers’ expectations? Find out in a couple of clicks.
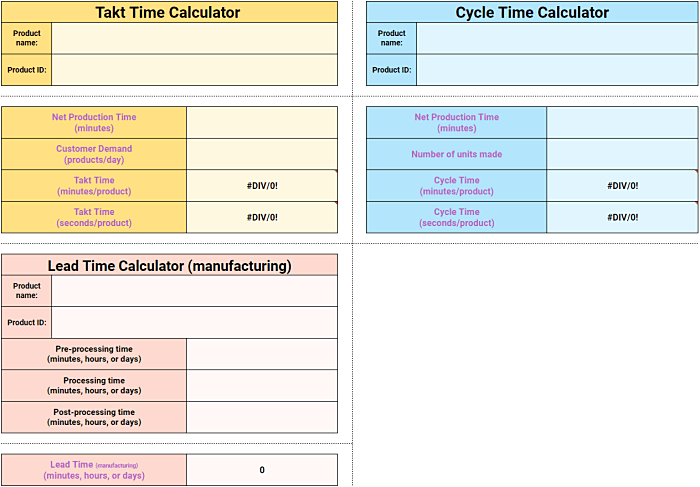
🔽 Click here to Download Takt Time + Cycle Time + Lead Time calculator
How to measure Lead Time (supply chain management)
Now, Lead Time in supply management is the time needed to procure supplies that are vital for the production processes.
Mathematically speaking, Lead Time (supply chain management) is the sum of the supply delay and the reordering delay that may occur from the moment you order the supplies, to the moment you receive them from the supplier.
Supply delay involves the amount of time it takes to have your supplies replenished by the suppliers. In order to minimize supply delay, you’ll need to anticipate the amount of supplies that will be consumed in the production process between today and your next replenishment.
Reordering delay is the time that needs to elapse before you’re able to place a reorder of supplies (this may happen because the supplier accepts supply reorders only once a week or month).
And here is the formula:
Lead Time (supply chain management) = Supply Delay + Reordering Delay
Supply chain management Lead Time example
Let’s say you manage a restaurant, and you need fresh exotic fruit delivered regularly. Now, you can only make reorders for exotic fruits from your supplier on the 1st of each month.
Each new shipment of fruits takes 5 days to arrive — this is your supply delay.
Each new order you make needs to last for 30 or 31 days. Let’s say that it’s January and that you’re looking at 31 days before the next reordering — 31 days is your reordering delay.
Supply delay = 5 days
Reordering day = 31 days
Lead Time (supply chain management) = Supply Delay + Reordering Delay
Lead Time (supply chain management) = 5 days + 31 days = 36 days
That’s 36 days of Lead Time that make sure you never run out of fresh exotic fruits for your restaurant.
Depending on your supplier’s speed and reordering policy (some suppliers may allow reordering every day, at a specific time), you may also count supply and reordering delay in hours.
How to measure Lead Time (Project management)
In order to finish a project, you’ll likely need to handle sets of related tasks.
Sometimes, the start of Task 2 will depend on and won’t be able to occur before the completion of Task 1.
In other cases, however, the start of Task 2 will happen before the end of Task 1, as they both need to end at the same time, and we’ll see an overlap between the two tasks — the time when the two tasks overlap is the Lead Time in project management.
Lead Time (project management) = Time for Task 1 – Time for Task 2
Project management Lead Time example
Let’s say that you want to do the electrical work (Task 1, expected to last for 5 days) and paint the walls (Task 2, expected to last for 2 days) for the two bedrooms in your house.
You carry out the electrical work in one bedroom and finish it in 2 days.
As you move to the second bedroom to carry out the electrical work, you start painting the walls in the first room.
The time you spend carrying out electrical work in the second room and painting the walls in the first room represents the overlap between the two activities and is your Lead Time.
Task 1 = 5 days
Task 2 = 2 days
Lead Time (project management) = Time for Task 1 – Time for Task 2
Lead Time (project management) = 5 days – 2 days = 3 days
Depending on the general time you need to carry out the tasks in your projects, you may also count time for your tasks in minutes or hours.
Differences between the three Lead Times
Now, although the Lead Time in manufacturing is usually the one directly associated with Takt Time and Cycle Time, common sense implies that you’ll need to reorder supplies (perhaps the fabric for your raggedy dolls) to keep the production process moving. Moreover, certain production tasks will likely overlap. This means that Lead Time in manufacturing, supply chain management, and project management are all intertwined, at least to an extent.
Wrapping up…
As evident from the names of the concepts, Takt Time, Cycle Time, and Lead Time are all about time. Days, hours, minutes, or seconds, it doesn’t matter. What matters are speed and quality. Being fast and meticulous enough to meet customer demand and expectations. So, make sure you analyze how you spend time at work and think about how you can improve on it. You can either speed up your work processes or eliminate the time you know you waste. Or, do both, and ensure your business.
How To Calulate Lead Time Based On Work Days — Excel |
|
I’m trying to determine how to calculate lead time based on work days.
Initial Date: 6/1/09 (Cell B66)
Lead Time: 72 business days (Cell C68)
X: This is what I’m trying to solve for, which would be 72 business days from B66 (Cell D68).
Desired output is date format of B66+C68 with only business days
Note: I am using add-in Analysis Tool Pack
Thanks!
![]()
Excel VBA Course — From Beginner to Expert
200+ Video Lessons
50+ Hours of Instruction
200+ Excel Guides
Become a master of VBA and Macros in Excel and learn how to automate all of your tasks in Excel with this online course. (No VBA experience required.)
(80% Discount Ends Soon!)
View Course
Similar Topics
Is there a way to calculate the average days between a column of dates?
Basically, I’ve got a sheet that contains a table of entries, and each entry gets a date stamp in the first column. I would like to have the sheet display the average time, in days, between entries. Is this possible?
Thank you in advance!
~cp

Very new in this board. If I post this question in the wrong forum please bear with me.
There is about 20 staffs in our department and I have made a spreadsheet with 12 tabs for each month of the year Jan-Dec. If each staff have 15 days annual leave each year and how can I make a formular that can automatically calculate the balance of annual leave and entered in the tabs of the following months. For example if staff A used 5 days in Jan how can the balance of 10days be entered in the tabs from Feb-Dec. If he use another 5 days in July the remain balance of 5 days be automatically entered in the tab from Aug to Dec. Likewise if staff A took 2 days sick leave in Jan, and 2 days in Mar how can this sick days be automatically sum up in the months after. I am doing this manually at the moment and it is very time consuming and also very easy to make mistake.
Thanks and sorry for this long questions
I’m trying to come up with a solution to calculate the man hours and days worked over multiple sheets.
I have a file that has 8 sheets. the first seven sheets are the days of the week and the 8th sheet is where I want to calculate the hours.
The days of the week consists of «Name» «Date» Hours»
The 8th sheet consists of «Name», «Days of the week in their own column (7 columns in total)», «Total Hours» and «Total Days Worked»
Now… each day is always a different group and what I’m hoping for is to create a formula that can grab each name with their hours and throw them into the 8th sheet. So when the end of the week is done I have all the Employees weekly hours and days worked all finished.
I hope this makes sense. This file is to track about 100 employees that are on a rotational work schedule.
I have attached a sample file.
Thanks in advance for your help.
I need a formula to calculate Turn Around Time. Find below the sample data and details for your reference.
Received Date & Time: 10/29/2010 3:27:00 PM
Completed Date & Time: 11/1/2010 3:57:32 AM
Business Hours: 08:00 AM to 05:00 PM
Non Business hours: 05:00 PM to 08:00 AM
Weekdays : Monday to Friday
Weekends: Saturday & Sunday
If I calculate TAT for this time period it should show me 1 hour 33 minutes, why because business hours are closing by 5:00 PM on 10/29 so it should not calculate duration after 5:00 PM to until 08:00 AM on next day, however 10/29 is Friday so formula should calculate the duration from 10/29 Friday 3:37 PM to 10/29 5:00 PM and again it should calculate from 8:00 AM on 11/01 Monday and formula should skip Saturday & Sunday.
In this scenario I have completed the task before 8:00 AM on 11/01 so it should show duration of 1hour 33 minutes.
Please let me know if you need any more details
Good afternoon!
I’m working with Excel 2003 sp 3 on Windows xp.
I have been banging my head trying to jar loose the formula to calculate man days where 1 equals 8 hours. I have one that was given to me by a coworker:
=INT(Q3/8)+(((Q3/8)-(INT(Q3/8)))*0.8)
That calculates man days from total hours. I need a formula that will total man days and return the man day answer. Example:
weekending 12/25 = 16.2 which is 16 man days and 2 hours
weekending 1/1 = 24.7 which is 24 man days and 7 hours
Total = 41 man days and 1 hour
I have also been asked if there was a way for a number to be entered into a spreadsheet and automatically put in order without a macro or «pushing a button».
Any advice is greatly appreciated!
Happy New Year!
~ Brenda ~
Hello,
I have two columns of data: column A contains the date and time in the form dd/mm/yyyy. Column B contains a number value. All the times are in order, so column A looks like:
01/01/2007
02/01/2007
03/01/2007
I have data from 2007 to 2010. I need to calculate an average daily value (in column B) for each month, and display it in column C. So, for January, I need to calculate the average of 31 days, February, 28 days, etc.
Is there a function I can use to do this? I’ve been trying the AVERAGEIF formula but can’t get it to work. Any ideas would be much appreciated!
Many thanks,
Caitlin
I have a spreadsheet counting down the days until a date is reached. However, after that date is reached and passed I get a #NUM! error.
What can I do to countdown the days as below AND countdown the days that have passed as a NEGATIVE NUMBER???
=DATEDIF(NOW(),D11,»D»)
Hello, please help me out with this one.
So I am at work workin on this report and I need a function that will make Excel automatically insert the today’s date in a cell (let’s say D90) when I fill the content of another cell (for example C90) and the that will be inserted will never change. I tried to use the =TODAY( ) function but it keeps updating the date in the cell to the current date if i reopen the worksheet 2 days later. I need the cell to keep in the cell the date of the day when I filled in the content of cell C90 and do not updated it every time i open the document to the actual date.. Thanks in advance!!
HI…can anyone help me with a formula for aging data in days (to be aged based on current date vs. for eg., Invoice date)
I was able to convert start date and and end date to the number of days
inbetween the two dates. Does anyone know how to then convert the number of
days into months?
I use Excel 2000
I have sheet muster for my clients of January, 2005 like :
( P = Present, A=Absent )
A…..B…..C…..D…..
Days Sun Mon Tue Wed
Date 1 2 3 4
1 John P A A P
2 Lucy A P P A
3
Now I want to calculate the total Sundays, Mondays, Tuesdays etc. present in
that month. How can I do this?
—
Knowldege is Power
I’m trying to format a worksheet to show how many days overdue certain tasks are, and running into a couple of issues. The sheet is set up with Due Dates in Column A, Days Overdue in Column B, and Date Completed in Column C. My first thought was just to use as simple a formula as possible in Column B =Today()-A2. This worked alright for tasks that already had Due Dates assigned, but if Column A was blank I’d get a high number in Column B. I also realized that tasks will continue to show as overdue even after I enter the completed-on date in Column C. Is there a relatively simple way to tackle this formula? Thanks in advance for suggestions. (I’ve attached an example with the column headings I want to use.)
I have attached a schedule for shift allowance calculation. The conditions for payment are as follows:
3 & 4 shifts = 15% Basic
2 shifts = 10% Basic
If on leave for 21 working days or more, no shift allowance
If on leave for less than 21 working days and on 3 or 4 shifts, shift allowance prorated as (Basic*15%)/21*(diff. btw 21 and no of days leave observed)
If on leave for less than 21 working days and on 2 shifts, shift allowance prorated as (Basic*10%)/21*(diff. btw 21 and no of days leave observed)
The formular I used in the attached worked but the only problem is that I had to sort by no. of shifts and adjust the formular first. I need A formular that does not require sorting. I tried to combine IF, AND, OR formulae but I got error. Please assist me sort this out. Thanks a bunch.
I am using the following formula to calculate the number of days between a date and the current date: =DATEDIF(A1,TODAY(),»d») What do I add to the formula to leave cell blank if no date is entered in the cell for calculation.
From limited experience I know that excel calculates dates via serial numbers.
I have formulas to add a number of days to a cell containing an entered date and display the resulting new date (ie. 03/01/2011 (c34)+11 = 03/12/2011)
I am seeking to leave resulting formula cell blank until a date is entered in the input cell. Currently when the input cell is empty the formula cell obviously displays 1/11/1900 using the above example.
What conditional format would achieve leaving the formula cell blank until date data in entered into the source cell?
Hopefully a simpler question for your experience level than mine.
A previous poster explained what I also need; there were no responses,
so I thought I would try again.
Does anyone know of an Excel template—or a small stand-alone
program—that will calculate the interest/principal breakdown when
payments are varied in amount and frequency? Free or low-cost, please.
I need one that will work on my Mac/Office 2004. I will need to print
out periodic reports.
Here is the way the previous poster described it:
«Excel template: Loan Amortization for random/irregular payments,
figures days
between payment dates.
I have a loan with a variable beginning balance and irregular payments
with
annual large payment. (based on collections)
Would like to enter payment and date.
then Excel would figure days since last payment, interest amount,
principal
amount, Ending Principal balance.
And total interest paid, total pricipal paid
If I change the starting principal, excel would recalculate all
entries.»
Thanks very much.
I did a bit of browsing on this problem. Found others suffering the same but haven’t found any conclusive answer yet.
Every so often when I attempt to save a file, (including save as), Excel won’r let me. By won’t let me I mean:
using Save doesn’t appear to do anything
using Save As doesn’t either do anything, the dialog is not displayed and if I am doing via the File menu then the File menu is exited and the previous ribbon tab is displayed (i.ethe one I was on before clicking ‘File’)
if I close the workbook I am prompted to save, close without saving or cancel. Clicking save just invokes the same msgbox again.
I can’t work out when it goes into this mode. Some days I can work without this problem, other days I encounter this 2 or 3 times.
The only thing I could suspect was I think this started around about the time I installed xlDennis’ code library. I have uninstalled the addin and so far so good, but I cannot categorically say that this was the cause.
Anyone have any idea?
Cheers
Jon
Edit: I have read this: http://support.microsoft.com/kb/271513
Doesn’t seem to cover the issue I describe
Hello,
Firstly i haven’t used excel to a great extent since my college days. So i’m having to re-learn 99.9% of everything i once new…
I am volunteering for a non profit organization and trying to create a reservation system for the rooms that they have — kind of like hotel software, but in excel (i did a similiar thing in college but for plane seats)
Please find it attached.
What i need it to do:
Copy all of the info from the main page to the guest lit (a new row each time).
From the guest list to the Gannt chart — i did a few tutorials on dynamic gantt charts using conditional formatting but cannot get them to work when based on data on a different worksheet.
Finaly is there a way to check for availabilty on any given date?
if just someone could point me in the right direction, i would be appreciate it so much words can’t express!!!
Best Regards,
Jamie
P.S for the calender drop down on the main page, i’m using ‘microsoft time & date picker 6.0)
http://www.2shared.com/file/6521961/…ibsV05b32.html — pop ups on this site
http://www.easy-share.com/1906519167/RibsV0.5b3.2.xlsm — same file, better website
I have a workbook that has compliance dates in columns «F»,»G» and «H» from row 7. What I need is when the date in either column comes within 30 days to auto send an email, address in column «A», recipients name in column «B». and then place todays date in column ‘P». ALso need to send a follow up email when either date comes within 7days and then place todays date in column «Q». If there is a date in column «P» then don’t send email. If there is a date in column «Q» then don’t send follow up. Can this be done without the users intervention and each time the workbook is opened.
Thanks in advance for any assistance.
Mick
I am looking for assistance in having one cell in a text format equals another cell that contains a time value in hh:mm format.
For example: Cell A1 has a time format (hh:mm) value of 04:00; which is the Start Time. I would like cell D1 to have a text format value of «04:00» (result is dependant upon what is entered in A1). I would duplicate the same formulas to reflect Stop Times in other cells.
My final result is to have another cell (F1) use the Concatenate formula to have the Start and Stop time shown in one cell as «04:00 — 12:30». The times would change based on the Time formated values entered into the Start and Stop time cells.
I have researched this in the board and found many excellent ways to do the opposite, but not convert Time format to Text format. Any assistance is greatly appreciated.
-Shane
Want to learn how to calculate lead time?
Lead time is the time spent between order placement and fulfillment, and it’s one of the most important metrics in inventory management and supply chain planning.
We know what you’re thinking: this is going to be like high school math all over again!
Absolutely not!
You just need a simple lead time formula.
In this article, you’ll learn about lead time, the lead time formula, and the easiest way to track it.
Both the math-averse and math-fanatics are welcome to join!
No more counting down. Let’s get started!
What Does Lead Time Mean?
Lead time is the time taken for one work unit to travel through the production and delivery cycle. For example, cooking and serving time in restaurants, transaction time in banking, or mobile app development and launch time in tech.
Note: Every business has a lead time. However, for the purpose of this article, we’ll interpret lead time with reference to inventory management and supply chain planning, as that’s where it’s most useful.
But why should you bother calculating this metric?
To answer this, we need to dig a little further into the world of
inventory management or inventory control.
For example, let’s say you run a grocery delivery business.
Since you don’t manufacture milk, cheese, or eggs, you’ll need to source them from a supplier. And once you’ve sourced them, you’ll need to store them until you sell them.
This store of unsold goods is your inventory.
While managing it, you’ll need to be mindful of two things:
- Avoid ordering too much stock. If the goods don’t get sold, you’ll end up with storage issues, a financial loss, and more (rotten) eggs than you can juggle!
- Always have enough stock to fulfill all your orders. If you order too little, you’ll have a long list of unsatisfied, hangry customers.

The key? Always maintain just the right inventory level.
And a relatively short lead time is one of the best ways of ensuring this.
The Importance of lead time in inventory management
Managing timeframes is crucial to businesses. Poorly-managed lead times can mean stock can run out and customers can’t get their orders fulfilled.
When lead times get out of control, a vicious cycle can form with lead times worsening at increased demand. This delay between consumer’s orders and production may result in more delays which can cause lead times to further deteriorate. Bad order management often causes serious and expensive damage to a business as it loses valuable customers and damages its reputation.
That’s why inventory management includes dealing with factors that affect lead time, like:
- Geography: if the delivery across the city or transcontinental
- Nature of goods: perishable goods need to have shorter lead times
- Quantity: most suppliers define delivery dates based on how much you’ve ordered
- Other factors: freight rates, regulations, availability of raw material, etc.
Because of these factors, lead time determines how much to stock and when to restock.
But just like you can’t make an omelet without breaking eggs, you can’t calculate lead time without its formula.
How To Calculate Lead Time?
The most basic lead time formula is:
Lead time (LT) = Order Delivery Date – Order Request Date
But in the context of inventory management, this formula also accounts for a reordering delay.
Lead time (LT) = Supply Delay (SD) + Reordering Delay (RD)
Supply delay is the time a supplier takes to fulfill a customer order after it’s placed.
Reordering delay is the time gap between a fulfilled order and the placement of the next order.
Why account for reordering delay?
Some suppliers may accept orders only a few times a week or month. This means retailers need to anticipate this delay in delivery to maintain a safety stock or a buffer stock.
Your safety stock lets you fulfill your orders while you wait for the supplier to replenish your stock.
For example, let’s say your average daily sales or average daily usage for milk is 20 liters. And supplier A accepts orders for milk only after every 2 days. This means that the reordering delay for your milk supplier is 2 days.
Now, let’s assume that A takes 1 day to deliver milk to your warehouse. This makes their supply delay 1 day.
In this case,
Lead time = Supply delay (1 day) + Reordering delay (2 days) = 3 days
Stocking up for 3 days should be easy enough.
But what if you were selling something that’s high-value and rare, like exotic herbs and designer decor items?
Chances are, such products are relatively slow-moving compared to milk or eggs and have high supply and reordering delays.
This means you’ll need to plan their purchase, stock, and sale months in advance.
But how can you find out how much you need to stock and when should you restock?
The answer lies in safety stock and the reorder point.
Safety stock: How much to stock?
Safety stock is the inventory level you need to maintain to cover up for supply delay or reordering delay.
Its formula takes lead time and demand variability (potential fluctuations on demand) into account.
Customer demand for products can fluctuate due to several reasons like holidays, weekends, changes in wholesale prices, offers, etc.
Apart from this, managers also need to stock up for a level of unpredictable demand variability like sudden shortages, weather disturbances, etc.
Because as the demand varies, so does the supply.
The safety stock formula is:
Safety stock = (Maximum daily sales*Maximum lead time) – (Average daily sales*Average lead time)
Reorder point: When to restock?
Your reorder point is the level of inventory that lets you know that you need to reorder.
As for the phrase ‘shop until you drop’ –

That’s a piece of advice only for your customers.
Not you!
As an inventory manager, your decision to restock depends on the reorder point formula. And that is:
Reorder point = (Lead time * Average daily sales) + Safety stock
Each time your stock falls to the reorder point, it’s time to pick up the phone and shop for some stock!
Your reordering quantity will go hand in hand with your safety stock level.
Further considerations when calculating lead time
Lead Time ARO
After receipt of order (ARO) is the point that the supplier receives an order. This is the first important point when measuring lead time, as the total time between ARO and delivery of order makes up the lead time.
Manufacturing Lead Time
Manufacturing lead time is the time between when the merchant places an order and the product manufacturer completes it. It includes the time required to acquire, manufacture, or ship goods.
Now that you’re armed with all these formulas let’s get into how you can reduce lead time.
How To Reduce Lead Time?
A supply chain is like a rubber band. The longer you stretch it, the weaker it becomes.
And eventually, it could snap!
On the other hand, a relatively short supply chain benefits everyone.
The retailer can sell more goods quickly. The supplier can be reassured of continued business.
And most importantly, the end consumer gets what they need, when they need it.
So how can you reduce the lead time to build such a ‘win-win’ supply chain?
Here are some ideas:
1. Regulate order quantity
You’d never guess what’s common between inventory management and a healthy diet.
Portion control!
That’s right.
Instead of placing an occasional order for large volumes, place small orders more frequently.
This will become easier if you regularly calculate safety stock levels and update your reorder level accordingly.
According to Lean manufacturing principles, frequently placed small orders have three benefits:
- Small orders are easier to manufacture and ship, and hence reduce lead time
- Since it requires keeping a keen eye on your stock level, you can avoid overstocking
- Without excess inventory, you can save on inventory carrying cost (warehouse rent, staff, etc.)
And just like a few small meals spread throughout the day, small and frequent orders keep your stock replenished for longer!
2. Conduct value stream mapping exercises
When it comes to inventory management, the Lean manufacturing process is the gift that keeps on giving.
A value stream is a process (with multiple interconnected steps) that an organization needs to take to implement solutions.
A value stream mapping exercise aims to recognize wastage, improves productivity, and makes your value stream more competent and waste-free.
3. Automate the inventory control process
Just hand over repetitive tasks to technology and take that much-deserved break.
Bots can manage the safety stock calculation, average demand, and demand variability.
In the meantime, talk to suppliers, keep a keen eye on market trends, or hatch the next big marketing masterplan!
4. Optimize local supply chains
Remember how the supply chain is like a rubber band?
Well, very few rubber bands are elastic enough to go around the globe!
International and cross-country suppliers may tempt you with discounts. But the long lead time (and the hassles it brings with it) aren’t always worth the low prices.
Local suppliers are in a better position to understand your unique needs and respond to them quicker. And if they also offer competitive prices for great products, they’re a keeper.
5. Manage relationships with suppliers
Ultimately, inventory control is a human affair.
So your relationship with the supplier will be a crucial factor in deciding how long your lead time will be.
In your contract with them, use incentives to reduce lead time.
They can be:
- Positive incentives: profit share, priority status, various privileges
- Negative incentives: penalties, loss of business, review by managers
Eventually, this will encourage your supplier to reduce their lead time with each delivery because they feel invested in your business.
But to make all of this happen, you need to start by calculating lead time.
Forget about a pen and paper though.
We have the perfect solution for you!
The Easiest Way To Manage Lead Time: ClickUp
Between unloading stocks and downloading files, you barely have enough time as an inventory manager. So calculating lead time the good old-fashioned way is out of the question.
That’s why we suggest using ClickUp.
What’s ClickUp?

ClickUp is the highest-rated project management tool in the world.
It’s the only tool you’ll need to manage all your projects and track your team’s productivity.
Its dynamic set of Agile, Scrum, remote working features are perfect for your exceptional team.
Take a look at how you can use ClickUp to calculate lead time and use the metric to boost your team performance.
A. Track lead time with Sprint Widgets on the Dashboard
You could scan through your project metrics, one by one, with dozens of PowerPoint slides and printouts. Yawn.
Or you can track them all at once, on your ClickUp Dashboard!
Your Dashboard will speak for itself with the help of practical Sprint Widgets like the Lead Time Graph.
Customize lead time graphs with:
- Time range: pick a time range and set the frequency of the lead time graph
- Sample time: select the number of days that you want to include as the average for each point on the graph
- Status group counted as completion: choose between ‘Closed’ or any ‘Done’ status group to count towards completion
But there’s more!
You can get a complete overview by adding more useful Sprint Widgets like Burndown Charts, Burnup Charts, Velocity Charts, and Cumulative Flow Charts to your Dashboard.
B. Time your progress with Time Estimates
ClickUp lets you calculate important project flow metrics like lead time and cycle time. With such crucial data in hand, you can predict all future timelines and set Time Estimates.
Simply add the number of hours each task and subtask will take. Using these numbers, ClickUp calculates the total hours the project is expected to take and updates estimated delivery dates in real-time.

C. Track time usage with Project Time Tracking
So you calculated lead time and set time estimates based on your historical data. Now how do you ensure that you meet these deadlines?
A loyal, talking clock, perhaps?

We have the next best thing.
ClickUp’s Native Time Tracking feature.
It may not dole out helpful advice (or timely snark) like Cogsworth from ‘Beauty And The Beast’… But it does help you do your job.
ClickUp’s Global Timer allows you to easily track time whether you’re on a desktop, web, or mobile app. You can even add notes and labels to your time records for additional reference, or mark time as billable!

Prefer using a third-party time tracker like Time Doctor or Toggl instead?
No worries. Just integrate them with ClickUp and get cracking!
But that’s just a tiny list of ways in which ClickUp eases your processes.
Take advantage of other outstanding project management features like:
- WIP Limits: control how much work your team takes through visual feedback
- Profiles: observe your team members’ past, present, and future tasks
- Multiple Views: track work items in multiple views like List, Board, Box view, etc.
- Goals: set goals (daily sales, reordering quantity, yes/no) and track them in real-time
- Workflow Automation: automate tasks 50+ unique ways
- Pulse: monitor your team’s activity throughout the day
- Docs: create an internal wiki of documents like purchase order, value stream map, and raw materials list
- Gantt Chart: visualize project progress in a Gantt Chart format
- Integrations: integrate your accounts with several third-party apps, like Zoom and Google Drive, into your ClickUp workspace
- Mobile Apps: always stay connected with ClickUp’s powerful mobile app for Android and iOS devices
FAQs About Calculating Lead Time
Want to impress your colleagues with your lead time knowledge?
Or just want to brush up on your facts?
Cover all your bases by reading these frequently asked questions about lead time.
1. What are the types of lead time?
Based on the industry or sector that it refers to, there are three types of lead time:
- Supply chain lead time: the duration between order placement and its complete delivery
- Manufacturing lead time: the duration of the whole production process, between preprocessing, actual manufacturing, and postprocessing of a finished product
- Project management lead time: the time it takes to complete various interconnected tasks in a project lifecycle
2. Who uses the lead time metric?
Anyone who’s job requires forecasting estimated delivery dates and defining a production schedule should have a working knowledge of lead time.
This includes supply chain planning, inventory management, or manufacturing professionals like:
- Designers and engineers
- Supply chain managers
- Inventory and procurement managers
- Suppliers
- Project managers and sponsors
3. How is cycle time different from lead time?
Lead time and cycle time are often used interchangeably, especially in the context of manufacturing. But this can cause confusion.
Lead time begins when a production order is received. It includes the time taken to fully manufacture or process a finished product, as well as the time taken to deliver it. This can run into days or months as well.
Cycle time, however, is the time taken to complete manufacturing a finished product. It’s a measure of the total operation time and does not account for the hours or days spent processing, delivering, or receiving an order.
Read more about how to calculate cycle time and cycle time vs. lead time.
Conclusion
At first glance, the lead time metric simply informs you about how long delivery will take. But if you look closer, you’ll find that it can indicate unnecessary delays, wastage, and other factors that impede your supply chain.
That’s why calculating lead time is the easiest way to ensure that your supply chain remains efficient and effective.
But how can you control the lead time for your lead time calculation?
Simple. By using an online tool that calculates and tracks lead time.
In other words: ClickUp!
The easy-to-use lead time widget needs only a few quick settings to start gathering data instantly. And it’s only one of the hundreds of unique and impressive features that make project management a breeze.
So get ClickUp for free to reduce your lead time and increase your…