17 авг. 2022 г.
читать 2 мин
Критерий Колмогорова-Смирнова используется для определения нормальности распределения выборки.
Этот тест широко используется, потому что многие статистические тесты и процедуры предполагают , что данные распределены нормально.
В следующем пошаговом примере показано, как выполнить тест Колмогорова-Смирнова для образца набора данных в Excel.
Шаг 1: введите данные
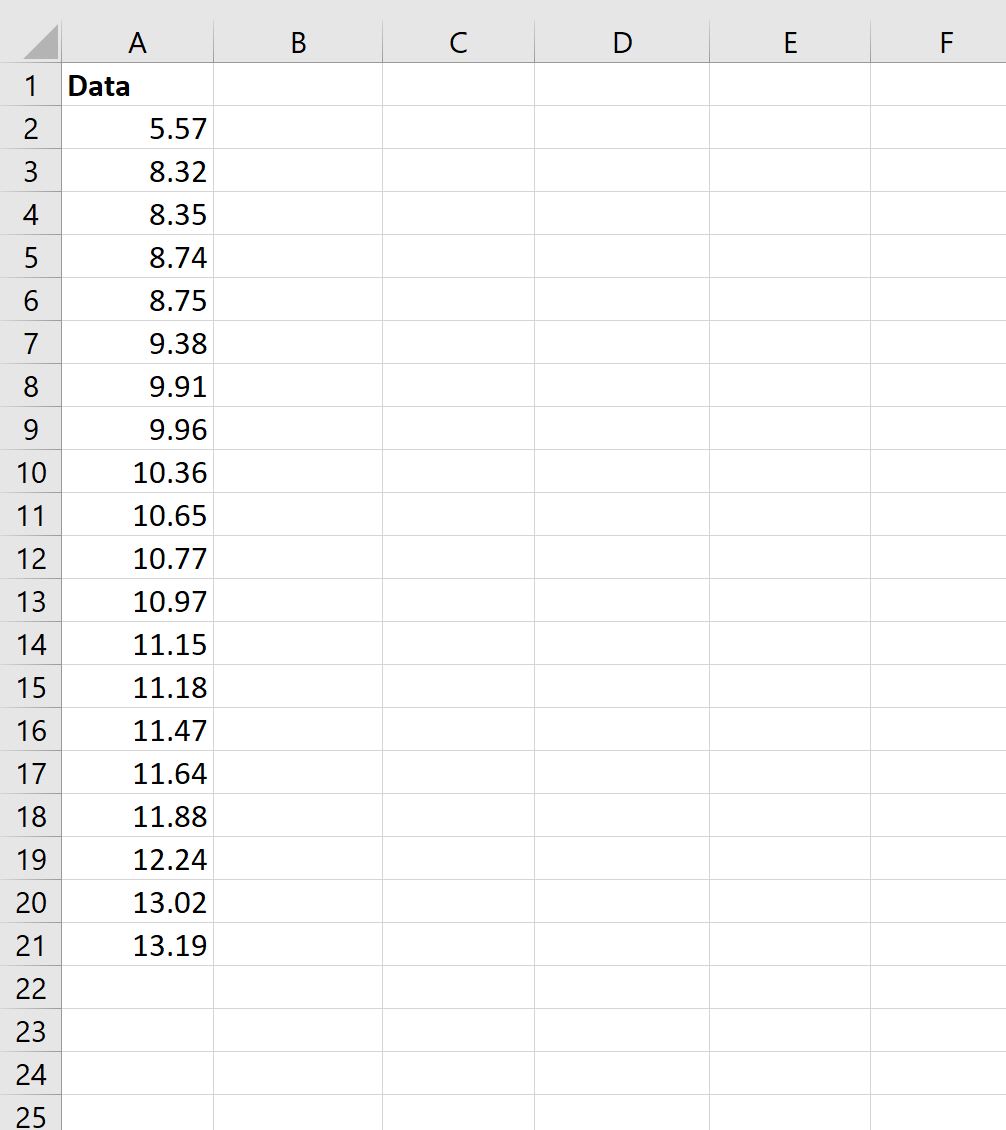
Во-первых, давайте введем значения для набора данных с размером выборки n = 20:
Шаг 2: Расчет фактических и ожидаемых значений из нормального распределения
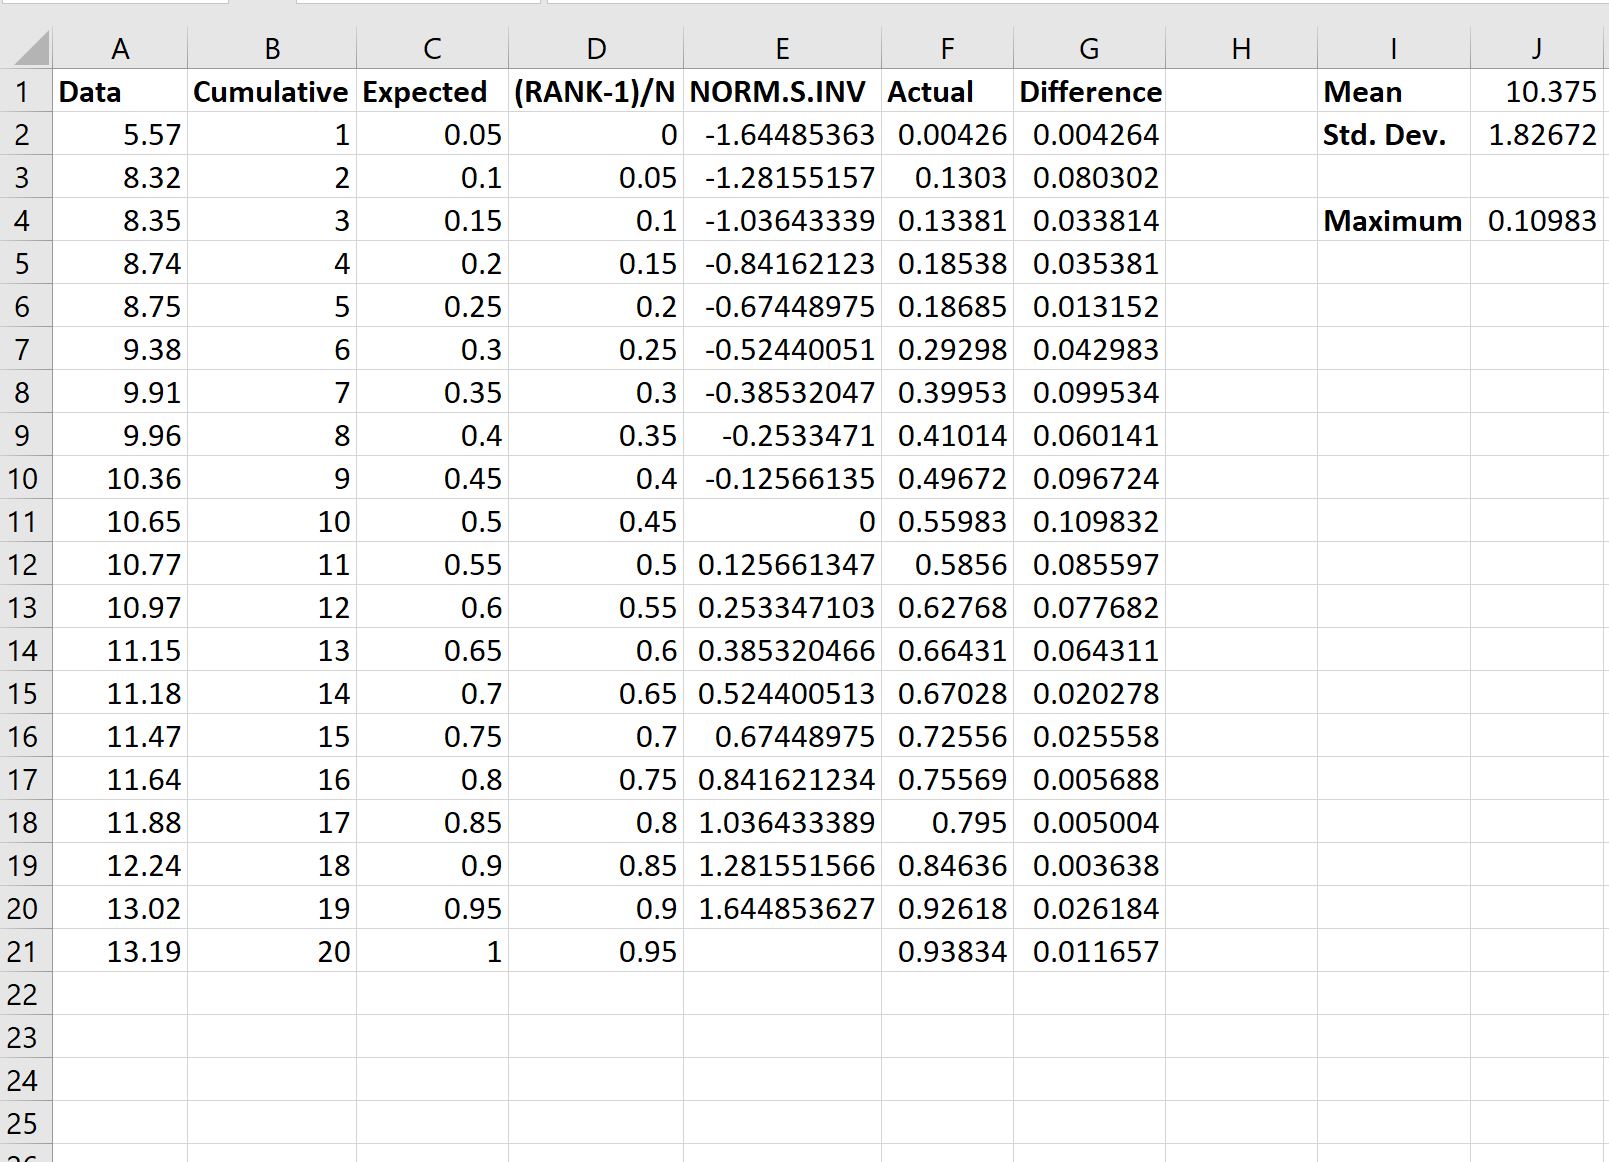
Далее мы рассчитаем фактические значения по сравнению с ожидаемыми значениями из нормального распределения:
Вот формула, которую мы использовали в различных ячейках:
- B2 : =СТРОКА() – 1
- C2 : = B2 /COUNT( $A$2:$A$21 )
- D2 : =( B2 -1)/СЧЁТ( $A$2:$A$21 )
- E2 : =ЕСЛИ( C2 <1, НОРМ.С.ОБР( C2 )»,»)
- F2 : =НОРМ.РАСП( A2 , $J$1 , $J$2 , ИСТИНА)
- G2 : =ABS( F2 – D2 )
- J1 : =СРЕДНЕЕ( A2:A21 )
- J2 : =СТАНДОТКЛОН.С( A2:A21 )
- J4 : =МАКС( G2:G21 )
Шаг 3: интерпретируйте результаты
В тесте Колмогорова-Смирнова используются следующие нулевая и альтернативная гипотезы:
- H 0 : Данные нормально распределены.
- H A : Данные не распределены нормально.
Чтобы определить, должны ли мы отклонить или не отклонить нулевую гипотезу, мы должны обратиться к максимальному значению на выходе, которое оказывается равным 0,10983 .
Это представляет собой максимальную абсолютную разницу между фактическими значениями нашей выборки и ожидаемыми значениями нормального распределения.
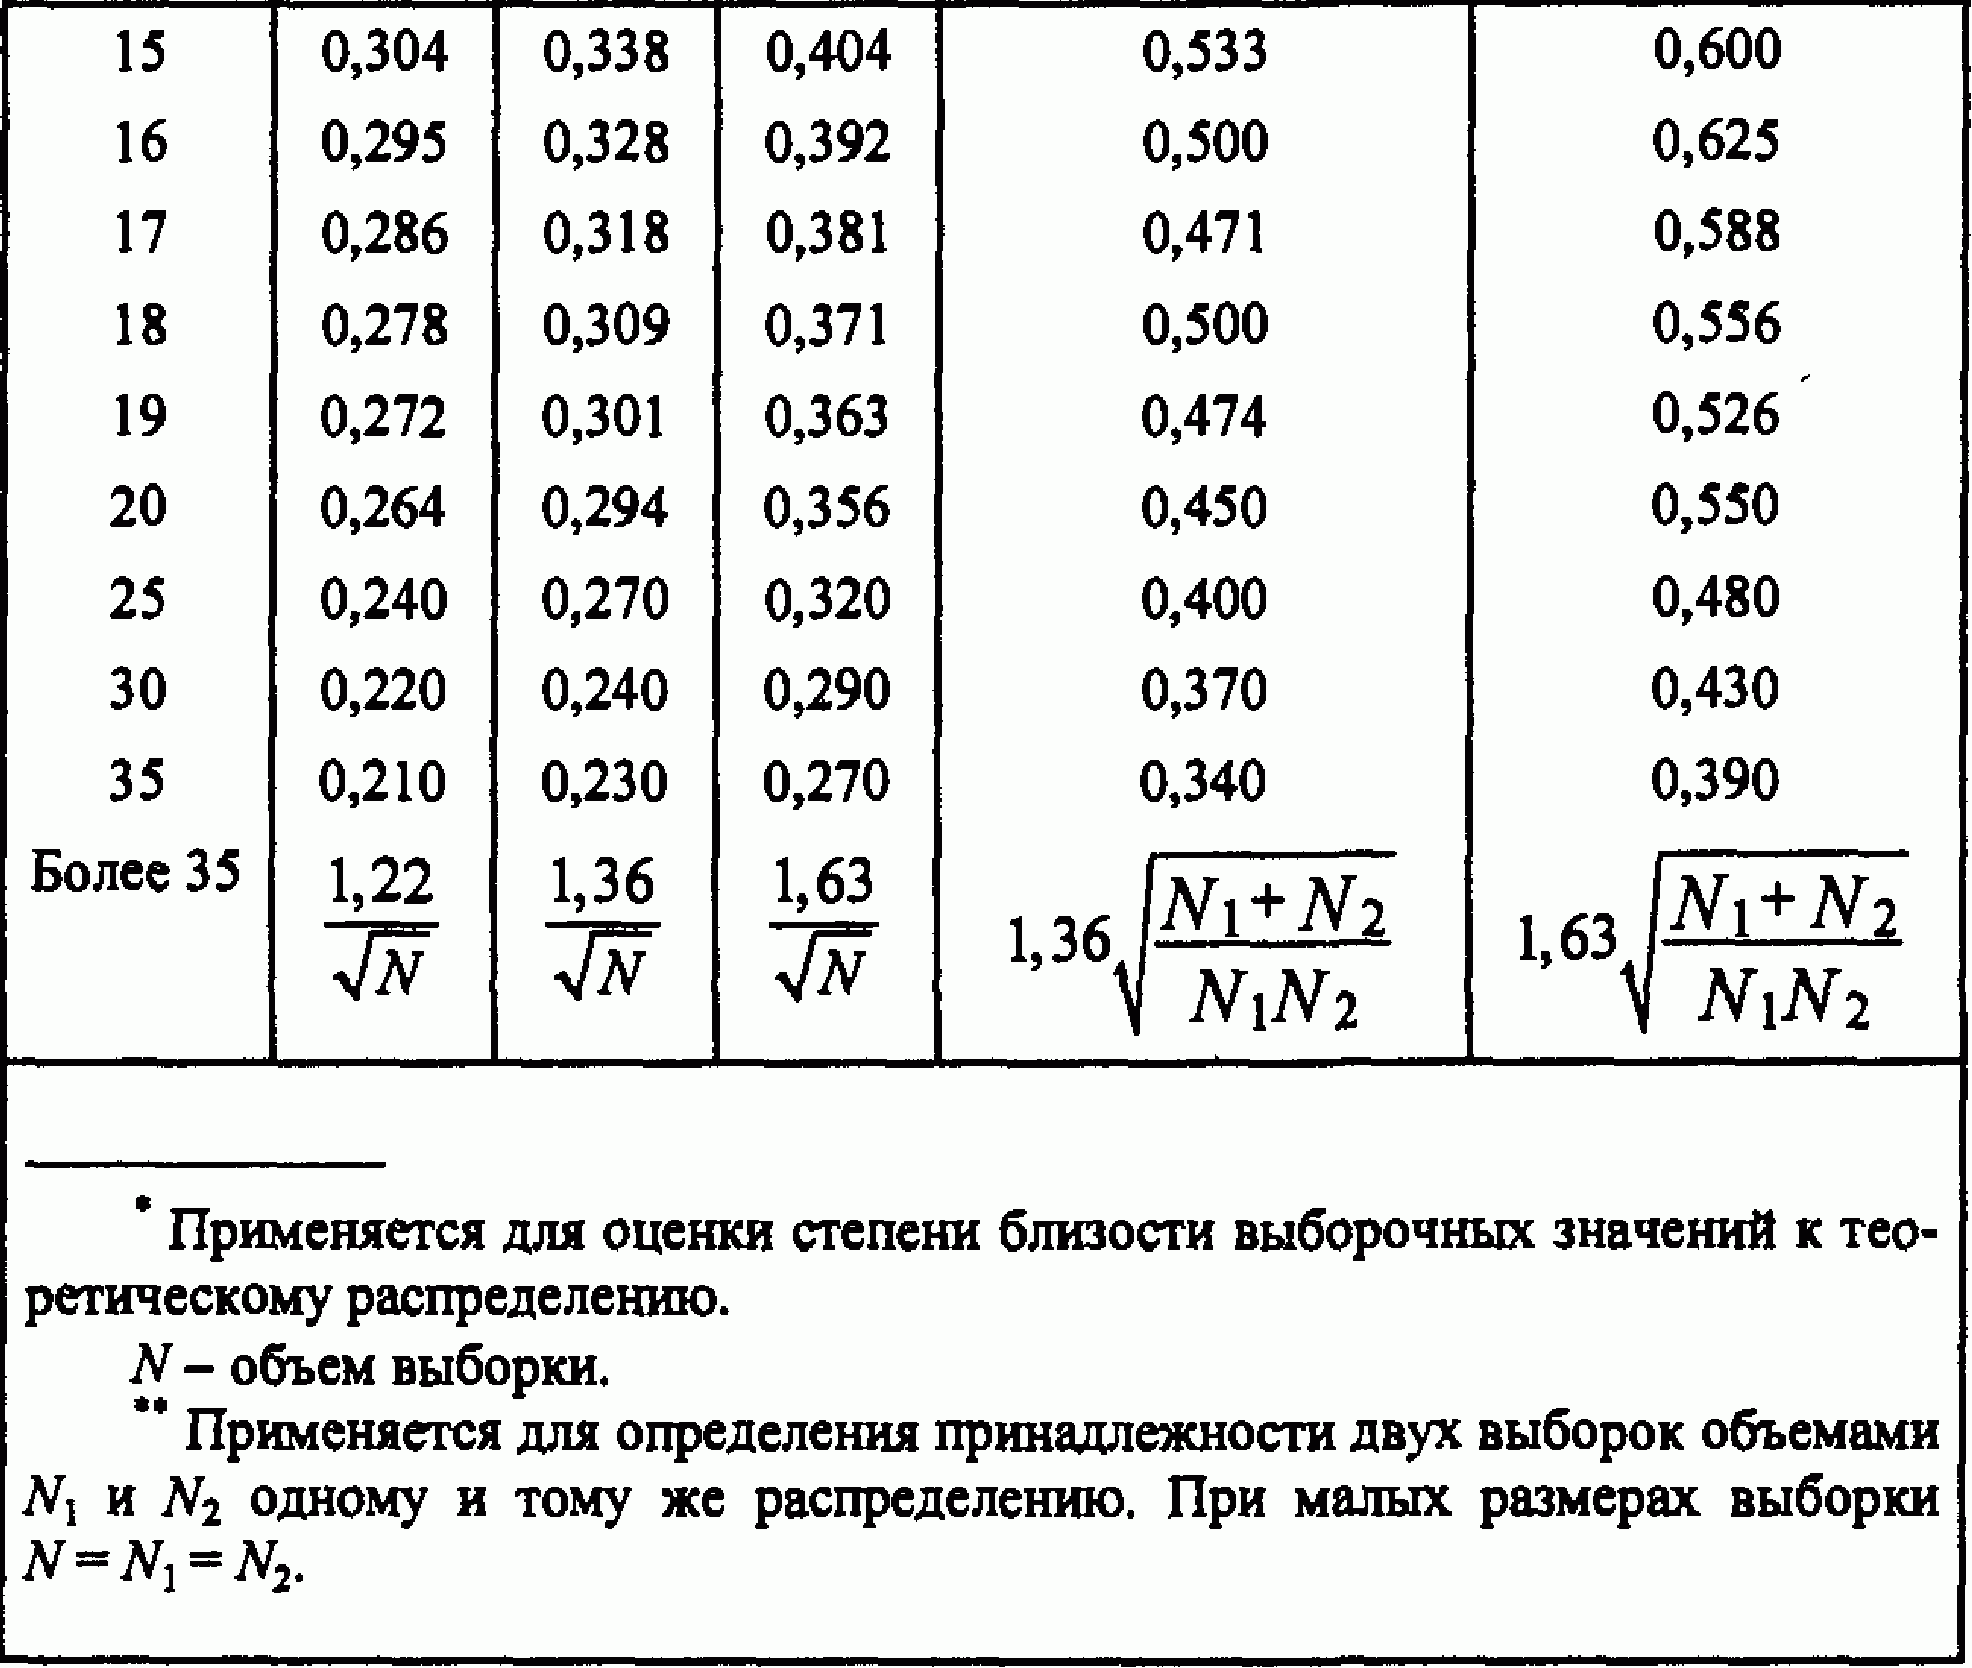
Чтобы определить, является ли это максимальное значение статистически значимым, мы должны обратиться к таблице критических значений Колмогорова-Смирнова и найти число, равное n = 20 и α = 0,05.
Критическое значение оказывается равным 0,190 .
Поскольку наше максимальное значение не превышает этого критического значения, мы не можем отвергнуть нулевую гипотезу.
Это означает, что мы можем предположить, что наши выборочные данные нормально распределены.
Дополнительные ресурсы
В следующих руководствах объясняется, как выполнять другие распространенные статистические тесты в Excel:
Как выполнить корреляционный тест в Excel
Как выполнить тест Дарбина-Ватсона в Excel
Как выполнить тест Харке-Бера в Excel
Как выполнить тест Левена в Excel
The Kolmogorov-Smirnov test is used to determine whether or not or not a sample is normally distributed.
This test is widely used because many statistical tests and procedures make the assumption that the data is normally distributed.
The following step-by-step example shows how to perform a Kolmogorov-Smirnov test on a sample dataset in Excel.
Step 1: Enter the Data
First, let’s enter the values for a dataset with a sample size of n = 20:
Step 2: Calculate Actual vs. Expected Values from Normal Distribution
Next, we’ll calculate the actual values vs. the expected values from the normal distribution:
Here is the formula we used in various cells:
- B2: =ROW() – 1
- C2: =B2/COUNT($A$2:$A$21)
- D2: =(B2-1)/COUNT($A$2:$A$21)
- E2: =IF(C2<1, NORM.S.INV(C2),””)
- F2: =NORM.DIST(A2, $J$1, $J$2, TRUE)
- G2: =ABS(F2–D2)
- J1: =AVERAGE(A2:A21)
- J2: =STDEV.S(A2:A21)
- J4: =MAX(G2:G21)
Step 3: Interpret the Results
A Kolmogorov-Smirnov test uses the following null and alternative hypotheses:
- H0: The data is normally distributed.
- HA: The data is not normally distributed.
To determine if we should reject or fail to reject the null hypothesis we must refer to the Maximum value in the output, which turns out to be 0.10983.
This represents the maximum absolute difference between the actual values of our sample and the expected values from a normal distribution.
To determine if this maximum value is statistically significant, we must refer to a Kolmogorov-Smirnov Table of critical values and find the number equal to n = 20 and α = .05.
The critical value turns out to be 0.190.
Since our maximum value is not greater than this critical value, we fail to reject the null hypothesis.
This means we can assume that our sample data is normally distributed.
Additional Resources
The following tutorials explain how to perform other common statistical tests in Excel:
How to Perform a Correlation Test in Excel
How to Perform a Durbin-Watson Test in Excel
How to Perform a Jarque-Bera Test in Excel
How to Perform Levene’s Test in Excel
Содержание
- Критерий согласия Пирсона (Хи-квадрат) и критерий Колмогорова-Смирнова
- Задание
- Методические указания
- Решение
- 1. Критерий Хи-квадрат
- 2. Критерий Колмогорова-Смирнова
- Литература
- Kolmogorov-Smirnov Test for Normality
- Hypothesis Testing
- Examples
- Worksheet Functions
- Kolmogorov Distribution
- Lilliefors Test
Критерий согласия Пирсона (Хи-квадрат) и критерий Колмогорова-Смирнова
Задание
| ПН | ВТ | СР | ЧТ | ПТ | СБ | ВС |
| 2 | 3 | 4 | 6 | 4 | 3 | |
| 5 | 4 | 2 | 1 | 4 | 5 | 3 |
| 4 | 5 | 3 | 5 | 8 | 2 | 2 |
| 3 | 1 | 3 | 6 | 2 | 1 | 3 |
| 2 | 7 | 1 |
П риняв уровень значимости alpha=0.05, проверить согласие этих данных обычного месяца с распределением Пуассона, пользуясь критерием Хи-квадрат. Перепроверить данные с помощью критерия Колмогорова-Смирнова, по прежнему принимая alpha =0.05.
Методические указания
Критерий Хи-квадрат предпочтителен, когда исследуются большие объемы выборок. При малых объемах выборок этот критерий практически не пригоден.
Нулевая гипотеза при применении общих критериев согласия записывается в форме
где Fn(x) – эмпирическая функция распределения вероятностей; F(x) – гипотетическая функция распределения вероятностей.
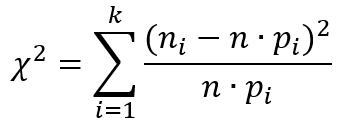
Критерий Пирсона X 2 основан на сравнении эмпирической гистограммы распределения случайной величины с ее теоретической плотностью. Диапазон изменения экспериментальных данных разбивается на k интервалов, и подсчитывается статистика:
где ni – количество значений случайной величины, попавших в i-й интервал; n – объем выборки; F(x) – гипотетический теоретический закон распределения вероятностей случайной величины; pi = F(xi+1) — F(xi) – теоретическая вероятность попадания случайной величины в i-й интервал.
Статистика X 2 имеет распределение Хи-квадрат с f = n — 1 степенями свободы в том случае, когда проверяется простая нулевая гипотеза H0, т.е., когда гипотетическое распределение, на соответствие которому проверяется эмпирический ряд данных, известно с точностью до значения своих параметров.
Правило проверки гипотезы:
то на уровне значимости alpha, т. е. с достоверностью (1 — alpha) гипотеза
На мощность статистического критерия X 2 сильное влияние оказывает чиcло интервалов разбиения гистограммы (k) и порядок ее разбиения (т. е. выбор длин интервалов внутри диапазона изменения значений случайной величины). На практике принято считать, что статистику X 2 можно использовать, когда npi >= 5.
Такое приближение допустимо и тогда, когда не более, чем в 20% интервалов имеет место 1 k = 1+ 3,32·lg n
При n >= 200 можно выбирать k из условия
Еще одно простое правило: выбрать как можно большее k, но не превышающее n/5:
Критерий Крамера-фон Мизеса дает хорошие результаты при малых объемах выборок (менее 10). Однако вопрос о доверительной вероятности остается нерешенным (эта вероятность мала при значительных размерах доверительных интервалов.
Исходя из этого, полагают, что реальные объемы выборок, которые можно получить, находятся в диапазоне от 10 до 100.
Критерий Колмогорова-Смирнова также целесообразно использовать для выборки указанных объемов в тех случаях, когда проверяемое распределение непрерывно и известны среднее значение и дисперсия проверяемой совокупности.
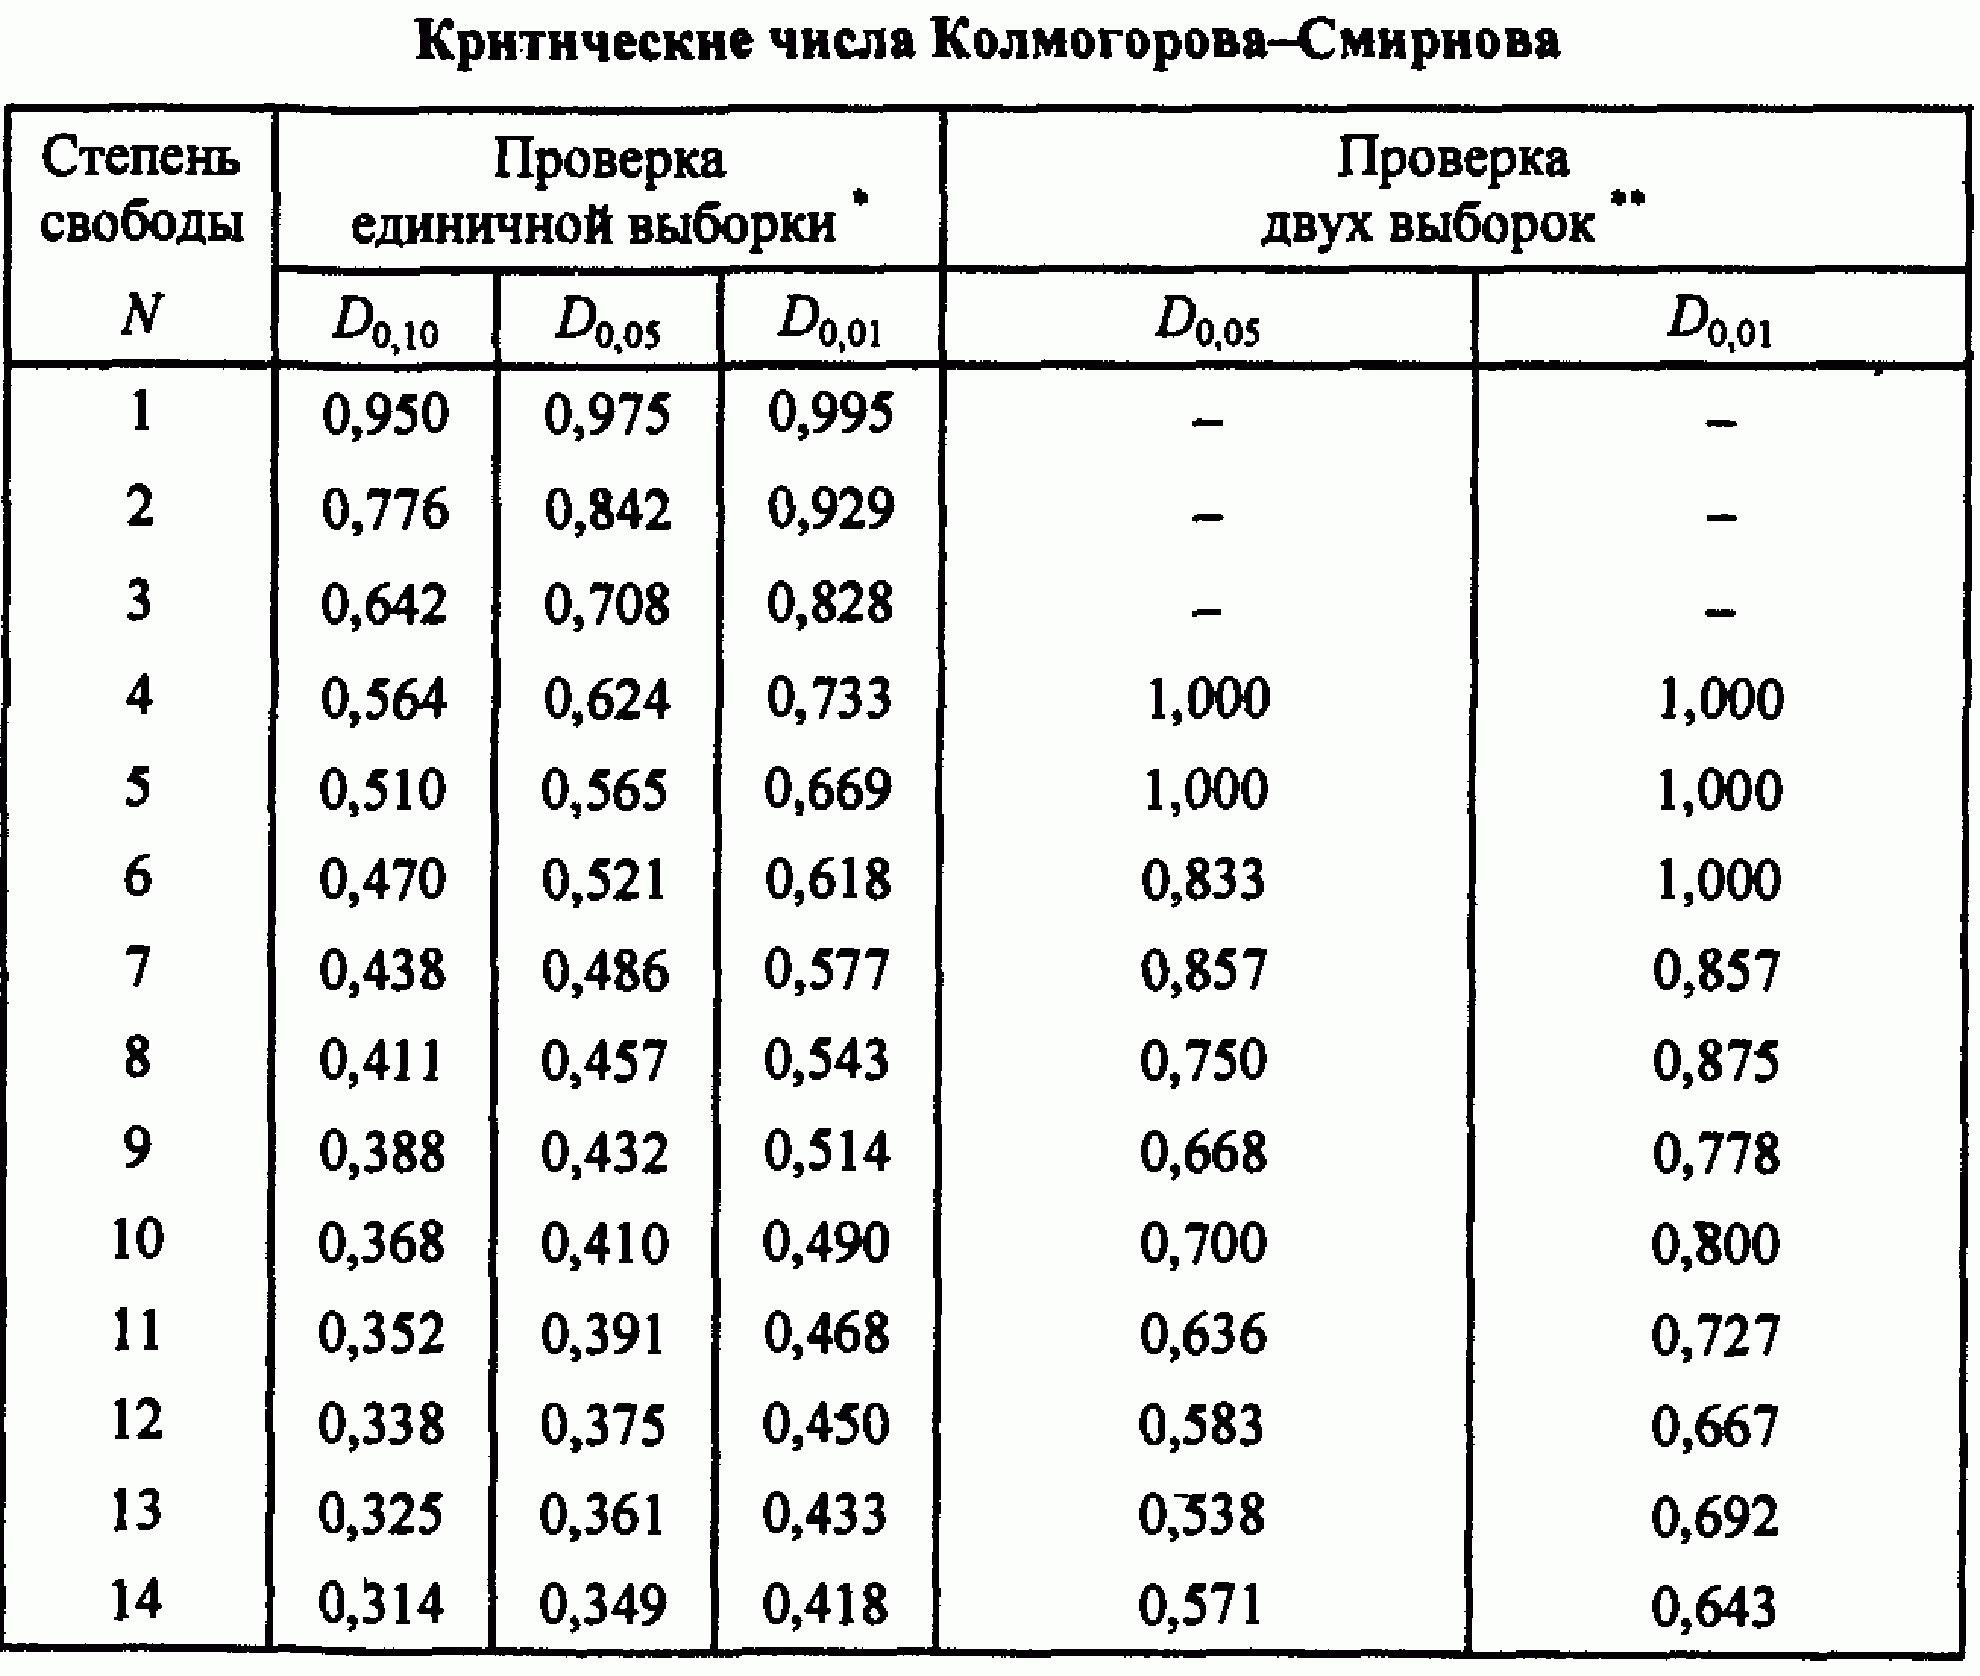
Алгоритм реализации критерия Колмогорова-Смирнова предполагает использование критического значения D extr для проверки принятой гипотезы. Для этого используется приведенная ниже табл. 1.
Решение
1. Критерий Хи-квадрат
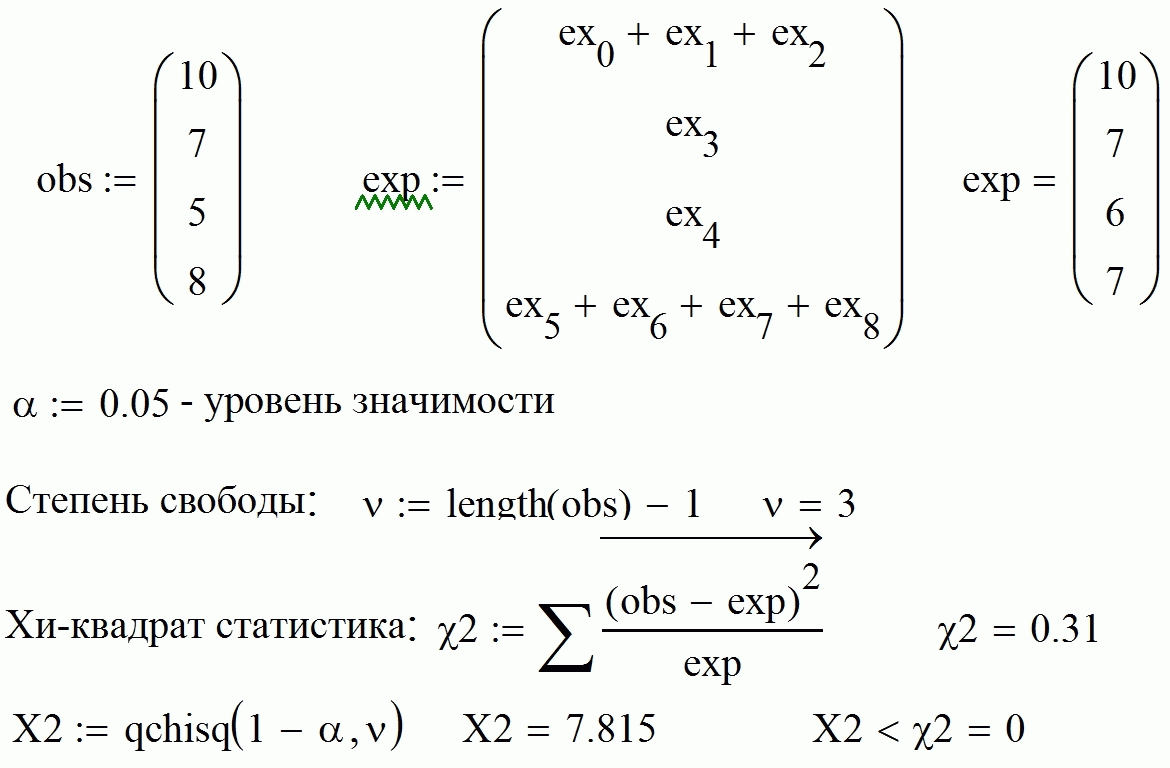
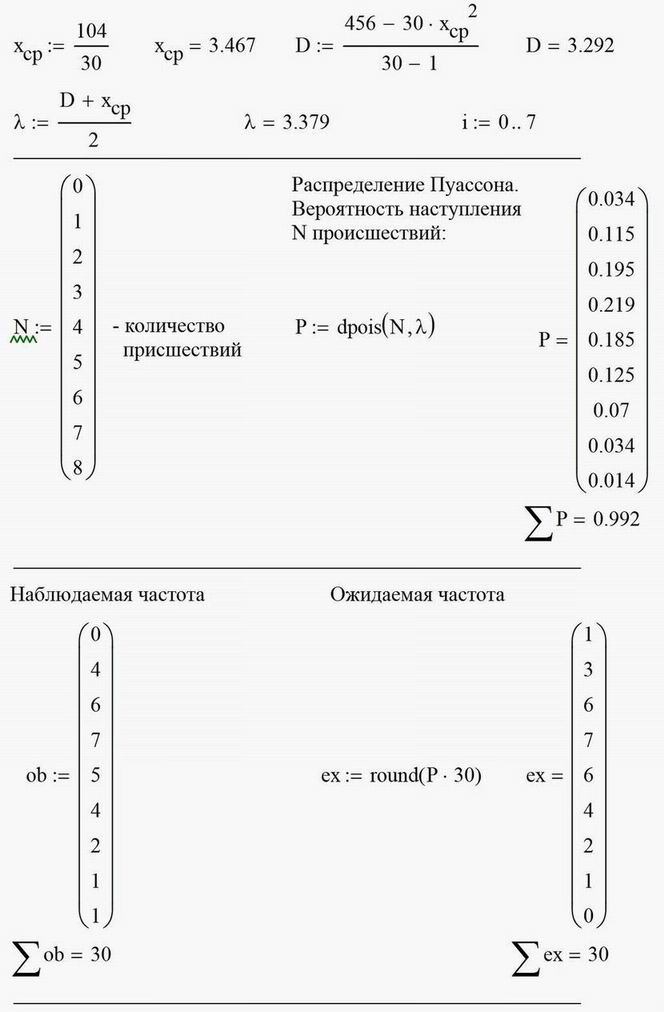
1.1. Реализация в MathCad
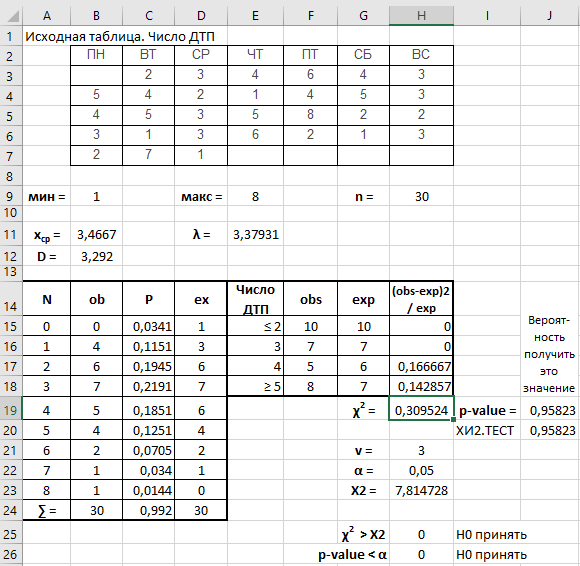
1.2. Реализация в Excel
Формулы ячеек на листе Excel представлены в табл. 2.
| Ячейка | Характеристика | Формула |
| В15 | – число случаев исхода | =СЧЁТЕСЛИ($B$3:$H$7;A15) |
| С15 | – вероятность наступления | =ПУАССОН.РАСП(A15;$E$11;ЛОЖЬ) |
| D15 | – ожидаемое число случаев исхода | =ОКРУГЛ(C15*$H$9;0) |
| H19 | – статистика Хи-квадрат | =СУММ(H15:H18) |
| H23 | – критическое значение Хи-квадрата (максимальное значение для заданного уровня значимости) | =ХИ2.ОБР(1-H22;H21) |
| J19 | – p-value (вероятность получить расчетное значение Хи-квадрата) | =ХИ2.РАСП.ПХ(H19;H21) |
| J20 | – Хи-квадрат тест | =ХИ2.ТЕСТ(F15:F18;G15:G18) |
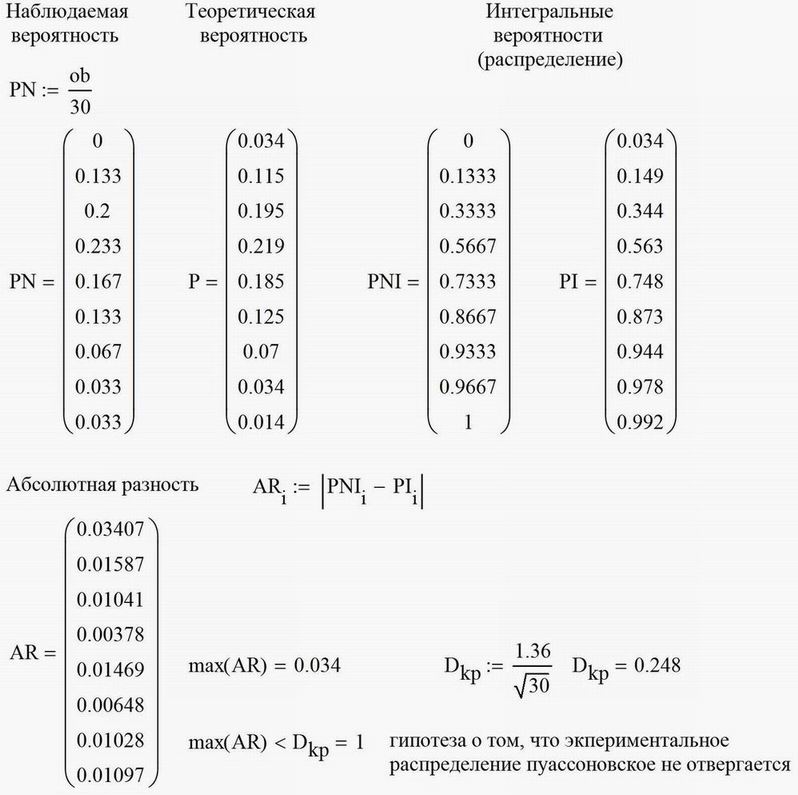
2. Критерий Колмогорова-Смирнова
Литература
- Емельянов А.А., Власова Е.А., Дума Р.В. Имитационное моделирование экономических процессов: уч. пособ. — М.: Финансы и статистика, 2002. — 368с.
- Кобзарь А. И. Прикладная математическая статистика. Для инженеров и научных работников. — М.: ФИЗМАТЛИТ, 2006. — 816 с.
© В.Н. Кравченко
Последнее обновление: 2018.11.03
Источник
Kolmogorov-Smirnov Test for Normality
Hypothesis Testing

Now suppose that the sample comes from a population with cumulative distribution function F(x) and define Dn as follows:

Observation: It can be shown that Dn doesn’t depend on F. Since Sn(x) depends on the sample chosen, Dn is a random variable. Our objective is to use Dn as a way of estimating F(x).
The distribution of Dn can be calculated (see Kolmogorov Distribution), but for our purposes now the important aspect of this distribution is the table of critical values. These can be found in the Kolmogorov-Smirnov Table .
If Dn,α is the critical value from the table, then P(Dn ≤ Dn,α) = 1 – α. Dn can be used to test the hypothesis that a random sample came from a population with a specific distribution function F(x). If

then the sample data is a good fit with F(x).
Also from the definition of Dn given above, it follows that


Examples
Example 1: Determine whether the data represented in the following frequency table is normally distributed where x represents rainfall amounts.

Figure 1 – Frequency table for Example 1
This means that 8 elements have an x value less than 100 (i.e. between 0 and 100), 25 elements have an x value between 101 and 200, etc. We need to find the mean and standard deviation of this data. Since this is a frequency table, we can’t simply use Excel’s AVERAGE and STDEV functions. Instead, we first use the midpoints of each interval and then use an approach similar to that described in Frequency Tables as shown in Figure 2:
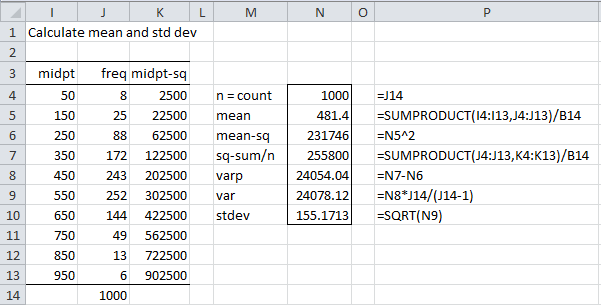
Figure 2 – Calculating mean and standard deviation
Thus, the mean is 481.4 and the standard deviation is 155.2. We can now build the table that allows us to carry out the KS test, as shown in Figure 3.

Figure 3 – Kolmogorov-Smirnov test for Example 1
Columns A and B contain the data from the original frequency table. Column C contains the corresponding cumulative frequency values and column D simply divides these values by the sample size (n = 1000) to yield the cumulative distribution function Sn(x)
Column E uses the mean and standard deviation calculated previously to standardize the values of x from column A. E.g. the formula in cell E4 is =STANDARDIZE(A4,N$5,N$10), where cell N5 contains the mean and cell N10 contains the standard deviation (from Figure 2). Column F uses these standardized values to calculate the cumulative distribution function values assuming that the original data is normally distributed. E.g. cell F4 contains the formula =NORM.S.DIST(E4,TRUE). Finally, column G contains the absolute values of the differences between the values in columns D and F. E.g. cell G4 contains the formula =ABS(F4—D4). If the original data is normally distributed these differences will be zero.
Now Dn = the largest value in column G, i.e. MAX(G4:G13) = 0.0117 (cell G8). If the data is normally distributed then the critical value Dn,α will be larger than Dn. From the Kolmogorov-Smirnov Table we see that
Example 2: Using the KS test, determine whether the data in Example 1 of Graphical Tests for Normality and Symmetry is normally distributed.
We follow the same procedure as in the previous example to obtain the results shown in Figure 4. Since the frequencies are all 1, this example might be a little easier to understand.
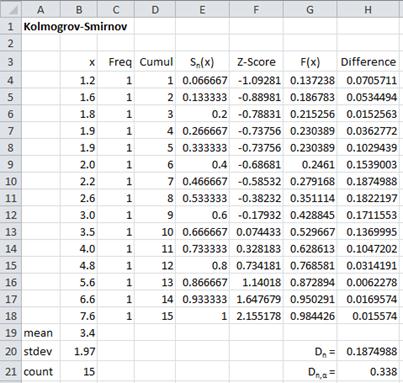
Figure 4 – KS test for data from Example 2
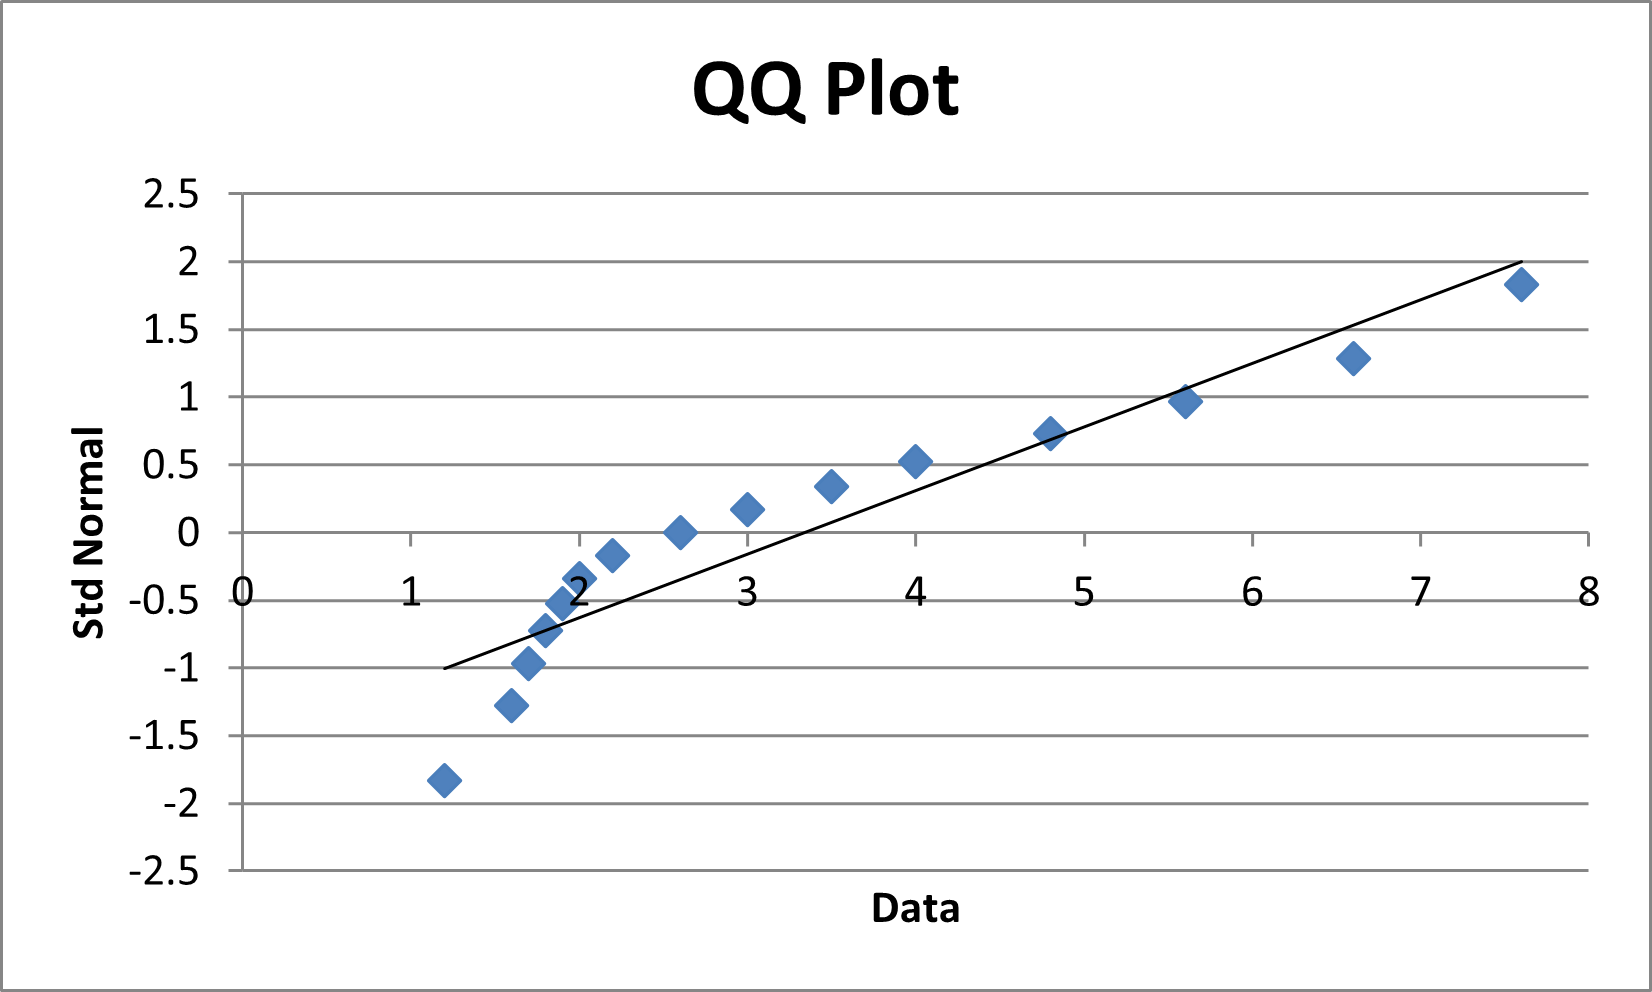
Figure 5 – QQ Plot for Example 2
The reason for this inconsistency is that the Kolmogorov-Smirnov test in the form presented above is only valid when the population mean and standard deviation are known, and not estimated from the sample. In the case where the population mean and standard deviation are not known, you need to use the Lilliefors version of the test, as described below.
Worksheet Functions
Real Statistics Excel Function : The following functions are provided in the Real Statistics Resource Pack:
KSCRIT(n, α, tails, interp) = the critical value of the Kolmogorov-Smirnov test for a sample of size n, for the given value of alpha (default = .05) and tails = 1 (one tail) or 2 (two tails, default), based on the KS Table. If interp = TRUE (default) then the recommended interpolation is used; otherwise linear interpolation is used.
KSPROB(x, n, tails, iter, interp, txt) = an approximate p-value for the KS test for the Dn value equal to x for a sample of size n and tails = 1 (one tail) or 2 (two tails, default) based on a linear interpolation (if interp = FALSE) or recommended interpolation (if interp = TRUE, default) of the values in the Kolmogorov-Smirnov Table, using iter number of iterations (default = 40).
Note that the values for α in the Kolmogorov-Smirnov Table range from .001 to .2 (for tails = 2) and .0005 to .1 for tails = 1. When txt = FALSE (default), if the p-value is less than .001 (tails = 2) or .0005 (tails = 1) then the p-value is given as 0 and if the p-value is greater than .2 (tails = 2) or .1 (tails = 1) then the p-value is given as 1. When txt = TRUE, then the output takes the form “ .2” or “> .1”.
For Example 2, KSCRIT(15, .05, 2) = .338 (the same as shown in cell H21 of Figure 4). Also note that the p-value = KSPROB(H20, B21) = KSPROB(0.184177, 15) = 1 (meaning that p-value > .2), and so once again we can’t reject the null hypothesis that the data is normally distributed.
If the value of Dn had been .35 in Example 2, then Dn = .35 > .338 = Dcrit, and so we would have rejected the null hypothesis that the data is normally distributed. In this case, we would have seen that p-value = KSPROB(.35,15) = .0427, which once again leads us to reject the null hypothesis.
Kolmogorov Distribution
As referenced above, the Kolmogorov distribution can be useful in conducting the Kolmogorov-Smirnov test. Click here for more information about this distribution, including some useful functions provided by the Real Statistics Resource Pack.
Lilliefors Test
When the population mean and standard deviation for the Kolmogorov-Smirnov Test is estimated from the sample mean and standard deviation, as was done in Example 1 and 2, then the Kolmogorov-Smirnov Table yields results that are too conservative. More accurate results can be derived from the Liiliefors Table as described in the Lilliefors Test for Normality.
Источник
The data correspond to scores (0 – 30) measuring the quality of two brands of shoes (brand A and brand B). Scores were computed based on a survey addressed to customers using either brand. 15 customers have answered for brand A and 8 different clients for brand B.
Goal of this tutorial
This tutorial is divided into two parts:
In the first part we compare the distributions of the two samples without making assumptions on underlying theoretical distributions (normal distribution for example). We use the non-parametric Kolmogorov-Smirnov test, which is well suited in this case.
In the second part, we use the Kolmogorov-Smirnov test to compare the distribution of one sample to a theoretical distribution.
Part 1: Running a Kolmogorov-Smirnov test to compare two observed distributions in Excel
Here, we are interested in comparing the distributions of the two samples.
First of all, what do these distributions look like? Histograms are a good tool to visualize continuous distributions: XLSTAT / Visualizing data / Histograms.
In the General tab, select both samples inside the Data cell range. In the Options tab, activate the minimum option and enter 0 in the box. This will force histograms to have the same lower bound on the x axis making their comparison easier. Click on the OK button.
The histograms appear in the results sheet:
Without making any theoretical assumption, we may say that the distribution of sample B is more skewed towards low values compared to the distribution of sample A. We will now use the Kolmogorov-Smirnov non-parametric test to compare the two distributions. Go to XLSTAT / Nonparametric tests / Comparison of two distributions.
Select the Brand A column in Sample 1 and the Brand B column in sample 2. The Kolmogorov-Smirnov test allows samples to be unbalanced such as in our data: sample B contains fewer scores than sample A. In the Options tab, notice it is possible to select a one-tailed alternative hypothesis and/or an exact computation of the p-value. In the Charts tab, activate the Cumulative histograms option. Click on the OK button.
The results sheet contains the Kolmogorov-Smirnov statistic (0.475) that can be easily extracted (see further, the cumulative histograms chart). This statistic is associated to a p-value (0.190) indicating that the two distributions are not significantly different at alpha = 0.05.
Confused with p-values and statistical significance? Do not hesitate to visit our tutorial.
The cumulative distributions chart presents the studied variable (survey scores) on the x axis. For a given point on the x axis, a brand’s cumulative relative frequency is the proportion of scores smaller than this point among the scores of the brand. Thus, as previously suggested by the histograms, brand B seems to start cumulating scores earlier than brand A along the x axis. Let’s take a look at the medians, which are the scores corresponding to a cumulative relative frequency of 0.5. The median score for brand B (~20) seems to be higher than the median score for brand A (~17).
Kolmogorov-Smirnov’s D test statistic is the highest deviation occurring between the two curves.
It is calculated by the following formula:
Dn=supx∣Fn(x)−F(x)∣D_n=underset{x}{sup}|F_n(x)-F(x)|
where F_n and F are the distribution functions.
In our example, this deviation value falls inside the median region, but this may not necessarily be the case when using other data. The higher the D statistic, the lower the p-value and the more significant the difference between the two distributions.
Part 2: Running a Kolmogorov-Smirnov test to compare an observed distribution to a theoretical one in Excel
Suppose that the quality scores of brand A were obtained in France. For US customers, this score follows a normal distribution with a mean of 21.5 and a standard deviation of 2.3. We may ask ourselves if the French scores distribution is significantly different from the theoretical distribution of the US scores.
Here again, we will use the Kolmogorov-Smirnov test. The only difference with the previous part is that we aim at comparing an observed distribution to a theoretical one instead of comparing two different distributions.
To run the test, go to XLSTAT / Nonparametric tests / Distribution fitting.
In the General tab, select the brand A data, the normal distribution, activate the Enter option and enter the following parameters: µ = 21.5 and sigma = 2.3. In the Charts tab, activate the Cumulative histograms option. Click on the OK button.
In the results sheet, the histogram (on the left below) shows that the observed distribution of our data lays on low score values compared to the theoretical curve reflecting the US scores distribution (red line).
The Kolmogorov-Smirnov test is associated to a p-value of 0.000 suggesting that the null hypothesis should be rejected and that the observed distribution is significantly different from the theoretical one at alpha = 0.05.
Not sure that you have chosen the right test? This will let you know.
Was this article useful?
- Yes
- No
Hypothesis Testing
Definition 1: Let x1,…,xn be an ordered sample with x1 ≤ … ≤ xn and define Sn(x) as follows:
Now suppose that the sample comes from a population with cumulative distribution function F(x) and define Dn as follows:
Observation: It can be shown that Dn doesn’t depend on F. Since Sn(x) depends on the sample chosen, Dn is a random variable. Our objective is to use Dn as a way of estimating F(x).
The distribution of Dn can be calculated (see Kolmogorov Distribution), but for our purposes now the important aspect of this distribution is the table of critical values. These can be found in the Kolmogorov-Smirnov Table.
If Dn,α is the critical value from the table, then P(Dn ≤ Dn,α) = 1 – α. Dn can be used to test the hypothesis that a random sample came from a population with a specific distribution function F(x). If
then the sample data is a good fit with F(x).
Also from the definition of Dn given above, it follows that
Thus Sn(x) ± Dn,α provides a confidence interval for F(x)
Examples
Example 1: Determine whether the data represented in the following frequency table is normally distributed where x represents rainfall amounts.
Figure 1 – Frequency table for Example 1
This means that 8 elements have an x value less than 100 (i.e. between 0 and 100), 25 elements have an x value between 101 and 200, etc. We need to find the mean and standard deviation of this data. Since this is a frequency table, we can’t simply use Excel’s AVERAGE and STDEV functions. Instead, we first use the midpoints of each interval and then use an approach similar to that described in Frequency Tables as shown in Figure 2:
Figure 2 – Calculating mean and standard deviation
Thus, the mean is 481.4 and the standard deviation is 155.2. We can now build the table that allows us to carry out the KS test, as shown in Figure 3.
Figure 3 – Kolmogorov-Smirnov test for Example 1
Columns A and B contain the data from the original frequency table. Column C contains the corresponding cumulative frequency values and column D simply divides these values by the sample size (n = 1000) to yield the cumulative distribution function Sn(x)
Column E uses the mean and standard deviation calculated previously to standardize the values of x from column A. E.g. the formula in cell E4 is =STANDARDIZE(A4,N$5,N$10), where cell N5 contains the mean and cell N10 contains the standard deviation (from Figure 2). Column F uses these standardized values to calculate the cumulative distribution function values assuming that the original data is normally distributed. E.g. cell F4 contains the formula =NORM.S.DIST(E4,TRUE). Finally, column G contains the absolute values of the differences between the values in columns D and F. E.g. cell G4 contains the formula =ABS(F4—D4). If the original data is normally distributed these differences will be zero.
Now Dn = the largest value in column G, i.e. MAX(G4:G13) = 0.0117 (cell G8). If the data is normally distributed then the critical value Dn,α will be larger than Dn. From the Kolmogorov-Smirnov Table we see that
Dn,α = D1000,.05 = 1.36 / SQRT(1000) = 0.043007
Since Dn = 0.0117 < 0.043007 = Dn,α, we conclude that the data is a good fit for the normal distribution.
Example 2: Using the KS test, determine whether the data in Example 1 of Graphical Tests for Normality and Symmetry is normally distributed.
We follow the same procedure as in the previous example to obtain the results shown in Figure 4. Since the frequencies are all 1, this example might be a little easier to understand.
Figure 4 – KS test for data from Example 2
The Kolmogorov-Smirnov Table shows that the critical value Dn,α = D15,.05 = .338.
Since Dn = 0.1874988 < 0.338 = Dn,α, we conclude that the data is a reasonably good fit with the normal distribution. This is inconsistent with the QQ plot shown in Figure 5, which seems to show that the data is not normally distributed.
Figure 5 – QQ Plot for Example 2
The reason for this inconsistency is that the Kolmogorov-Smirnov test in the form presented above is only valid when the population mean and standard deviation are known, and not estimated from the sample. In the case where the population mean and standard deviation are not known, you need to use the Lilliefors version of the test, as described below.
Worksheet Functions
Real Statistics Excel Function: The following functions are provided in the Real Statistics Resource Pack:
KSCRIT(n, α, tails, interp) = the critical value of the Kolmogorov-Smirnov test for a sample of size n, for the given value of alpha (default = .05) and tails = 1 (one tail) or 2 (two tails, default), based on the KS Table. If interp = TRUE (default) then the recommended interpolation is used; otherwise linear interpolation is used.
KSPROB(x, n, tails, iter, interp, txt) = an approximate p-value for the KS test for the Dn value equal to x for a sample of size n and tails = 1 (one tail) or 2 (two tails, default) based on a linear interpolation (if interp = FALSE) or recommended interpolation (if interp = TRUE, default) of the values in the Kolmogorov-Smirnov Table, using iter number of iterations (default = 40).
Note that the values for α in the Kolmogorov-Smirnov Table range from .001 to .2 (for tails = 2) and .0005 to .1 for tails = 1. When txt = FALSE (default), if the p-value is less than .001 (tails = 2) or .0005 (tails = 1) then the p-value is given as 0 and if the p-value is greater than .2 (tails = 2) or .1 (tails = 1) then the p-value is given as 1. When txt = TRUE, then the output takes the form “< .001”, “< .0005”, “> .2” or “> .1”.
For Example 2, KSCRIT(15, .05, 2) = .338 (the same as shown in cell H21 of Figure 4). Also note that the p-value = KSPROB(H20, B21) = KSPROB(0.184177, 15) = 1 (meaning that p-value > .2), and so once again we can’t reject the null hypothesis that the data is normally distributed.
If the value of Dn had been .35 in Example 2, then Dn = .35 > .338 = Dcrit, and so we would have rejected the null hypothesis that the data is normally distributed. In this case, we would have seen that p-value = KSPROB(.35,15) = .0427, which once again leads us to reject the null hypothesis.
Kolmogorov Distribution
As referenced above, the Kolmogorov distribution can be useful in conducting the Kolmogorov-Smirnov test. Click here for more information about this distribution, including some useful functions provided by the Real Statistics Resource Pack.
Lilliefors Test
When the population mean and standard deviation for the Kolmogorov-Smirnov Test is estimated from the sample mean and standard deviation, as was done in Example 1 and 2, then the Kolmogorov-Smirnov Table yields results that are too conservative. More accurate results can be derived from the Liiliefors Table as described in the Lilliefors Test for Normality.
References
National Institute of Standards and Tecnology NIST (2021) Kolmogorov-Smirnov goodness-of-fit test
https://www.itl.nist.gov/div898/handbook/eda/section3/eda35g.htm
Wikipedia (2012) Kolmogorov-Smirnov test
https://en.wikipedia.org/wiki/Kolmogorov%E2%80%93Smirnov_test


