
Время на прочтение
10 мин
Количество просмотров 290K
Первая часть статьи была опубликована тут.
Как читать и редактировать Excel файлы при помощи openpyxl
ПЕРЕВОД
Оригинал статьи — www.datacamp.com/community/tutorials/python-excel-tutorial
Автор — Karlijn Willems
Эта библиотека пригодится, если вы хотите читать и редактировать файлы .xlsx, xlsm, xltx и xltm.
Установите openpyxl using pip. Общие рекомендации по установке этой библиотеки — сделать это в виртуальной среде Python без системных библиотек. Вы можете использовать виртуальную среду для создания изолированных сред Python: она создает папку, содержащую все необходимые файлы, для использования библиотек, которые потребуются для Python.
Перейдите в директорию, в которой находится ваш проект, и повторно активируйте виртуальную среду venv. Затем перейдите к установке openpyxl с помощью pip, чтобы убедиться, что вы можете читать и записывать с ним файлы:
# Activate virtualenv
$ source activate venv

# Install `openpyxl` in `venv`
$ pip install openpyxl
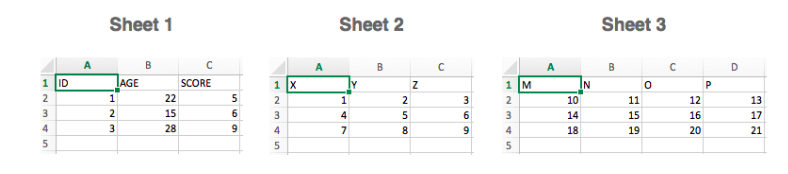
Теперь, когда вы установили openpyxl, вы можете начать загрузку данных. Но что именно это за данные? Например, в книге с данными, которые вы пытаетесь получить на Python, есть следующие листы:
Функция load_workbook () принимает имя файла в качестве аргумента и возвращает объект рабочей книги, который представляет файл. Это можно проверить запуском type (wb). Не забудьте убедиться, что вы находитесь в правильной директории, где расположена электронная таблица. В противном случае вы получите сообщение об ошибке при импорте.
# Import `load_workbook` module from `openpyxl`
from openpyxl import load_workbook

# Load in the workbook
wb = load_workbook('./test.xlsx')

# Get sheet names
print(wb.get_sheet_names())
Помните, вы можете изменить рабочий каталог с помощью os.chdir (). Фрагмент кода выше возвращает имена листов книги, загруженной в Python. Вы можете использовать эту информацию для получения отдельных листов книги. Также вы можете проверить, какой лист активен в настоящий момент с помощью wb.active. В приведенном ниже коде, вы также можете использовать его для загрузки данных на другом листе книги:
# Get a sheet by name
sheet = wb.get_sheet_by_name('Sheet3')

# Print the sheet title
sheet.title

# Get currently active sheet
anotherSheet = wb.active

# Check `anotherSheet`
anotherSheet
На первый взгляд, с этими объектами Worksheet мало что можно сделать. Однако, можно извлекать значения из определенных ячеек на листе книги, используя квадратные скобки [], к которым нужно передавать точную ячейку, из которой вы хотите получить значение.
Обратите внимание, это похоже на выбор, получение и индексирование массивов NumPy и Pandas DataFrames, но это еще не все, что нужно сделать, чтобы получить значение. Нужно еще добавить значение атрибута:
# Retrieve the value of a certain cell
sheet['A1'].value

# Select element 'B2' of your sheet
c = sheet['B2']

# Retrieve the row number of your element
c.row

# Retrieve the column letter of your element
c.column

# Retrieve the coordinates of the cell
c.coordinate
Помимо value, есть и другие атрибуты, которые можно использовать для проверки ячейки, а именно row, column и coordinate:
Атрибут row вернет 2;
Добавление атрибута column к “С” даст вам «B»;
coordinate вернет «B2».
Вы также можете получить значения ячеек с помощью функции cell (). Передайте аргументы row и column, добавьте значения к этим аргументам, которые соответствуют значениям ячейки, которые вы хотите получить, и, конечно же, не забудьте добавить атрибут value:
# Retrieve cell value
sheet.cell(row=1, column=2).value

# Print out values in column 2
for i in range(1, 4):
     print(i, sheet.cell(row=i, column=2).value)
Обратите внимание: если вы не укажете значение атрибута value, вы получите <Cell Sheet3.B1>, который ничего не говорит о значении, которое содержится в этой конкретной ячейке.
Вы используете цикл с помощью функции range (), чтобы помочь вам вывести значения строк, которые имеют значения в столбце 2. Если эти конкретные ячейки пусты, вы получите None.
Более того, существуют специальные функции, которые вы можете вызвать, чтобы получить другие значения, например get_column_letter () и column_index_from_string.
В двух функциях уже более или менее указано, что вы можете получить, используя их. Но лучше всего сделать их явными: пока вы можете получить букву прежнего столбца, можно сделать обратное или получить индекс столбца, перебирая букву за буквой. Как это работает:
# Import relevant modules from `openpyxl.utils`
from openpyxl.utils import get_column_letter, column_index_from_string

# Return 'A'
get_column_letter(1)

# Return '1'
column_index_from_string('A')
Вы уже получили значения для строк, которые имеют значения в определенном столбце, но что нужно сделать, если нужно вывести строки файла, не сосредотачиваясь только на одном столбце?
Конечно, использовать другой цикл.
Например, вы хотите сосредоточиться на области, находящейся между «A1» и «C3», где первый указывает левый верхний угол, а второй — правый нижний угол области, на которой вы хотите сфокусироваться. Эта область будет так называемой cellObj, которую вы видите в первой строке кода ниже. Затем вы указываете, что для каждой ячейки, которая находится в этой области, вы хотите вывести координату и значение, которое содержится в этой ячейке. После окончания каждой строки вы хотите выводить сообщение-сигнал о том, что строка этой области cellObj была выведена.
# Print row per row
for cellObj in sheet['A1':'C3']:
      for cell in cellObj:
              print(cells.coordinate, cells.value)
      print('--- END ---')
Обратите внимание, что выбор области очень похож на выбор, получение и индексирование списка и элементы NumPy, где вы также используете квадратные скобки и двоеточие чтобы указать область, из которой вы хотите получить значения. Кроме того, вышеприведенный цикл также хорошо использует атрибуты ячейки!
Чтобы визуализировать описанное выше, возможно, вы захотите проверить результат, который вернет вам завершенный цикл:
('A1', u'M')
('B1', u'N')
('C1', u'O')
--- END ---
('A2', 10L)
('B2', 11L)
('C2', 12L)
--- END ---
('A3', 14L)
('B3', 15L)
('C3', 16L)
--- END ---
Наконец, есть некоторые атрибуты, которые вы можете использовать для проверки результата импорта, а именно max_row и max_column. Эти атрибуты, конечно, являются общими способами обеспечения правильной загрузки данных, но тем не менее в данном случае они могут и будут полезны.
# Retrieve the maximum amount of rows
sheet.max_row

# Retrieve the maximum amount of columns
sheet.max_column
Это все очень классно, но мы почти слышим, что вы сейчас думаете, что это ужасно трудный способ работать с файлами, особенно если нужно еще и управлять данными.
Должно быть что-то проще, не так ли? Всё так!
Openpyxl имеет поддержку Pandas DataFrames. И можно использовать функцию DataFrame () из пакета Pandas, чтобы поместить значения листа в DataFrame:
# Import `pandas`
import pandas as pd

# Convert Sheet to DataFrame
df = pd.DataFrame(sheet.values)
Если вы хотите указать заголовки и индексы, вам нужно добавить немного больше кода:
# Put the sheet values in `data`
data = sheet.values

# Indicate the columns in the sheet values
cols = next(data)[1:]

# Convert your data to a list
data = list(data)

# Read in the data at index 0 for the indices
idx = [r[0] for r in data]

# Slice the data at index 1
data = (islice(r, 1, None) for r in data)

# Make your DataFrame
df = pd.DataFrame(data, index=idx, columns=cols)
Затем вы можете начать управлять данными при помощи всех функций, которые есть в Pandas. Но помните, что вы находитесь в виртуальной среде, поэтому, если библиотека еще не подключена, вам нужно будет установить ее снова через pip.
Чтобы записать Pandas DataFrames обратно в файл Excel, можно использовать функцию dataframe_to_rows () из модуля utils:
# Import `dataframe_to_rows`
from openpyxl.utils.dataframe import dataframe_to_rows

# Initialize a workbook
wb = Workbook()

# Get the worksheet in the active workbook
ws = wb.active

# Append the rows of the DataFrame to your worksheet
for r in dataframe_to_rows(df, index=True, header=True):
    ws.append(r)
Но это определенно не все! Библиотека openpyxl предлагает вам высокую гибкость в отношении того, как вы записываете свои данные в файлы Excel, изменяете стили ячеек или используете режим только для записи. Это делает ее одной из тех библиотек, которую вам точно необходимо знать, если вы часто работаете с электронными таблицами.
И не забудьте деактивировать виртуальную среду, когда закончите работу с данными!
Теперь давайте рассмотрим некоторые другие библиотеки, которые вы можете использовать для получения данных в электронной таблице на Python.
Готовы узнать больше?
Чтение и форматирование Excel файлов xlrd
Эта библиотека идеальна, если вы хотите читать данные и форматировать данные в файлах с расширением .xls или .xlsx.
# Import `xlrd`
import xlrd

# Open a workbook
workbook = xlrd.open_workbook('example.xls')

# Loads only current sheets to memory
workbook = xlrd.open_workbook('example.xls', on_demand = True)
Если вы не хотите рассматривать всю книгу, можно использовать такие функции, как sheet_by_name () или sheet_by_index (), чтобы извлекать листы, которые необходимо использовать в анализе.
# Load a specific sheet by name
worksheet = workbook.sheet_by_name('Sheet1')

# Load a specific sheet by index
worksheet = workbook.sheet_by_index(0)

# Retrieve the value from cell at indices (0,0)
sheet.cell(0, 0).value
Наконец, можно получить значения по определенным координатам, обозначенным индексами.
О том, как xlwt и xlutils, соотносятся с xlrd расскажем дальше.
Запись данных в Excel файл при помощи xlrd
Если нужно создать электронные таблицы, в которых есть данные, кроме библиотеки XlsxWriter можно использовать библиотеки xlwt. Xlwt идеально подходит для записи и форматирования данных в файлы с расширением .xls.
Когда вы вручную хотите записать в файл, это будет выглядеть так:
# Import `xlwt`
import xlwt
# Initialize a workbook
book = xlwt.Workbook(encoding="utf-8")
# Add a sheet to the workbook
sheet1 = book.add_sheet("Python Sheet 1")
# Write to the sheet of the workbook
sheet1.write(0, 0, "This is the First Cell of the First Sheet")
# Save the workbook
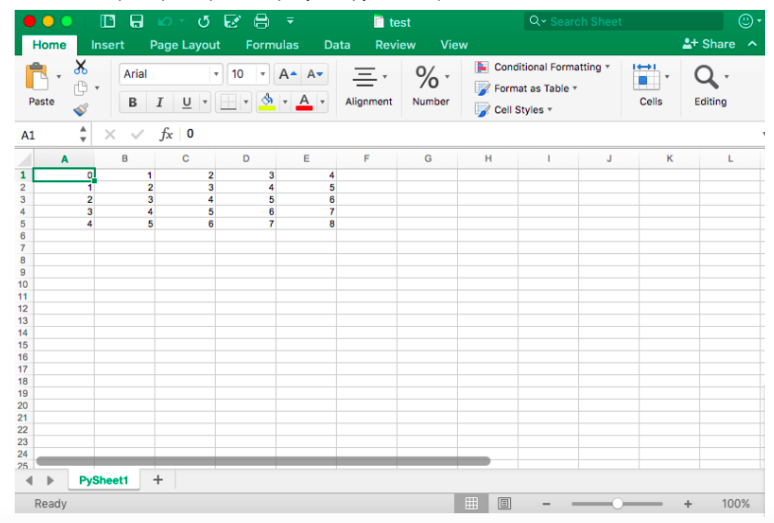
book.save("spreadsheet.xls")Если нужно записать данные в файл, то для минимизации ручного труда можно прибегнуть к циклу for. Это позволит немного автоматизировать процесс. Делаем скрипт, в котором создается книга, в которую добавляется лист. Далее указываем список со столбцами и со значениями, которые будут перенесены на рабочий лист.
Цикл for будет следить за тем, чтобы все значения попадали в файл: задаем, что с каждым элементом в диапазоне от 0 до 4 (5 не включено) мы собираемся производить действия. Будем заполнять значения строка за строкой. Для этого указываем row элемент, который будет “прыгать” в каждом цикле. А далее у нас следующий for цикл, который пройдется по столбцам листа. Задаем условие, что для каждой строки на листе смотрим на столбец и заполняем значение для каждого столбца в строке. Когда заполнили все столбцы строки значениями, переходим к следующей строке, пока не заполним все имеющиеся строки.
# Initialize a workbook
book = xlwt.Workbook()

# Add a sheet to the workbook
sheet1 = book.add_sheet("Sheet1")

# The data
cols = ["A", "B", "C", "D", "E"]
txt = [0,1,2,3,4]

# Loop over the rows and columns and fill in the values
for num in range(5):
      row = sheet1.row(num)
      for index, col in enumerate(cols):
          value = txt[index] + num
          row.write(index, value)

# Save the result
book.save("test.xls")
В качестве примера скриншот результирующего файла:
Теперь, когда вы видели, как xlrd и xlwt взаимодействуют вместе, пришло время посмотреть на библиотеку, которая тесно связана с этими двумя: xlutils.
Коллекция утилит xlutils
Эта библиотека в основном представляет собой набор утилит, для которых требуются как xlrd, так и xlwt. Включает в себя возможность копировать и изменять/фильтровать существующие файлы. Вообще говоря, оба этих случая подпадают теперь под openpyxl.
Использование pyexcel для чтения файлов .xls или .xlsx
Еще одна библиотека, которую можно использовать для чтения данных таблиц в Python — pyexcel. Это Python Wrapper, который предоставляет один API для чтения, обработки и записи данных в файлах .csv, .ods, .xls, .xlsx и .xlsm.
Чтобы получить данные в массиве, можно использовать функцию get_array (), которая содержится в пакете pyexcel:
# Import `pyexcel`
import pyexcel

# Get an array from the data
my_array = pyexcel.get_array(file_name="test.xls")

Также можно получить данные в упорядоченном словаре списков, используя функцию get_dict ():
# Import `OrderedDict` module
from pyexcel._compact import OrderedDict

# Get your data in an ordered dictionary of lists
my_dict = pyexcel.get_dict(file_name="test.xls", name_columns_by_row=0)

# Get your data in a dictionary of 2D arrays
book_dict = pyexcel.get_book_dict(file_name="test.xls")
Однако, если вы хотите вернуть в словарь двумерные массивы или, иными словами, получить все листы книги в одном словаре, стоит использовать функцию get_book_dict ().
Имейте в виду, что обе упомянутые структуры данных, массивы и словари вашей электронной таблицы, позволяют создавать DataFrames ваших данных с помощью pd.DataFrame (). Это упростит обработку ваших данных!
Наконец, вы можете просто получить записи с pyexcel благодаря функции get_records (). Просто передайте аргумент file_name функции и обратно получите список словарей:
# Retrieve the records of the file
records = pyexcel.get_records(file_name="test.xls")
Записи файлов при помощи pyexcel
Так же, как загрузить данные в массивы с помощью этого пакета, можно также легко экспортировать массивы обратно в электронную таблицу. Для этого используется функция save_as () с передачей массива и имени целевого файла в аргумент dest_file_name:
# Get the data
data = [[1, 2, 3], [4, 5, 6], [7, 8, 9]]

# Save the array to a file
pyexcel.save_as(array=data, dest_file_name="array_data.xls")
Обратите внимание: если указать разделитель, то можно добавить аргумент dest_delimiter и передать символ, который хотите использовать, в качестве разделителя между “”.
Однако, если у вас есть словарь, нужно будет использовать функцию save_book_as (). Передайте двумерный словарь в bookdict и укажите имя файла, и все ОК:
# The data
2d_array_dictionary = {'Sheet 1': [
                                   ['ID', 'AGE', 'SCORE']
                                   [1, 22, 5],
                                   [2, 15, 6],
                                   [3, 28, 9]
                                  ],
                       'Sheet 2': [
                                    ['X', 'Y', 'Z'],
                                    [1, 2, 3],
                                    [4, 5, 6]
                                    [7, 8, 9]
                                  ],
                       'Sheet 3': [
                                    ['M', 'N', 'O', 'P'],
                                    [10, 11, 12, 13],
                                    [14, 15, 16, 17]
                                    [18, 19, 20, 21]
                                   ]}

# Save the data to a file
pyexcel.save_book_as(bookdict=2d_array_dictionary, dest_file_name="2d_array_data.xls")
Помните, что когда используете код, который напечатан в фрагменте кода выше, порядок данных в словаре не будет сохранен!
Чтение и запись .csv файлов
Если вы все еще ищете библиотеки, которые позволяют загружать и записывать данные в CSV-файлы, кроме Pandas, рекомендуем библиотеку csv:
# import `csv`
import csv

# Read in csv file
for row in csv.reader(open('data.csv'), delimiter=','):
      print(row)

# Write csv file
data = [[1, 2, 3], [4, 5, 6], [7, 8, 9]]
outfile = open('data.csv', 'w')
writer = csv.writer(outfile, delimiter=';', quotechar='"')
writer.writerows(data)
outfile.close()
Обратите внимание, что NumPy имеет функцию genfromtxt (), которая позволяет загружать данные, содержащиеся в CSV-файлах в массивах, которые затем можно помещать в DataFrames.
Финальная проверка данных
Когда данные подготовлены, не забудьте последний шаг: проверьте правильность загрузки данных. Если вы поместили свои данные в DataFrame, вы можете легко и быстро проверить, был ли импорт успешным, выполнив следующие команды:
# Check the first entries of the DataFrame
df1.head()

# Check the last entries of the DataFrame
df1.tail()
Note: Используйте DataCamp Pandas Cheat Sheet, когда вы планируете загружать файлы в виде Pandas DataFrames.
Если данные в массиве, вы можете проверить его, используя следующие атрибуты массива: shape, ndim, dtype и т.д.:
# Inspect the shape
data.shape

# Inspect the number of dimensions
data.ndim

# Inspect the data type
data.dtype
Что дальше?
Поздравляем, теперь вы знаете, как читать файлы Excel в Python  Но импорт данных — это только начало рабочего процесса в области данных. Когда у вас есть данные из электронных таблиц в вашей среде, вы можете сосредоточиться на том, что действительно важно: на анализе данных.
Если вы хотите глубже погрузиться в тему — знакомьтесь с PyXll, которая позволяет записывать функции в Python и вызывать их в Excel.
Installation
Install openpyxl using pip. It is advisable to do this in a Python virtualenv
without system packages:
Note
There is support for the popular lxml library which will be used if it
is installed. This is particular useful when creating large files.
Warning
To be able to include images (jpeg, png, bmp,…) into an openpyxl file,
you will also need the “pillow” library that can be installed with:
or browse https://pypi.python.org/pypi/Pillow/, pick the latest version
and head to the bottom of the page for Windows binaries.
Working with a checkout
Sometimes you might want to work with the checkout of a particular version.
This may be the case if bugs have been fixed but a release has not yet been
made.
$ pip install -e hg+https://foss.heptapod.net/openpyxl/openpyxl/@3.1#egg=openpyxl
Create a workbook
There is no need to create a file on the filesystem to get started with openpyxl.
Just import the Workbook class and start work:
>>> from openpyxl import Workbook
>>> wb = Workbook()
A workbook is always created with at least one worksheet. You can get it by
using the Workbook.active property:
Note
This is set to 0 by default. Unless you modify its value, you will always
get the first worksheet by using this method.
You can create new worksheets using the Workbook.create_sheet() method:
>>> ws1 = wb.create_sheet("Mysheet") # insert at the end (default)
# or
>>> ws2 = wb.create_sheet("Mysheet", 0) # insert at first position
# or
>>> ws3 = wb.create_sheet("Mysheet", -1) # insert at the penultimate position
Sheets are given a name automatically when they are created.
They are numbered in sequence (Sheet, Sheet1, Sheet2, …).
You can change this name at any time with the Worksheet.title property:
Once you gave a worksheet a name, you can get it as a key of the workbook:
>>> ws3 = wb["New Title"]
You can review the names of all worksheets of the workbook with the
Workbook.sheetname attribute
>>> print(wb.sheetnames)
['Sheet2', 'New Title', 'Sheet1']
You can loop through worksheets
>>> for sheet in wb:
...     print(sheet.title)
You can create copies of worksheets within a single workbook:
Workbook.copy_worksheet() method:
>>> source = wb.active
>>> target = wb.copy_worksheet(source)
Note
Only cells (including values, styles, hyperlinks and comments) and
certain worksheet attributes (including dimensions, format and
properties) are copied. All other workbook / worksheet attributes
are not copied — e.g. Images, Charts.
You also cannot copy worksheets between workbooks. You cannot copy
a worksheet if the workbook is open in read-only or write-only
mode.
Playing with data
Accessing one cell
Now we know how to get a worksheet, we can start modifying cells content.
Cells can be accessed directly as keys of the worksheet:
This will return the cell at A4, or create one if it does not exist yet.
Values can be directly assigned:
There is also the Worksheet.cell() method.
This provides access to cells using row and column notation:
>>> d = ws.cell(row=4, column=2, value=10)
Note
When a worksheet is created in memory, it contains no cells. They are
created when first accessed.
Warning
Because of this feature, scrolling through cells instead of accessing them
directly will create them all in memory, even if you don’t assign them a value.
Something like
>>> for x in range(1,101):
...        for y in range(1,101):
...            ws.cell(row=x, column=y)
will create 100×100 cells in memory, for nothing.
Accessing many cells
Ranges of cells can be accessed using slicing:
>>> cell_range = ws['A1':'C2']
Ranges of rows or columns can be obtained similarly:
>>> colC = ws['C']
>>> col_range = ws['C:D']
>>> row10 = ws[10]
>>> row_range = ws[5:10]
You can also use the Worksheet.iter_rows() method:
>>> for row in ws.iter_rows(min_row=1, max_col=3, max_row=2):
...    for cell in row:
...        print(cell)
<Cell Sheet1.A1>
<Cell Sheet1.B1>
<Cell Sheet1.C1>
<Cell Sheet1.A2>
<Cell Sheet1.B2>
<Cell Sheet1.C2>
Likewise the Worksheet.iter_cols() method will return columns:
>>> for col in ws.iter_cols(min_row=1, max_col=3, max_row=2):
...     for cell in col:
...         print(cell)
<Cell Sheet1.A1>
<Cell Sheet1.A2>
<Cell Sheet1.B1>
<Cell Sheet1.B2>
<Cell Sheet1.C1>
<Cell Sheet1.C2>
Note
For performance reasons the Worksheet.iter_cols() method is not available in read-only mode.
If you need to iterate through all the rows or columns of a file, you can instead use the
Worksheet.rows property:
>>> ws = wb.active
>>> ws['C9'] = 'hello world'
>>> tuple(ws.rows)
((<Cell Sheet.A1>, <Cell Sheet.B1>, <Cell Sheet.C1>),
(<Cell Sheet.A2>, <Cell Sheet.B2>, <Cell Sheet.C2>),
(<Cell Sheet.A3>, <Cell Sheet.B3>, <Cell Sheet.C3>),
(<Cell Sheet.A4>, <Cell Sheet.B4>, <Cell Sheet.C4>),
(<Cell Sheet.A5>, <Cell Sheet.B5>, <Cell Sheet.C5>),
(<Cell Sheet.A6>, <Cell Sheet.B6>, <Cell Sheet.C6>),
(<Cell Sheet.A7>, <Cell Sheet.B7>, <Cell Sheet.C7>),
(<Cell Sheet.A8>, <Cell Sheet.B8>, <Cell Sheet.C8>),
(<Cell Sheet.A9>, <Cell Sheet.B9>, <Cell Sheet.C9>))
or the Worksheet.columns property:
>>> tuple(ws.columns)
((<Cell Sheet.A1>,
<Cell Sheet.A2>,
<Cell Sheet.A3>,
<Cell Sheet.A4>,
<Cell Sheet.A5>,
<Cell Sheet.A6>,
...
<Cell Sheet.B7>,
<Cell Sheet.B8>,
<Cell Sheet.B9>),
(<Cell Sheet.C1>,
<Cell Sheet.C2>,
<Cell Sheet.C3>,
<Cell Sheet.C4>,
<Cell Sheet.C5>,
<Cell Sheet.C6>,
<Cell Sheet.C7>,
<Cell Sheet.C8>,
<Cell Sheet.C9>))
Note
For performance reasons the Worksheet.columns property is not available in read-only mode.
Values only
If you just want the values from a worksheet you can use the Worksheet.values property.
This iterates over all the rows in a worksheet but returns just the cell values:
for row in ws.values:
   for value in row:
     print(value)
Both Worksheet.iter_rows() and Worksheet.iter_cols() can
take the values_only parameter to return just the cell’s value:
>>> for row in ws.iter_rows(min_row=1, max_col=3, max_row=2, values_only=True):
...   print(row)

(None, None, None)
(None, None, None)
Data storage
Once we have a Cell, we can assign it a value:
>>> c.value = 'hello, world'
>>> print(c.value)
'hello, world'

>>> d.value = 3.14
>>> print(d.value)
3.14
Saving to a file
The simplest and safest way to save a workbook is by using the
Workbook.save() method of the Workbook object:
>>> wb = Workbook()
>>> wb.save('balances.xlsx')
Warning
This operation will overwrite existing files without warning.
Note
The filename extension is not forced to be xlsx or xlsm, although you might have
some trouble opening it directly with another application if you don’t
use an official extension.
As OOXML files are basically ZIP files, you can also open it with your
favourite ZIP archive manager.
If required, you can specify the attribute wb.template=True, to save a workbook
as a template:
>>> wb = load_workbook('document.xlsx')
>>> wb.template = True
>>> wb.save('document_template.xltx')
Saving as a stream
If you want to save the file to a stream, e.g. when using a web application
such as Pyramid, Flask or Django then you can simply provide a
NamedTemporaryFile():
>>> from tempfile import NamedTemporaryFile
>>> from openpyxl import Workbook
>>> wb = Workbook()
>>> with NamedTemporaryFile() as tmp:
        wb.save(tmp.name)
        tmp.seek(0)
        stream = tmp.read()
Warning
You should monitor the data attributes and document extensions
for saving documents in the document templates and vice versa,
otherwise the result table engine can not open the document.
Note
The following will fail:
>>> wb = load_workbook('document.xlsx')
>>> # Need to save with the extension *.xlsx
>>> wb.save('new_document.xlsm')
>>> # MS Excel can't open the document
>>>
>>> # or
>>>
>>> # Need specify attribute keep_vba=True
>>> wb = load_workbook('document.xlsm')
>>> wb.save('new_document.xlsm')
>>> # MS Excel will not open the document
>>>
>>> # or
>>>
>>> wb = load_workbook('document.xltm', keep_vba=True)
>>> # If we need a template document, then we must specify extension as *.xltm.
>>> wb.save('new_document.xlsm')
>>> # MS Excel will not open the document
Loading from a file
You can use the openpyxl.load_workbook() to open an existing workbook:
>>> from openpyxl import load_workbook
>>> wb = load_workbook(filename = 'empty_book.xlsx')
>>> sheet_ranges = wb['range names']
>>> print(sheet_ranges['D18'].value)
3
Note
There are several flags that can be used in load_workbook.
- data_only controls whether cells with formulae have either the
formula (default) or the value stored the last time Excel read the sheet.
- keep_vba controls whether any Visual Basic elements are preserved or
not (default). If they are preserved they are still not editable.
- read-only opens workbooks in a read-only mode. This uses much less
memory and is faster but not all features are available (charts, images,
etc.)
- rich_text controls whether any rich-text formatting in cells is
preserved. The default is False.
- keep_links controls whether data cached from external workbooks is
preserved.
Warning
openpyxl does currently not read all possible items in an Excel file so
shapes will be lost from existing files if they are opened and saved with
the same name.
Errors loading workbooks
Sometimes openpyxl will fail to open a workbook. This is usually because there is something wrong with the file.
If this is the case then openpyxl will try and provide some more information. Openpyxl follows the OOXML specification closely and will reject files that do not because they are invalid. When this happens you can use the exception from openpyxl to inform the developers of whichever application or library produced the file. As the OOXML specification is publicly available it is important that developers follow it.
You can find the spec by searching for ECMA-376, most of the implementation specifics are in Part 4.
This ends the tutorial for now, you can proceed to the Simple usage section
You all must have worked with Excel at some time in your life and must have felt the need for automating some repetitive or tedious task. Don’t worry in this tutorial we are going to learn about how to work with Excel using Python, or automating Excel using Python. We will be covering this with the help of the Openpyxl module.
Getting Started
Openpyxl is a Python library that provides various methods to interact with Excel Files using Python. It allows operations like reading, writing, arithmetic operations, plotting graphs, etc.
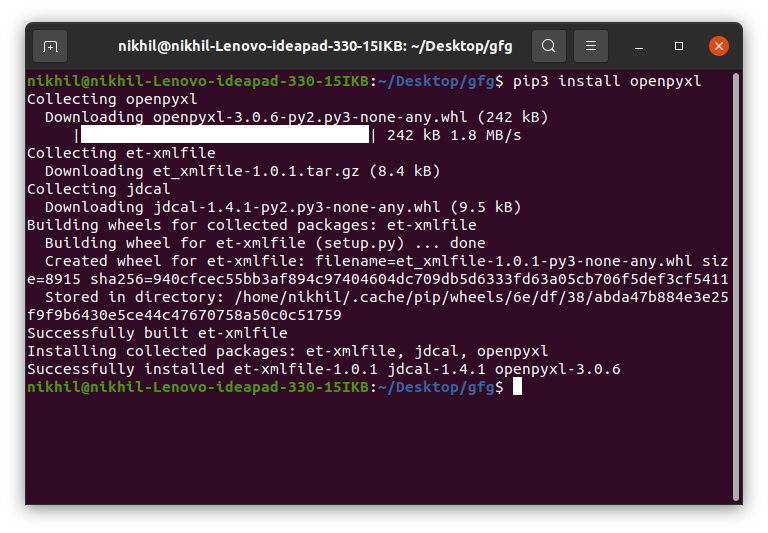
This module does not come in-built with Python. To install this type the below command in the terminal.
pip install openpyxl
Reading from Spreadsheets
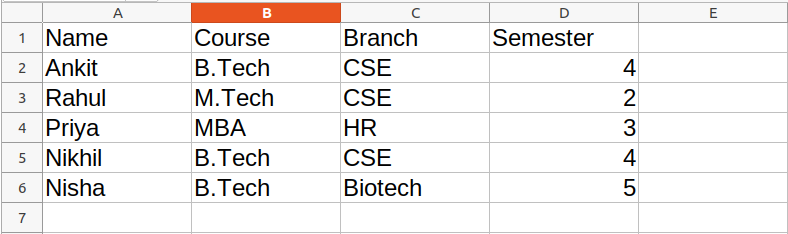
To read an Excel file you have to open the spreadsheet using the load_workbook() method. After that, you can use the active to select the first sheet available and the cell attribute to select the cell by passing the row and column parameter. The value attribute prints the value of the particular cell. See the below example to get a better understanding.
Note: The first row or column integer is 1, not 0.
Dataset Used: It can be downloaded from here.
Example:
Python3
import openpyxl
path = "gfg.xlsx"
wb_obj = openpyxl.load_workbook(path)
sheet_obj = wb_obj.active
cell_obj = sheet_obj.cell(row = 1, column = 1)
print(cell_obj.value)
Output:
Name
Reading from Multiple Cells
There can be two ways of reading from multiple cells.
Method 1: We can get the count of the total rows and columns using the max_row and max_column respectively. We can use these values inside the for loop to get the value of the desired row or column or any cell depending upon the situation. Let’s see how to get the value of the first column and first row.
Example:
Python3
import openpyxl
path = "gfg.xlsx"
wb_obj = openpyxl.load_workbook(path)
sheet_obj = wb_obj.active
row = sheet_obj.max_row
column = sheet_obj.max_column
print("Total Rows:", row)
print("Total Columns:", column)
print("nValue of first column")
for i in range(1, row + 1):
cell_obj = sheet_obj.cell(row = i, column = 1)
print(cell_obj.value)
print("nValue of first row")
for i in range(1, column + 1):
cell_obj = sheet_obj.cell(row = 2, column = i)
print(cell_obj.value, end = " ")
Output:
Total Rows: 6
Total Columns: 4

Value of first column
Name
Ankit
Rahul
Priya
Nikhil
Nisha

Value of first row
Ankit  B.Tech CSE 4
Method 2: We can also read from multiple cells using the cell name. This can be seen as the list slicing of Python.
Python3
import openpyxl
path = "gfg.xlsx"
wb_obj = openpyxl.load_workbook(path)
sheet_obj = wb_obj.active
cell_obj = sheet_obj['A1': 'B6']
for cell1, cell2 in cell_obj:
print(cell1.value, cell2.value)
Output:
Name Course
Ankit  B.Tech
Rahul M.Tech
Priya MBA
Nikhil B.Tech
Nisha B.Tech
Refer to the below article to get detailed information about reading excel files using openpyxl.
- Reading an excel file using Python openpyxl module
Writing to Spreadsheets
First, let’s create a new spreadsheet, and then we will write some data to the newly created file. An empty spreadsheet can be created using the Workbook() method. Let’s see the below example.
Example:
Python3
from openpyxl import Workbook
workbook = Workbook()
workbook.save(filename="sample.xlsx")
Output:
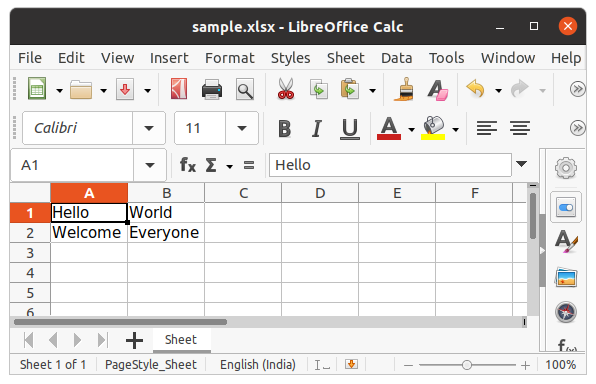
After creating an empty file, let’s see how to add some data to it using Python. To add data first we need to select the active sheet and then using the cell() method we can select any particular cell by passing the row and column number as its parameter. We can also write using cell names. See the below example for a better understanding.
Example:
Python3
import openpyxl
wb = openpyxl.Workbook()
sheet = wb.active
c1 = sheet.cell(row = 1, column = 1)
c1.value = "Hello"
c2 = sheet.cell(row= 1 , column = 2)
c2.value = "World"
c3 = sheet['A2']
c3.value = "Welcome"
c4 = sheet['B2']
c4.value = "Everyone"
wb.save("sample.xlsx")
Output:
Refer to the below article to get detailed information about writing to excel.
- Writing to an excel file using openpyxl module
Appending to the Spreadsheet
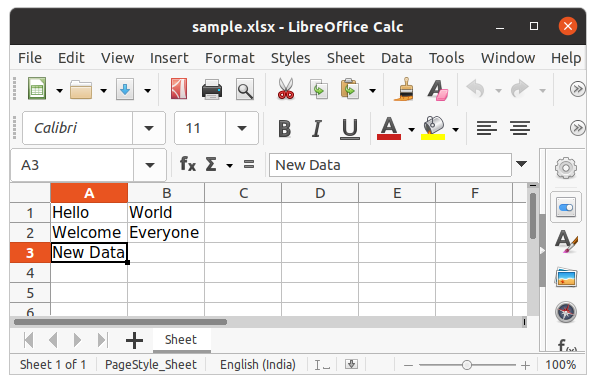
In the above example, you will see that every time you try to write to a spreadsheet the existing data gets overwritten, and the file is saved as a new file. This happens because the Workbook() method always creates a new workbook file object. To write to an existing workbook you must open the file with the load_workbook() method. We will use the above-created workbook.
Example:
Python3
import openpyxl
wb = openpyxl.load_workbook("sample.xlsx")
sheet = wb.active
c = sheet['A3']
c.value = "New Data"
wb.save("sample.xlsx")
Output:
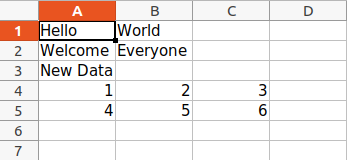
We can also use the append() method to append multiple data at the end of the sheet.
Example:
Python3
import openpyxl
wb = openpyxl.load_workbook("sample.xlsx")
sheet = wb.active
data = (
(1, 2, 3),
(4, 5, 6)
)
for row in data:
sheet.append(row)
wb.save('sample.xlsx')
Output:
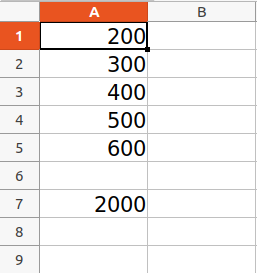
Arithmetic Operation on Spreadsheet
Arithmetic operations can be performed by typing the formula in a particular cell of the spreadsheet. For example, if we want to find the sum then =Sum() formula of the excel file is used.
Example:
Python3
import openpyxl
wb = openpyxl.Workbook()
sheet = wb.active
sheet['A1'] = 200
sheet['A2'] = 300
sheet['A3'] = 400
sheet['A4'] = 500
sheet['A5'] = 600
sheet['A7'] = '= SUM(A1:A5)'
wb.save("sum.xlsx")
Output:
Refer to the below article to get detailed information about the Arithmetic operations on Spreadsheet.
- Arithmetic operations in excel file using openpyxl
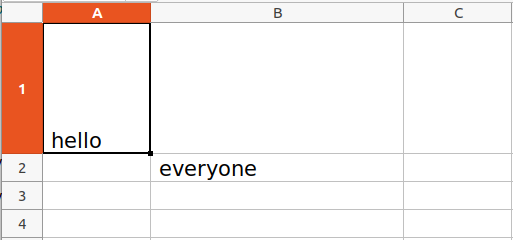
Adjusting Rows and Column
Worksheet objects have row_dimensions and column_dimensions attributes that control row heights and column widths. A sheet’s row_dimensions and column_dimensions are dictionary-like values; row_dimensions contains RowDimension objects and column_dimensions contains ColumnDimension objects. In row_dimensions, one can access one of the objects using the number of the row (in this case, 1 or 2). In column_dimensions, one can access one of the objects using the letter of the column (in this case, A or B).
Example:
Python3
import openpyxl
wb = openpyxl.Workbook()
sheet = wb.active
sheet.cell(row = 1, column = 1).value = ' hello '
sheet.cell(row = 2, column = 2).value = ' everyone '
sheet.row_dimensions[1].height = 70
sheet.column_dimensions['B'].width = 20
wb.save('sample.xlsx')
Output:
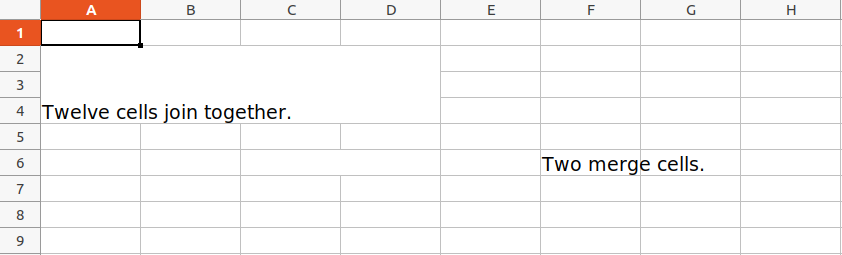
Merging Cells
A rectangular area of cells can be merged into a single cell with the merge_cells() sheet method. The argument to merge_cells() is a single string of the top-left and bottom-right cells of the rectangular area to be merged.
Example:
Python3
import openpyxl
wb = openpyxl.Workbook()
sheet = wb.active
sheet.merge_cells('A2:D4')
sheet.cell(row = 2, column = 1).value = 'Twelve cells join together.'
sheet.merge_cells('C6:D6')
sheet.cell(row = 6, column = 6).value = 'Two merge cells.'
wb.save('sample.xlsx')
Output:
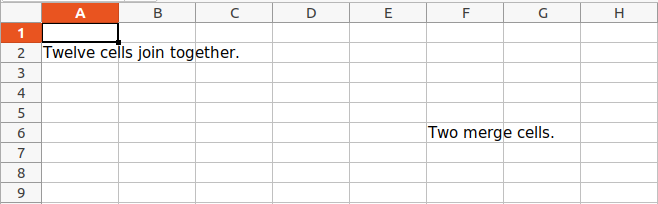
Unmerging Cells
To unmerge cells, call the unmerge_cells() sheet method.
Example:
Python3
import openpyxl
wb = openpyxl.load_workbook('sample.xlsx')
sheet = wb.active
sheet.unmerge_cells('A2:D4')
sheet.unmerge_cells('C6:D6')
wb.save('sample.xlsx')
Output:
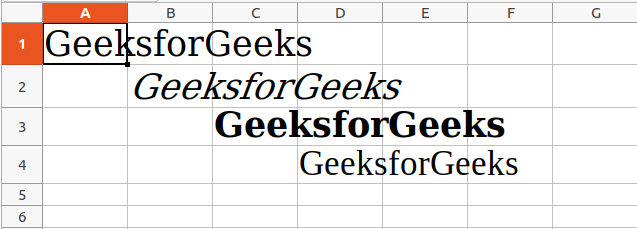
Setting Font Style
To customize font styles in cells, important, import the Font() function from the openpyxl.styles module.
Example:
Python3
import openpyxl
from openpyxl.styles import Font
wb = openpyxl.Workbook()
sheet = wb.active
sheet.cell(row = 1, column = 1).value = "GeeksforGeeks"
sheet.cell(row = 1, column = 1).font = Font(size = 24 )
sheet.cell(row = 2, column = 2).value = "GeeksforGeeks"
sheet.cell(row = 2, column = 2).font = Font(size = 24, italic = True)
sheet.cell(row = 3, column = 3).value = "GeeksforGeeks"
sheet.cell(row = 3, column = 3).font = Font(size = 24, bold = True)
sheet.cell(row = 4, column = 4).value = "GeeksforGeeks"
sheet.cell(row = 4, column = 4).font = Font(size = 24, name = 'Times New Roman')
wb.save('sample.xlsx')
Output:
Refer to the below article to get detailed information about adjusting rows and columns.
- Adjusting rows and columns of an excel file using openpyxl module
Plotting Charts
Charts are composed of at least one series of one or more data points. Series themselves are comprised of references to cell ranges. For plotting the charts on an excel sheet, firstly, create chart objects of specific chart class( i.e BarChart, LineChart, etc.). After creating chart objects, insert data in it, and lastly, add that chart object in the sheet object.
Example 1:
Python3
import openpyxl
from openpyxl.chart import BarChart, Reference
wb = openpyxl.Workbook()
sheet = wb.active
for i in range(10):
sheet.append([i])
values = Reference(sheet, min_col=1, min_row=1,
max_col=1, max_row=10)
chart = BarChart()
chart.add_data(values)
chart.title = " BAR-CHART "
chart.x_axis.title = " X_AXIS "
chart.y_axis.title = " Y_AXIS "
sheet.add_chart(chart, "E2")
wb.save("sample.xlsx")
Output:

Example 2:
Python3
import openpyxl
from openpyxl.chart import LineChart, Reference
wb = openpyxl.Workbook()
sheet = wb.active
for i in range(10):
sheet.append([i])
values = Reference(sheet, min_col=1, min_row=1,
max_col=1, max_row=10)
chart = LineChart()
chart.add_data(values)
chart.title = " LINE-CHART "
chart.x_axis.title = " X-AXIS "
chart.y_axis.title = " Y-AXIS "
sheet.add_chart(chart, "E2")
wb.save("sample.xlsx")
Output:

Refer to the below articles to get detailed information about plotting in excel using Python.
- Plotting charts in excel sheet using openpyxl module | Set 1
- Plotting charts in excel sheet using openpyxl module | Set 2
- Plotting charts in excel sheet using openpyxl module | Set 3
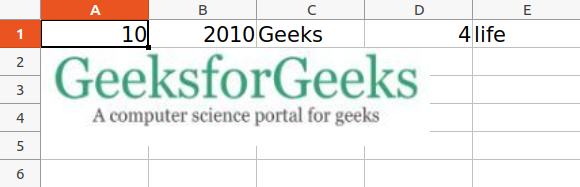
Adding Images
For the purpose of importing images inside our worksheet, we would be using openpyxl.drawing.image.Image. The method is a wrapper over PIL.Image method found in PIL (pillow) library. Due to which it is necessary for the PIL (pillow) library to be installed in order to use this method.
Image Used:

Example:
Python3
import openpyxl
from openpyxl.drawing.image import Image
wb = openpyxl.Workbook()
sheet = wb.active
sheet.append([10, 2010, "Geeks", 4, "life"])
img = Image("geek.jpg")
sheet.add_image(img, 'A2')
wb.save('sample.xlsx')
Output:
Refer to the below article to get detailed information about adding images.
- Openpyxl – Adding Image
Some More Functionality of Excel using Python
- How to delete one or more rows in excel using Openpyxl?
- Trigonometric operations in excel file using openpyxl
- How to copy data from one excel sheet to another
- How to Automate an Excel Sheet in Python?
Microsoft Excel is one of the most powerful spreadsheet software applications in the world, and it has become critical in all business processes. Companies across the world, both big and small, are using Microsoft Excel to store, organize, analyze, and visualize data.
As a data professional, when you combine Python with Excel, you create a unique data analysis bundle that unlocks the value of the enterprise data.
In this tutorial, we’re going to learn how to read and work with Excel files in Python.
After you finish this tutorial, you’ll understand the following:
- Loading Excel spreadsheets into pandas DataFrames
- Working with an Excel workbook with multiple spreadsheets
- Combining multiple spreadsheets
- Reading Excel files using the
xlrdpackage
In this tutorial, we assume you know the fundamentals of pandas DataFrames. If you aren’t familiar with the pandas library, you might like to try our Pandas and NumPy Fundamentals – Dataquest.
Let’s dive in.
Reading Spreadsheets with Pandas
Technically, multiple packages allow us to work with Excel files in Python. However, in this tutorial, we’ll use pandas and xlrd libraries to interact with Excel workbooks. Essentially, you can think of a pandas DataFrame as a spreadsheet with rows and columns stored in Series objects. Traversability of Series as iterable objects allows us to grab specific data easily. Once we load an Excel workbook into a pandas DataFrame, we can perform any kind of data analysis on the data.
Before we proceed to the next step, let’s first download the following spreadsheet:
Sales Data Excel Workbook — xlsx ver.
The Excel workbook consists of two sheets that contain stationery sales data for 2020 and 2021.
NOTE
Although Excel spreadsheets can contain formula and also support formatting, pandas only imports Excel spreadsheets as flat files, and it doesn’t support spreadsheet formatting.
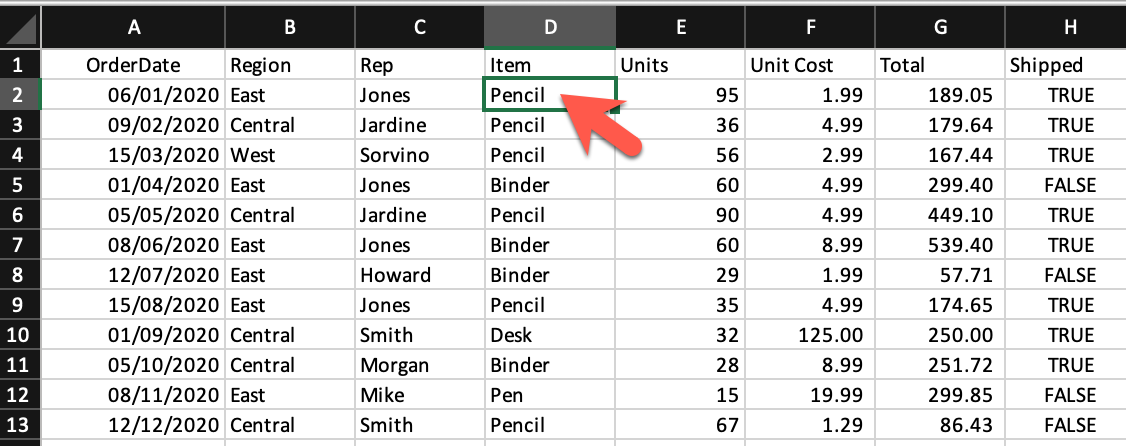
To import the Excel spreadsheet into a pandas DataFrame, first, we need to import the pandas package and then use the read_excel() method:
import pandas as pd
df = pd.read_excel('sales_data.xlsx')

display(df)| OrderDate | Region | Rep | Item | Units | Unit Cost | Total | Shipped | |
|---|---|---|---|---|---|---|---|---|
| 0 | 2020-01-06 | East | Jones | Pencil | 95 | 1.99 | 189.05 | True |
| 1 | 2020-02-09 | Central | Jardine | Pencil | 36 | 4.99 | 179.64 | True |
| 2 | 2020-03-15 | West | Sorvino | Pencil | 56 | 2.99 | 167.44 | True |
| 3 | 2020-04-01 | East | Jones | Binder | 60 | 4.99 | 299.40 | False |
| 4 | 2020-05-05 | Central | Jardine | Pencil | 90 | 4.99 | 449.10 | True |
| 5 | 2020-06-08 | East | Jones | Binder | 60 | 8.99 | 539.40 | True |
| 6 | 2020-07-12 | East | Howard | Binder | 29 | 1.99 | 57.71 | False |
| 7 | 2020-08-15 | East | Jones | Pencil | 35 | 4.99 | 174.65 | True |
| 8 | 2020-09-01 | Central | Smith | Desk | 32 | 125.00 | 250.00 | True |
| 9 | 2020-10-05 | Central | Morgan | Binder | 28 | 8.99 | 251.72 | True |
| 10 | 2020-11-08 | East | Mike | Pen | 15 | 19.99 | 299.85 | False |
| 11 | 2020-12-12 | Central | Smith | Pencil | 67 | 1.29 | 86.43 | False |
If you want to load only a limited number of rows into the DataFrame, you can specify the number of rows using the nrows argument:
df = pd.read_excel('sales_data.xlsx', nrows=5)
display(df)| OrderDate | Region | Rep | Item | Units | Unit Cost | Total | Shipped | |
|---|---|---|---|---|---|---|---|---|
| 0 | 2020-01-06 | East | Jones | Pencil | 95 | 1.99 | 189.05 | True |
| 1 | 2020-02-09 | Central | Jardine | Pencil | 36 | 4.99 | 179.64 | True |
| 2 | 2020-03-15 | West | Sorvino | Pencil | 56 | 2.99 | 167.44 | True |
| 3 | 2020-04-01 | East | Jones | Binder | 60 | 4.99 | 299.40 | False |
| 4 | 2020-05-05 | Central | Jardine | Pencil | 90 | 4.99 | 449.10 | True |
Skipping a specific number of rows from the begining of a spreadsheet or skipping over a list of particular rows is available through the skiprows argument, as follows:
df = pd.read_excel('sales_data.xlsx', skiprows=range(5))
display(df)| 2020-05-05 00:00:00 | Central | Jardine | Pencil | 90 | 4.99 | 449.1 | True | |
|---|---|---|---|---|---|---|---|---|
| 0 | 2020-06-08 | East | Jones | Binder | 60 | 8.99 | 539.40 | True |
| 1 | 2020-07-12 | East | Howard | Binder | 29 | 1.99 | 57.71 | False |
| 2 | 2020-08-15 | East | Jones | Pencil | 35 | 4.99 | 174.65 | True |
| 3 | 2020-09-01 | Central | Smith | Desk | 32 | 125.00 | 250.00 | True |
| 4 | 2020-10-05 | Central | Morgan | Binder | 28 | 8.99 | 251.72 | True |
| 5 | 2020-11-08 | East | Mike | Pen | 15 | 19.99 | 299.85 | False |
| 6 | 2020-12-12 | Central | Smith | Pencil | 67 | 1.29 | 86.43 | False |
The code above skips the first five rows and returns the rest of the data. Instead, the following code returns all the rows except for those with the mentioned indices:
df = pd.read_excel('sales_data.xlsx', skiprows=[1, 4,7,10])
display(df)| OrderDate | Region | Rep | Item | Units | Unit Cost | Total | Shipped | |
|---|---|---|---|---|---|---|---|---|
| 0 | 2020-02-09 | Central | Jardine | Pencil | 36 | 4.99 | 179.64 | True |
| 1 | 2020-03-15 | West | Sorvino | Pencil | 56 | 2.99 | 167.44 | True |
| 2 | 2020-05-05 | Central | Jardine | Pencil | 90 | 4.99 | 449.10 | True |
| 3 | 2020-06-08 | East | Jones | Binder | 60 | 8.99 | 539.40 | True |
| 4 | 2020-08-15 | East | Jones | Pencil | 35 | 4.99 | 174.65 | True |
| 5 | 2020-09-01 | Central | Smith | Desk | 32 | 125.00 | 250.00 | True |
| 6 | 2020-11-08 | East | Mike | Pen | 15 | 19.99 | 299.85 | False |
| 7 | 2020-12-12 | Central | Smith | Pencil | 67 | 1.29 | 86.43 | False |
Another useful argument is usecols, which allows us to select spreadsheet columns with their letters, names, or positional numbers. Let’s see how it works:
df = pd.read_excel('sales_data.xlsx', usecols='A:C,G')
display(df)| OrderDate | Region | Rep | Total | |
|---|---|---|---|---|
| 0 | 2020-01-06 | East | Jones | 189.05 |
| 1 | 2020-02-09 | Central | Jardine | 179.64 |
| 2 | 2020-03-15 | West | Sorvino | 167.44 |
| 3 | 2020-04-01 | East | Jones | 299.40 |
| 4 | 2020-05-05 | Central | Jardine | 449.10 |
| 5 | 2020-06-08 | East | Jones | 539.40 |
| 6 | 2020-07-12 | East | Howard | 57.71 |
| 7 | 2020-08-15 | East | Jones | 174.65 |
| 8 | 2020-09-01 | Central | Smith | 250.00 |
| 9 | 2020-10-05 | Central | Morgan | 251.72 |
| 10 | 2020-11-08 | East | Mike | 299.85 |
| 11 | 2020-12-12 | Central | Smith | 86.43 |
In the code above, the string assigned to the usecols argument contains a range of columns with : plus column G separated by a comma. Also, we’re able to provide a list of column names and assign it to the usecols argument, as follows:
df = pd.read_excel('sales_data.xlsx', usecols=['OrderDate', 'Region', 'Rep', 'Total'])
display(df)| OrderDate | Region | Rep | Total | |
|---|---|---|---|---|
| 0 | 2020-01-06 | East | Jones | 189.05 |
| 1 | 2020-02-09 | Central | Jardine | 179.64 |
| 2 | 2020-03-15 | West | Sorvino | 167.44 |
| 3 | 2020-04-01 | East | Jones | 299.40 |
| 4 | 2020-05-05 | Central | Jardine | 449.10 |
| 5 | 2020-06-08 | East | Jones | 539.40 |
| 6 | 2020-07-12 | East | Howard | 57.71 |
| 7 | 2020-08-15 | East | Jones | 174.65 |
| 8 | 2020-09-01 | Central | Smith | 250.00 |
| 9 | 2020-10-05 | Central | Morgan | 251.72 |
| 10 | 2020-11-08 | East | Mike | 299.85 |
| 11 | 2020-12-12 | Central | Smith | 86.43 |
The usecols argument accepts a list of column numbers, too. The following code shows how we can pick up specific columns using their indices:
df = pd.read_excel('sales_data.xlsx', usecols=[0, 1, 2, 6])
display(df)| OrderDate | Region | Rep | Total | |
|---|---|---|---|---|
| 0 | 2020-01-06 | East | Jones | 189.05 |
| 1 | 2020-02-09 | Central | Jardine | 179.64 |
| 2 | 2020-03-15 | West | Sorvino | 167.44 |
| 3 | 2020-04-01 | East | Jones | 299.40 |
| 4 | 2020-05-05 | Central | Jardine | 449.10 |
| 5 | 2020-06-08 | East | Jones | 539.40 |
| 6 | 2020-07-12 | East | Howard | 57.71 |
| 7 | 2020-08-15 | East | Jones | 174.65 |
| 8 | 2020-09-01 | Central | Smith | 250.00 |
| 9 | 2020-10-05 | Central | Morgan | 251.72 |
| 10 | 2020-11-08 | East | Mike | 299.85 |
| 11 | 2020-12-12 | Central | Smith | 86.43 |
Working with Multiple Spreadsheets
Excel files or workbooks usually contain more than one spreadsheet. The pandas library allows us to load data from a specific sheet or combine multiple spreadsheets into a single DataFrame. In this section, we’ll explore how to use these valuable capabilities.
By default, the read_excel() method reads the first Excel sheet with the index 0. However, we can choose the other sheets by assigning a particular sheet name, sheet index, or even a list of sheet names or indices to the sheet_name argument. Let’s try it:
df = pd.read_excel('sales_data.xlsx', sheet_name='2021')
display(df)| OrderDate | Region | Rep | Item | Units | Unit Cost | Total | Shipped | |
|---|---|---|---|---|---|---|---|---|
| 0 | 2021-01-15 | Central | Gill | Binder | 46 | 8.99 | 413.54 | True |
| 1 | 2021-02-01 | Central | Smith | Binder | 87 | 15.00 | 1305.00 | True |
| 2 | 2021-03-07 | West | Sorvino | Binder | 27 | 19.99 | 139.93 | True |
| 3 | 2021-04-10 | Central | Andrews | Pencil | 66 | 1.99 | 131.34 | False |
| 4 | 2021-05-14 | Central | Gill | Pencil | 53 | 1.29 | 68.37 | False |
| 5 | 2021-06-17 | Central | Tom | Desk | 15 | 125.00 | 625.00 | True |
| 6 | 2021-07-04 | East | Jones | Pen Set | 62 | 4.99 | 309.38 | True |
| 7 | 2021-08-07 | Central | Tom | Pen Set | 42 | 23.95 | 1005.90 | True |
| 8 | 2021-09-10 | Central | Gill | Pencil | 47 | 1.29 | 9.03 | True |
| 9 | 2021-10-14 | West | Thompson | Binder | 57 | 19.99 | 1139.43 | False |
| 10 | 2021-11-17 | Central | Jardine | Binder | 11 | 4.99 | 54.89 | False |
| 11 | 2021-12-04 | Central | Jardine | Binder | 94 | 19.99 | 1879.06 | False |
The code above reads the second spreadsheet in the workbook, whose name is 2021. As mentioned before, we also can assign a sheet position number (zero-indexed) to the sheet_name argument. Let’s see how it works:
df = pd.read_excel('sales_data.xlsx', sheet_name=1)
display(df)| OrderDate | Region | Rep | Item | Units | Unit Cost | Total | Shipped | |
|---|---|---|---|---|---|---|---|---|
| 0 | 2021-01-15 | Central | Gill | Binder | 46 | 8.99 | 413.54 | True |
| 1 | 2021-02-01 | Central | Smith | Binder | 87 | 15.00 | 1305.00 | True |
| 2 | 2021-03-07 | West | Sorvino | Binder | 27 | 19.99 | 139.93 | True |
| 3 | 2021-04-10 | Central | Andrews | Pencil | 66 | 1.99 | 131.34 | False |
| 4 | 2021-05-14 | Central | Gill | Pencil | 53 | 1.29 | 68.37 | False |
| 5 | 2021-06-17 | Central | Tom | Desk | 15 | 125.00 | 625.00 | True |
| 6 | 2021-07-04 | East | Jones | Pen Set | 62 | 4.99 | 309.38 | True |
| 7 | 2021-08-07 | Central | Tom | Pen Set | 42 | 23.95 | 1005.90 | True |
| 8 | 2021-09-10 | Central | Gill | Pencil | 47 | 1.29 | 9.03 | True |
| 9 | 2021-10-14 | West | Thompson | Binder | 57 | 19.99 | 1139.43 | False |
| 10 | 2021-11-17 | Central | Jardine | Binder | 11 | 4.99 | 54.89 | False |
| 11 | 2021-12-04 | Central | Jardine | Binder | 94 | 19.99 | 1879.06 | False |
As you can see, both statements take in either the actual sheet name or sheet index to return the same result.
Sometimes, we want to import all the spreadsheets stored in an Excel file into pandas DataFrames simultaneously. The good news is that the read_excel() method provides this feature for us. In order to do this, we can assign a list of sheet names or their indices to the sheet_name argument. But there is a much easier way to do the same: to assign None to the sheet_name argument. Let’s try it:
all_sheets = pd.read_excel('sales_data.xlsx', sheet_name=None)Before exploring the data stored in the all_sheets variable, let’s check its data type:
type(all_sheets)dictAs you can see, the variable is a dictionary. Now, let’s reveal what is stored in this dictionary:
for key, value in all_sheets.items():
    print(key, type(value))
2020 <class 'pandas.core.frame.DataFrame'>
2021 <class 'pandas.core.frame.DataFrame'>The code above shows that the dictionary’s keys are the Excel workbook sheet names, and its values are pandas DataFrames for each spreadsheet. To print out the content of the dictionary, we can use the following code:
for key, value in all_sheets.items():
    print(key)
display(value)2020| OrderDate | Region | Rep | Item | Units | Unit Cost | Total | Shipped | |
|---|---|---|---|---|---|---|---|---|
| 0 | 2020-01-06 | East | Jones | Pencil | 95 | 1.99 | 189.05 | True |
| 1 | 2020-02-09 | Central | Jardine | Pencil | 36 | 4.99 | 179.64 | True |
| 2 | 2020-03-15 | West | Sorvino | Pencil | 56 | 2.99 | 167.44 | True |
| 3 | 2020-04-01 | East | Jones | Binder | 60 | 4.99 | 299.40 | False |
| 4 | 2020-05-05 | Central | Jardine | Pencil | 90 | 4.99 | 449.10 | True |
| 5 | 2020-06-08 | East | Jones | Binder | 60 | 8.99 | 539.40 | True |
| 6 | 2020-07-12 | East | Howard | Binder | 29 | 1.99 | 57.71 | False |
| 7 | 2020-08-15 | East | Jones | Pencil | 35 | 4.99 | 174.65 | True |
| 8 | 2020-09-01 | Central | Smith | Desk | 32 | 125.00 | 250.00 | True |
| 9 | 2020-10-05 | Central | Morgan | Binder | 28 | 8.99 | 251.72 | True |
| 10 | 2020-11-08 | East | Mike | Pen | 15 | 19.99 | 299.85 | False |
| 11 | 2020-12-12 | Central | Smith | Pencil | 67 | 1.29 | 86.43 | False |
2021| OrderDate | Region | Rep | Item | Units | Unit Cost | Total | Shipped | |
|---|---|---|---|---|---|---|---|---|
| 0 | 2021-01-15 | Central | Gill | Binder | 46 | 8.99 | 413.54 | True |
| 1 | 2021-02-01 | Central | Smith | Binder | 87 | 15.00 | 1305.00 | True |
| 2 | 2021-03-07 | West | Sorvino | Binder | 27 | 19.99 | 139.93 | True |
| 3 | 2021-04-10 | Central | Andrews | Pencil | 66 | 1.99 | 131.34 | False |
| 4 | 2021-05-14 | Central | Gill | Pencil | 53 | 1.29 | 68.37 | False |
| 5 | 2021-06-17 | Central | Tom | Desk | 15 | 125.00 | 625.00 | True |
| 6 | 2021-07-04 | East | Jones | Pen Set | 62 | 4.99 | 309.38 | True |
| 7 | 2021-08-07 | Central | Tom | Pen Set | 42 | 23.95 | 1005.90 | True |
| 8 | 2021-09-10 | Central | Gill | Pencil | 47 | 1.29 | 9.03 | True |
| 9 | 2021-10-14 | West | Thompson | Binder | 57 | 19.99 | 1139.43 | False |
| 10 | 2021-11-17 | Central | Jardine | Binder | 11 | 4.99 | 54.89 | False |
| 11 | 2021-12-04 | Central | Jardine | Binder | 94 | 19.99 | 1879.06 | False |
Combining Multiple Excel Spreadsheets into a Single Pandas DataFrame
Having one DataFrame per sheet allows us to have different columns or content in different sheets.
But what if we prefer to store all the spreadsheets’ data in a single DataFrame? In this tutorial, the workbook spreadsheets have the same columns, so we can combine them with the concat() method of pandas.
If you run the code below, you’ll see that the two DataFrames stored in the dictionary are concatenated:
combined_df = pd.concat(all_sheets.values(), ignore_index=True)
display(combined_df)| OrderDate | Region | Rep | Item | Units | Unit Cost | Total | Shipped | |
|---|---|---|---|---|---|---|---|---|
| 0 | 2020-01-06 | East | Jones | Pencil | 95 | 1.99 | 189.05 | True |
| 1 | 2020-02-09 | Central | Jardine | Pencil | 36 | 4.99 | 179.64 | True |
| 2 | 2020-03-15 | West | Sorvino | Pencil | 56 | 2.99 | 167.44 | True |
| 3 | 2020-04-01 | East | Jones | Binder | 60 | 4.99 | 299.40 | False |
| 4 | 2020-05-05 | Central | Jardine | Pencil | 90 | 4.99 | 449.10 | True |
| 5 | 2020-06-08 | East | Jones | Binder | 60 | 8.99 | 539.40 | True |
| 6 | 2020-07-12 | East | Howard | Binder | 29 | 1.99 | 57.71 | False |
| 7 | 2020-08-15 | East | Jones | Pencil | 35 | 4.99 | 174.65 | True |
| 8 | 2020-09-01 | Central | Smith | Desk | 32 | 125.00 | 250.00 | True |
| 9 | 2020-10-05 | Central | Morgan | Binder | 28 | 8.99 | 251.72 | True |
| 10 | 2020-11-08 | East | Mike | Pen | 15 | 19.99 | 299.85 | False |
| 11 | 2020-12-12 | Central | Smith | Pencil | 67 | 1.29 | 86.43 | False |
| 12 | 2021-01-15 | Central | Gill | Binder | 46 | 8.99 | 413.54 | True |
| 13 | 2021-02-01 | Central | Smith | Binder | 87 | 15.00 | 1305.00 | True |
| 14 | 2021-03-07 | West | Sorvino | Binder | 27 | 19.99 | 139.93 | True |
| 15 | 2021-04-10 | Central | Andrews | Pencil | 66 | 1.99 | 131.34 | False |
| 16 | 2021-05-14 | Central | Gill | Pencil | 53 | 1.29 | 68.37 | False |
| 17 | 2021-06-17 | Central | Tom | Desk | 15 | 125.00 | 625.00 | True |
| 18 | 2021-07-04 | East | Jones | Pen Set | 62 | 4.99 | 309.38 | True |
| 19 | 2021-08-07 | Central | Tom | Pen Set | 42 | 23.95 | 1005.90 | True |
| 20 | 2021-09-10 | Central | Gill | Pencil | 47 | 1.29 | 9.03 | True |
| 21 | 2021-10-14 | West | Thompson | Binder | 57 | 19.99 | 1139.43 | False |
| 22 | 2021-11-17 | Central | Jardine | Binder | 11 | 4.99 | 54.89 | False |
| 23 | 2021-12-04 | Central | Jardine | Binder | 94 | 19.99 | 1879.06 | False |
Now the data stored in the combined_df DataFrame is ready for further processing or visualization. In the following piece of code, we’re going to create a simple bar chart that shows the total sales amount made by each representative. Let’s run it and see the output plot:
total_sales_amount = combined_df.groupby('Rep').Total.sum()
total_sales_amount.plot.bar(figsize=(10, 6))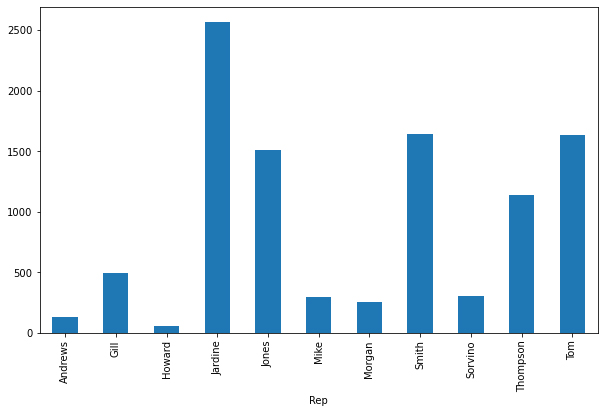
Reading Excel Files Using xlrd
Although importing data into a pandas DataFrame is much more common, another helpful package for reading Excel files in Python is xlrd. In this section, we’re going to scratch the surface of how to read Excel spreadsheets using this package.
NOTE
The xlrd package doesn’t support xlsx files due to a potential security vulnerability. So, we use the xls version of the sales data. You can download the xls version from the link below:
Sales Data Excel Workbook — xls ver.
Let’s see how it works:
import xlrd
excel_workbook = xlrd.open_workbook('sales_data.xls')
Above, the first line imports the xlrd package, then the open_workbook method reads the sales_data.xls file.
We can also open an individual sheet containing the actual data. There are two ways to do so: opening a sheet by index or by name. Let’s open the first sheet by index and the second one by name:
excel_worksheet_2020 = excel_workbook.sheet_by_index(0)
excel_worksheet_2021 = excel_workbook.sheet_by_name('2021')
Now, let’s see how we can print a cell value. The xlrd package provides a method called cell_value() that takes in two arguments: the cell’s row index and column index. Let’s explore it:
print(excel_worksheet_2020.cell_value(1, 3))PencilWe can see that the cell_value function returned the value of the cell at row index 1 (the 2nd row) and column index 3 (the 4th column).
The xlrd package provides two helpful properties: nrows and ncols, returning the number of nonempty spreadsheet’s rows and columns respectively:
print('Columns#:', excel_worksheet_2020.ncols)
print('Rows#:', excel_worksheet_2020.nrows)
Columns#: 8
Rows#: 13Knowing the number of nonempty rows and columns in a spreadsheet helps us with iterating over the data using nested for loops. This makes all the Excel sheet data accessible via the cell_value() method.
Conclusion
This tutorial discussed how to load Excel spreadsheets into pandas DataFrames, work with multiple Excel sheets, and combine them into a single pandas DataFrame. We also explored the main aspects of the xlrd package as one of the simplest tools for accessing the Excel spreadsheets data.
.xlsx – это расширение документа Excel, который может хранить большой объем данных в табличной форме. Более того, в электронной таблице Excel можно легко выполнять многие виды арифметических и логических вычислений.
Иногда программистам требуется прочитать данные из документа Excel. В Python для этого есть множество различных библиотек, например, xlrd, openpyxl и pandas. Сегодня мы поговорим о том, как читать excel-файлы (xlsx) при помощи Python, и рассмотрим примеры использования различных библиотек для этих целей.
Для начала
Для проверки примеров этого руководства потребуется какой-нибудь файл Excel с расширением .xlsx, содержащий какие-либо исходные данные. Вы можете использовать любой существующий файл Excel или создать новый. Мы создадим новый файл с именем sales.xlsx со следующими данными:
sales.xlsx
| Sales Date | Sales Person | Amount |
|---|---|---|
| 12/05/18 | Sila Ahmed | 60000 |
| 06/12/19 | Mir Hossain | 50000 |
| 09/08/20 | Sarmin Jahan | 45000 |
| 07/04/21 | Mahmudul Hasan | 30000 |
Этот файл мы и будем читать с помощью различных библиотек Python в следующей части этого руководства.
Чтение Excel-файла с помощью xlrd
Библиотека xlrd не устанавливается вместе с Python по умолчанию, так что ее придется установить. Последняя версия этой библиотеки, к сожалению, не поддерживает Excel-файлы с расширением .xlsx. Поэтому устанавливаем версию 1.2.0. Выполните следующую команду в терминале:
pip install xlrd == 1.2.0
После завершения процесса установки создайте Python-файл, в котором мы будем писать скрипт для чтения файла sales.xlsx с помощью модуля xlrd.
Воспользуемся функцией open_workbook() для открытия файла xlsx для чтения. Этот файл Excel содержит только одну таблицу. Поэтому функция workbook.sheet_by_index() используется в скрипте со значением аргумента 0.
Затем используем вложенный цикл for. С его помощью мы будем перемещаться по ячейкам, перебирая строки и столбцы. Также в скрипте используются две функции range() для определения количества строк и столбцов в таблице.
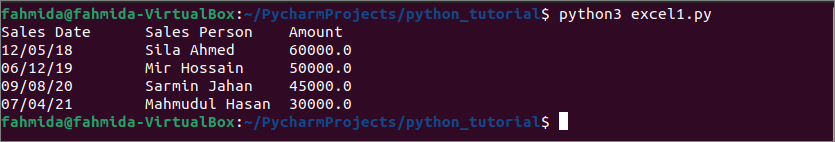
Для чтения значения отдельной ячейки таблицы на каждой итерации цикла воспользуемся функцией cell_value() . Каждое поле в выводе будет разделено одним пробелом табуляции.
import xlrd

# Open the Workbook
workbook = xlrd.open_workbook("sales.xlsx")

# Open the worksheet
worksheet = workbook.sheet_by_index(0)

# Iterate the rows and columns
for i in range(0, 5):
    for j in range(0, 3):
        # Print the cell values with tab space
        print(worksheet.cell_value(i, j), end='t')
    print('')
Запустим наш код и получим следующий результат.
Чтение Excel-файла с помощью openpyxl
Openpyxl – это еще одна библиотека Python для чтения файла .xlsx, и она также не идет по умолчанию вместе со стандартным пакетом Python. Чтобы установить этот модуль, выполните в терминале следующую команду:
pip install openpyxl
После завершения процесса установки можно начинать писать код для чтения файла sales.xlsx.
Как и модуль xlrd, модуль openpyxl имеет функцию load_workbook() для открытия excel-файла для чтения. В качестве значения аргумента этой функции используется файл sales.xlsx.
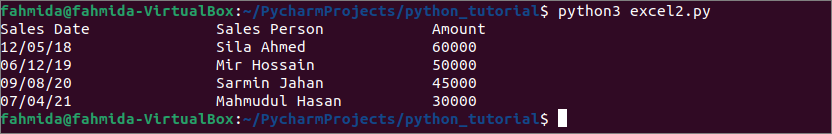
Объект wookbook.active служит для чтения значений свойств max_row и max_column. Эти свойства используются во вложенных циклах for для чтения содержимого файла sales.xlsx.
Функцию range() используем для чтения строк таблицы, а функцию iter_cols() — для чтения столбцов. Каждое поле в выводе будет разделено двумя пробелами табуляции.
import openpyxl

# Define variable to load the wookbook
wookbook = openpyxl.load_workbook("sales.xlsx")

# Define variable to read the active sheet:
worksheet = wookbook.active

# Iterate the loop to read the cell values
for i in range(0, worksheet.max_row):
    for col in worksheet.iter_cols(1, worksheet.max_column):
        print(col[i].value, end="tt")
    print('')
Запустив наш скрипт, получим следующий вывод.
Чтение Excel-файла с помощью pandas
Если вы не пользовались библиотекой pandas ранее, вам необходимо ее установить. Как и остальные рассматриваемые библиотеки, она не поставляется вместе с Python. Выполните следующую команду, чтобы установить pandas из терминала.
pip install pandas
После завершения процесса установки создаем файл Python и начинаем писать следующий скрипт для чтения файла sales.xlsx.
В библиотеке pandas есть функция read_excel(), которую можно использовать для чтения .xlsx-файлов. Ею мы и воспользуемся в нашем скрипте для чтения файла sales.xlsx.
Функция DataFrame() используется для чтения содержимого нашего файла и преобразования имеющейся там информации во фрейм данных. После мы сохраняем наш фрейм в переменной с именем data. А дальше выводим то, что лежит в data, в консоль.
import pandas as pd

# Load the xlsx file
excel_data = pd.read_excel('sales.xlsx')
# Read the values of the file in the dataframe
data = pd.DataFrame(excel_data, columns=['Sales Date', 'Sales Person', 'Amount'])
# Print the content
print("The content of the file is:n", data)
После запуска кода мы получим следующий вывод.
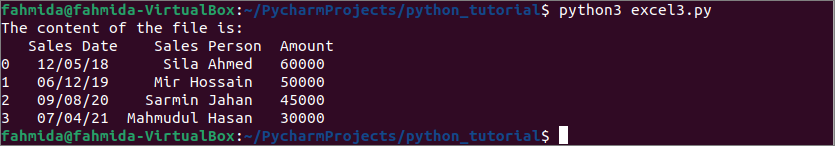
Результат работы этого скрипта отличается от двух предыдущих примеров. В первом столбце печатаются номера строк, начиная с нуля. Значения даты выравниваются по центру. Имена продавцов выровнены по правому краю, а сумма — по левому.
Заключение
Программистам довольно часто приходится работать с файлами .xlsx. Сегодня мы рассмотрели, как читать excel-файлы при помощи Python. Мы разобрали три различных способа с использованием трех библиотек. Все эти библиотеки имеют разные функции и свойства.
Надеемся, теперь у вас не возникнет сложностей с чтением этих файлов в ваших скриптах.