
И сервис машинного обучения станет лучше. Для каждой диаграммы вы можете указать, полезна она или нет. Присылайте отзывы о том, какие диаграммы вам нравятся, а какие нет. Со временем и с ответами миллионов людей алгоритм машинного обучения станет умнее.
Конечно, здесь есть некоторые проблемы с конфиденциальностью. Прочтите о том, что происходит, перейдя в «Файл», «Параметры», «Общие» и прочитав ссылки в разделе «Интеллектуальные службы Office». Вы должны решить, довольны ли вы происходящим. Что касается меня, я сомневаюсь, что у них действительно есть время заботиться о том, сколько пакетов корма для собак я покупаю каждый месяц.
На данный момент Insights будет искать сводный анализ сводных данных, ранга, равномерности, тенденции, составного сигнала, атрибуции, выдающихся двух первых позиций, монотонности (всегда увеличивается или всегда уменьшается), Unimodality (с одной точкой пика данных) и рекомендаций по диаграммам. для небольших наборов данных.
Полагаю, мне хотелось бы, чтобы у меня было это еще в 1989 году, когда я пытался найти что-нибудь интересное, чтобы сказать в заголовке каждого отчета.
В этом видео я продемонстрировал некоторые возможности Insights:
Стенограмма видео
Изучите Excel из подкаста, эпизод 2185: первый взгляд на Insights for Excel.
Привет, просто небольшое примечание по программе: с 14 февраля по 31 марта у меня 40 дней написания новых статей в Excel. Все они будут на сайте.com в папке советов Excel. У большинства не будет видео. Это день номер 6 из 40 и первое видео, которое мы увидели. Так что проверьте это на сайте. Скоро Excel 2019; Мне нужно написать много книг, мне нужно вернуть привычку писать.
Хорошо, это первый взгляд на потрясающую новую функцию, которая только что появилась в моей копии Office 365. А теперь я инсайдер офиса, так что это у меня есть раньше большинства людей. Даже если вы являетесь инсайдером офиса, если вы не связаны с организацией, у вас ее еще нет. Но он скоро появится, и он обязательно появится в Excel 2019, который выйдет во второй половине этого года. Хорошо?
Итак, у нас есть некоторые наборы данных. Это набор данных, который я не создавал; Я понятия не имею, что находится в этом наборе данных, я никогда раньше не смотрел на этот набор данных. 4500 рядов. Итак, я собираюсь выбрать данные, я перейду к Insights — это предварительный просмотр Insight, так что, знаете, будьте осторожны, когда они действительно станут общедоступными, они будут выглядеть иначе, наверное, чем сейчас. Но это круто. Хорошо. Итак, Excel, используя своего рода искусственный интеллект, просмотрел мои данные и нашел кое-что интересное. Например, вот «Расходы по финансовым месяцам», «Расходы по категориям». Расходы со временем снижаются для специалистов по маркетингу и категориям, «Заработная плата» имеет заметно более высокие расходы — ну, это нормально. Хорошо, это, наверное, не так уж и интересно,это, вероятно, соответствует большинству вещей. А потом вы видите, что здесь всего 26 результатов, хорошо? Так что вы можете просмотреть их и посмотреть, не выглядит ли что-нибудь интересным. Вы можете дать им обратную связь: это полезно? Да нет? Как и в случае с платежной ведомостью, для меня это очевидно; так это полезно? Нет. И я полагаю, что это поможет им в их алгоритмах в будущем.
Хорошо, а теперь давайте посмотрим, что здесь происходит, если мы найдем что-нибудь интересное. Так что просто идите в правую сторону. Вы знаете, эти диаграммы на самом деле эскизы, верно? Вы не можете увидеть эти месяцы или что-то в этом роде. Скажем, Вставить диаграмму. Хорошо. Посмотрите, они на самом деле создали для меня небольшую сводную диаграмму и добавили ее в набор данных. Вау, это довольно круто. Мог ли я создать эту диаграмму? Безусловно, я мог бы создать эту диаграмму, но, знаете ли, если это не мои данные, и я не знаю, чего ожидать, это отличная, отличная функция.
Итак, это было 4500 строк; здесь 13 строк — 12 строк и заголовок, Посетители и Цель. Давайте посмотрим, что дает Insights для этого набора данных. Хорошо. Так что они показывают мне Цели и Посетителей по месяцам — Посетителей по месяцам — вы знаете, это некоторые базовые диаграммы, но, знаете, если вы не знаете, с чего начать, это прекрасно.
Хорошо, теперь эти два примера, это демонстрационные наборы данных Microsoft, верно? И, конечно, вы знаете, я первым делом возьму свое. И они ответили, и они сказали: «Эй, почему Сектор классифицируется как свидание, и почему Клиент классифицируется как свидание?» Я как. «Что?» Я не знал этого и думаю, когда я это создавал, сначала поместил даты, затем я вставил столбец, вставил столбец и добавил Сектор и Клиент, и поэтому они были классифицированы как даты. Я не понимал, что были даты — их неправильно классифицировали в течение 10 лет — я предполагаю, когда я это создал. Итак, я собираюсь выбрать весь этот набор данных и снова изменить его на общий. Хорошо? Если вы скажете, что это свидание и на нем есть текст, это запутает Insights.
Хорошо? Итак, вот данные: 563 строки, охватывающие даты за 2 года. Я знаю эти данные довольно хорошо — это фальшивые данные, и будет интересно посмотреть, смогут ли они найти какие-либо идеи в фальшивых данных. Итак, я выбираю Insights Alright, показывая прибыль по дате; Прибыль по секторам; Доход по секторам, да, да; покажем все; Количество по регионам и продуктам; вот дата, которая приносит наибольший доход в конкретном секторе; для розничного покупателя Walmart составляет большую часть количества — это абсолютно правильно, я знаю, что Walmart является крупнейшим покупателем в этих данных. Хорошо? Так что, мальчик, тут пригодится. Это полезно? Да да это. Это очень приятно. Для продукта: ABC и сектора: производство, заказчик: General Motors и General Electric имеют заметно больший доход. Это круто.Это все — потому что я использовал этот набор данных каждый день на своих семинарах по Excel и сотни раз в подкастах, я знаю, что это правда, верно? Я знаю эти данные, и этот искусственный интеллект выявляет эти тенденции. Это круто. Не могу дождаться выхода финальной версии.
Хорошо, теперь обычно именно здесь я говорю вам, что то, о чем мы говорим, есть в этой книге, но этого нет в этой книге, потому что она вышла только на этой неделе. Но много других замечательных вещей в этой книге Power Excel с. Щелкните «I» в правом верхнем углу, чтобы просмотреть дополнительную информацию.
Хорошо, итоги Insights: новая функция искусственного интеллекта, которая появится в Excel 2019 и Office 365; медленно развертывается сейчас в превью; выберите свои данные, перейдите в Insights — хорошо, вкладку Insert и выберите Insights; они анализируют ваши данные, пытаясь найти в них тенденции или интересные вещи; и если вы согласны с тем, что это интересно, вы можете добавить диаграмму, которая фактически создает для вас сводную таблицу. Действительно, действительно здорово. Обязательно обратите внимание на типы данных, даже если вы не понимаете, что типы данных там есть. И, конечно же, к тому времени, когда это станет популярным — так что я записываю это в феврале 2018 года — к тому времени, когда он дойдет до вас, он может выглядеть иначе.
Что ж, эй, я хочу поблагодарить вас за то, что заглянули, увидимся в следующий раз для еще одной сетевой трансляции от.
Статьи вторника готовятся к новым функциям в Excel 2019.
Идея дня в Excel
Я попросил совета у моих друзей-мастеров Excel по поводу Excel. Сегодняшняя мысль задуматься:
«Чтобы стать великим, нужно превосходить»
Ариф Али
Posted on: 03/05/2018
Insights in Excel – Game Changer for Data Analysis
What if I told you in Excel 2016 for Office 365, you can click on one cell and with two more clicks, have data analysis you would never dream of having? It’s here! Microsoft has updated Excel 2016 for Office 365 with Insights for Excel. Insight is discussed in the December 13, 2017, blog post from Microsoft. I’ve been waiting to get this since then and I received the update on Saturday, March 3, 2018. I spent two days testing Insights. It is incredible!
Insights relies on machine learning to help seek out patterns. In my test, it identified outliers, and quickly gave me other useful visualizations. It even took some of my data and automatically created a PivotTable and PivotChart. I simply clicked on Insights.
Steps to see Insights in Excel:
- Simply click a cell in a data range
- Click the Insights button on the Insert tab.
- Insight Services will analyze your data and return interesting visuals about it in a task pane on the right-hand side of your screen.
Menard tip: Make your data range a table first using CTRL + T. My free course on Ten reasons to use Tables in Excel.
Video On using Insights in Excel
The video above shows three test in Excel and one error message during the testing.
Photo Gallery of Screenshots
Below are 5 screenshots. The 1st image shows what Version and Build of Excel 2016 I have. I’m using Version 1803 (Build 9127.2004) on an Office 365 subscription. If you have a stand-alone (perpetual) version of Office 2016, you will unfortunately not have Insights and there are no plans for perpetual users to have Insights with Office 2016 as a stand-alone. I’m not sure if Office 2019, purchased with a perpetual license, will have Insights. Office 2019 is coming out H2 of this year.
To use Insights you need the following:
- Internet Connection
- Enough Data for Insights to Work. If you click Insights, you may get this message “We couldn’t find any significant patterns in your data to show as an Insight. Try using a larger dataset with more variation in it.” See the photo gallery above. From my three test, this is due to not enough columns. I had plenty of records. In fact, in the Video below you can see I had 576 records. I had to add some column data.

Chris Menard
Chris Menard is a Microsoft Certified Trainer (MCT) and is employed full-time as a Trainer for BakerHostetler, one of the nation’s largest law firms. Menard has a YouTube channel with over 900 technology videos covering Excel, Word, Zoom, Teams, Outlook, Gmail, Google Calendar, and other resources that over 15 million viewers have appreciated. Menard also does public speaking at conferences for CPAs and Administrative Professionals. Connect with Chris on LinkedIn at chrismenardtraining.com/linked or on YouTube at chrismenardtraining.com/youtube
Categories
-
Blog
»
Microsoft
»
Microsoft Excel
»
Advanced
В последнем релизе Office 365 от 20 декабря, для участников программы Office Insider, в табличный процессор Excel Microsoft добавила возможность быстрой подборки различных вариантов визуализаций (Insights). Функция работает на основе технологии машинного обучения и что-то подобное мы можем наблюдать в PowerPoint при добавлении рисунков на слайд, когда программа автоматически подбирает различные идеи для оформления (функция “дизайнер”) будущего слайда.

Для того, чтобы воспользоваться автоматическими идеями достаточно перейти на вкладку “Вставка” (Insert) и выбрать команду “Insights”. Пользователям, знакомым с основами построения диаграмм в Excel, данная функция напомнит “Рекомендуемые диаграммы”, в принципе, так оно и есть, отличие в технологиях, которые подбирают стартовые диаграммы для данных и, соответственно, результаты могут разнится. В любом случае ни первая ни вторая функция не заменит умения тонкой настройки диаграммы в Excel (а значит и Word, и PowerPoint, ведь и там и там диаграммы строится в Excel, а потом внедряется в документ, либо презентацию).

На данный момент функция подбора диаграмм для данных доступна в сборке 1801 (Build 8911.2016) участникам программы Office Insider. Посмотреть номер своей текущей сборки, а также проверить наличие обновления можно в меню “Файл”/ Учетная запись.

Источник: Microsoft
Insights is a new feature coming to Excel and Office 365. Office Insiders can take the new artificial-intelligence feature for a spin soon.
I remember working as a data analyst in Akron. After pulling data from the mainframe, creating a pivot table, formatting the page, I would always try to find a good sentence or two to use as a headline. I new that my manager’s manager would spend 10 seconds with the report, and I wanted the headline to provide a sound-byte that he could take away from the report. An preview of an amazing new Artificial-Intelligence feature from Microsoft called Excel Insights is starting to roll out to Office Insiders. I’ve tried it, and I like it.
Insights will appear on your Insert tab, to the left of Charts.
Insights works with a table of data. Microsoft says it is better if you format with Ctrl + T, but I find it works with regular tabular data as well. Headings in row 1. No blank rows. No blank columns. No nested subdata within the data. No merged cells. Up to 250,000 cells for now. Choose one cell in the data and click Insights.
A new panel appears on the right with four charts. The first four charts are fairly generic. In fact, they look like the first four from the Excel 2013 Recommended Pivot Tables.
But there are 26 charts. Scroll down and you will start to see some detailed trends in the charts. Personally, I think they should have lead with these charts and saved the ho-hum charts for the end.
Now, the charts are too small to have labels. When you see one that you like, click Insert Chart. Excel will insert a new sheet, build a pivot table, build a pivot chart, and you can see all of the details.
And, the machine-learning service is going to get better. For each chart, you can indicate if the chart is helpful or not. Send feedback of which charts you like and which are ho-hum. Over time, and with responses from millions of people, the machine-learning algorithm will get smarter.
Of course, there are some privacy issues here. Read about what is going on by going to File, Options, General and reading the links under Office Intelligent Services. You have to decide if you are comfortable with what’s happening. For me, I doubt that they really have the time to care how many bags of dog food I buy each month.
For now, Insights will be looking for Summary Analyses of Pivotable data, Rank, Evenness, Trend, Composite Signal, Attribution, Outstanding Top Two, Monotonicity (always increasing or always decreasing), Unimodality (having a single peak data point) and Chart Recommendations for smaller data sets.
I suppose I wish that I would have had this back in 1989 when I was trying to find something interesting to say as the headline for each report.
Learn Excel from MrExcel Podcast, Episode
2185: A First Look at Insights for Excel.
Hey, just a quick program note: February 14th
through March 31st, I’m running 40 days of brand new Excel articles. All of
those will be at MrExcel.com, in the Excel tips folder. Most won’t have a
video. This is day number 6 out of 40, and the first video that we’ve come to.
So check it out at the website. Excel 2019 is coming; I need to write a lot of
books, I need to get back in the habit of writing.
Alright, so, this is a first look at an
awesome, new feature that just lit up in my copy of Office 365. And, now, I’m
an office insider, so I have this before most people. Even if you’re an office
insider, if you’re not associated with the organization, you don’t have it yet.
But it’s coming, and it’ll definitely be there for Excel 2019, which comes out
in the second half of this year. Alright?
So we have some data sets here. This is a data
set that I did not create; I have no idea what’s in this data set, I’ve never
looked at this data set before. 4500 rows. So I’m going to select the data, I’m
going to come here to Insights— and this is a preview of Insight so, you know,
be careful, when this actually comes out to general availability it’s going to
look different, probably, than we have now. But it’s cool. Alright. So, Excel,
using some sort of artificial intelligence, has looked at my data and found
some interesting things. Like, here’s the «Spend by Fiscal Month»,
«Spend by Category», Spend decreases over time for marketing and
category people, Payroll has a noticeably higher spending— well, that’s normal.
Alright, so that’s, you know, probably not that exciting, that probably matches
most things. And then you see that there’s a total of 26 results here, alright?
So you can scroll through these and see if anything looks interesting. You can
provide feedback to them: Is this helpful? Yes, No? Like the payroll one,
that’s kind of obvious to me; so is this helpful? No. And I suppose that will
help them with their algorithms in the future.
Alright, now, let’s take a look at what
happens here if we find something interesting. So just go off to the right hand
side. You know, these charts are really thumbnails, right? You can’t see that
months or anything like that. So let’s say Insert Chart. Alright. Look at that,
they actually created a little pivot chart for me and added it to the data set.
Wow, that is pretty cool. Could I have created this chart? Absolutely, I could
have created this chart, but, you know, if it’s not my data and I don’t know
what to expect, this is a great, great feature.
Now, that was 4,500 rows; here’s 13 rows— 12
rows and a header, Visitors and Goal. Let’s see what Insights comes up with for
this data set. Alright. So they show me Goal and Visitors by month— Visitors
by month— you know, these are some basic charts but, you know, if you don’t
know where to start, this is beautiful.
Alright, now, these two examples, these are
Microsoft demo data sets, right? And, of course, you know, my my first take is
to take my data— the data that I use all the time in my live Power Excel
seminars— and throw that at Insights. And a troubleshooting thing, or a thing
that I didn’t even notice until I asked the team of Microsoft, it’s like,
«Well, hey, why isn’t it working with my data?» And they wrote back
and they said, «Hey, why is Sector classified as a date, and why is
Customer classified as a date?» I’m like. «What?» I didn’t know
this and I guess when I created this, put the dates in first then I inserted a
column, inserted a column, and added Sector and Customer and so they got
classified as dates. I didn’t realize there were dates— they’ve been
misclassified for 10 years— I’m guessing when I created this. So, I’m going to
select that whole data set and change it back to general. Alright? If you say
it’s a date, and it has text, that’s going to confuse Insights.
Alright? So here’s the data: 563 rows, covers
2 years worth of dates. I know this data pretty well— it’s fake data, and
that’ll be interesting to see if they can find any insights in fake data. So,
I’ll choose Insights Alright, showing Profit by Date; Profit by Sector; Revenue
by Sector, yeah, yeah; let’s Show All; Quantity by Region and Product; here’s a
date that has the largest revenue for a particular Sector; for a retail
Customer, Walmart accounts for the majority of quantity— that’s absolutely
correct, I know that Walmart is the largest customer in this data. Alright? So,
boy, that one’s useful right there. Is that helpful? Yes, yes it is. It’s very
nice. For Product: ABC and Sector: Manufacturing, Customer: General Motors and
General Electric have noticeably more revenue. This is cool stuff. This is
stuff— because I used this data set every day in my live Excel seminars, and
hundreds of times in the podcast, I know these things to be true, right? I know
this data, and this artificial intelligence is coming up with these trends.
It’s cool. I can’t wait for the final version to come out.
Alright, now, normally this is the point where
I tell you that what we’re talking about is in this book, but it’s not in this
book because it just came out this week. But a lot of other great things in
this book, Power Excel with MrExcel. Click that «I» in the top
right-hand corner to take a look at more information.
Alright, so Insights: New artificial
Intelligence feature coming in Excel 2019 and to Office 365; slowly rolling out
now in preview; select your data, go to Insights— alright, the Insert tab and
choose Insights; they analyze your data in an attempt to find trends or
interesting things in your data; and if you agree it’s interesting, you can add
a chart that actually creates a pivot table for you. Really, really cool. Be
sure to pay attention to data types, even if you don’t realize that data types
are there. And, of course, by the time this hits generally— so I’m recording
this February of 2018— by the time it gets to you, it might look different.
Well, hey, I want to thank you for stopping
by, I’ll see you next time for another netcast from MrExcel.
Tuesday’s articles are getting ready for the new features in Excel 2019.

on
June 12, 2018, 8:01 AM PDT
How to apply Insights in Excel and what to look out for when you do
Excel’s Insights feature uses AI and machine learning to indicate patterns in data that can help your decision making, but there are several caveats to consider along the way.
Microsoft is gradually rolling out a new feature for Office 365 subscribers called Insights in Excel. This new tool has been in preview for participants in the Office Insiders program for a few months but has now been released to everyone. The tool promises to apply the power of cloud-based artificial intelligence and machine learning to your Excel data sets to reveal new patterns and hidden information that you may have overlooked.
Once Insights is installed, accessing it is as simple as clicking a specific button on the Office Ribbon. However, getting the tool to actually provide useful information is a bit more problematic. Insights demonstrates both the promise of artificial intelligence and the elusiveness of its effective practical application.
This brief tutorial article shows you how to implement Insights and explains some of the difficulties you may encounter when trying to apply artificial intelligence to real-world data sets.
SEE: Artificial intelligence: Trends, obstacles, and potential wins (Tech Pro Research)
Excel Insights
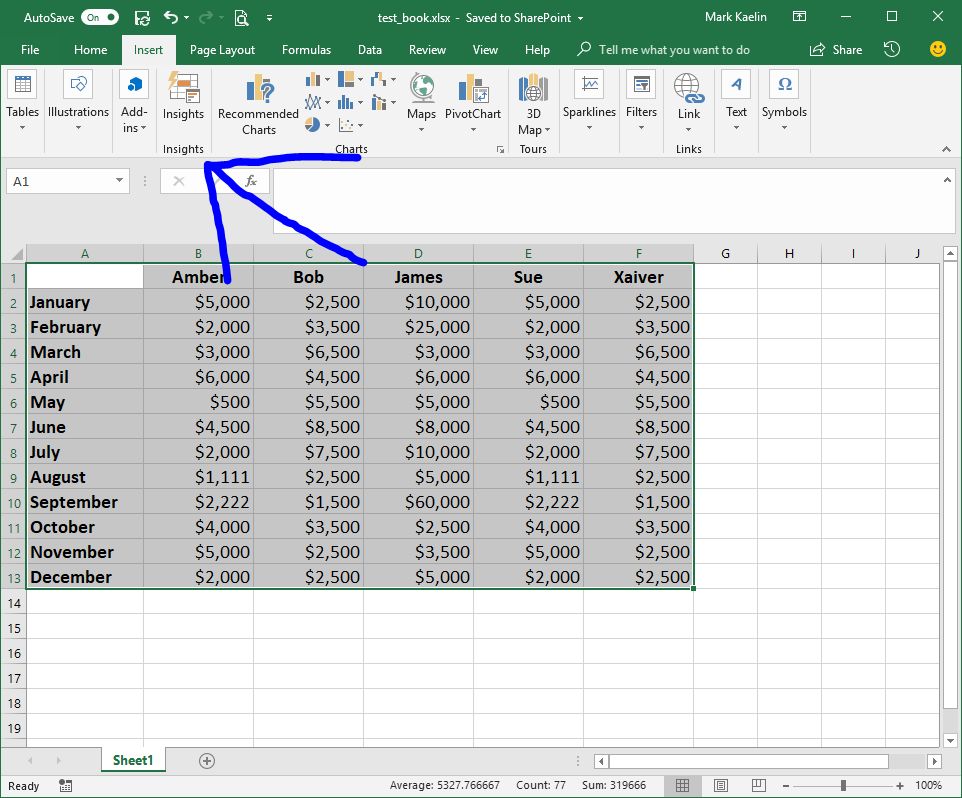
To apply Insights, highlight your data set in Excel (give it a label if you prefer) and then navigate to the Insert tab on your Office Ribbon. Click the Insights button, which is defaulted to lie in the middle of the Ribbon (Figure A).
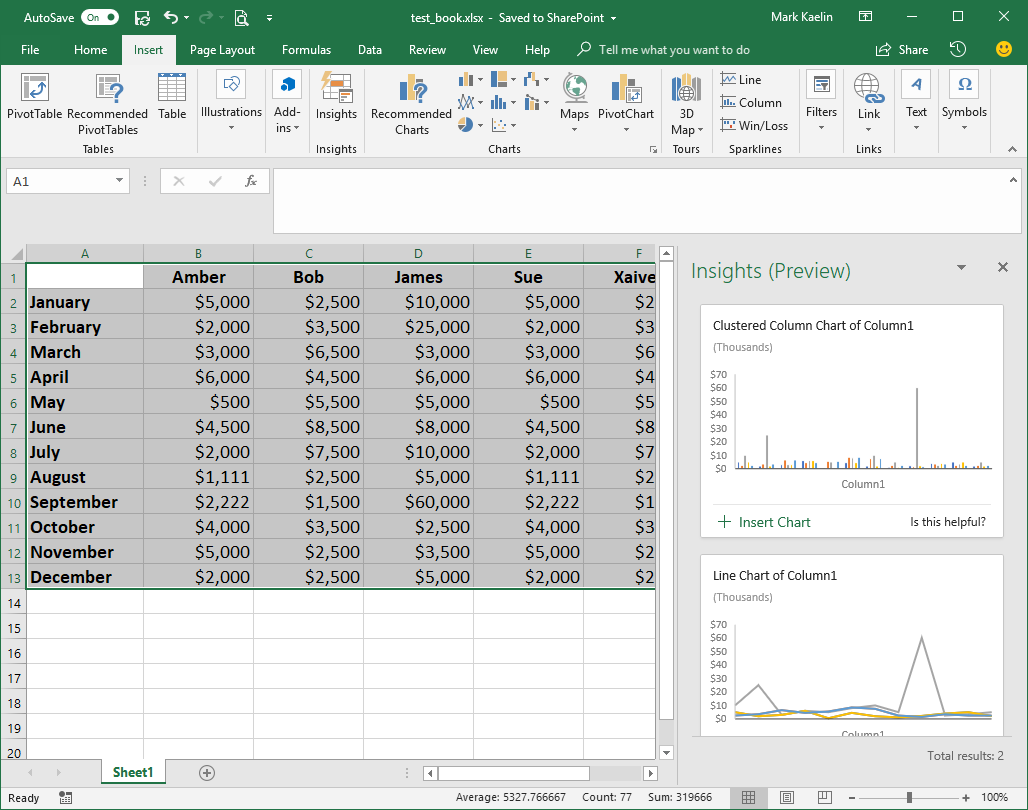
When you click the Insights button, Excel will take a moment to analyze the data set and then present you with several graphical choices (Figure B). The quality and quantity of those choices will depend on the data being analyzed, of course. In our simple example, the choices are fairly basic and not really all that enlightening.
Assuming you find a graph that meets your needs, you can click the Insert Chart link and the chart will be inserted into your workbook already formatted in presentable, albeit rudimentary, form (Figure C).

Caveats, warnings, and admonitions
It is important to realize that Insights works best with clean, well-organized data that is free of nesting and blank rows and columns. Equally important, this tool cannot be used on data that has been converted into a Pivot table. However, according to Microsoft, Insights will work best with data that has been formatted as an Excel Table (Figure D).

To format a data set as an Excel Table, highlight the data and use the CTRL-T keyboard shortcut. Although, in our example, converting to the table format offered no additional chart choices or hidden pattern revelations, it may be more effective on a more complicated table.
And therein lies the problem with Insights and any other tool designed to use AI or machine learning–they don’t always work. Proponents of these new technologies tend to overstate the true capabilities of AI and machine learning. I tried Insights on several sets of real Excel data and the tool could not even produce one chart.
SEE: How to use Excel’s what-if tools to analyze business scenarios (free PDF) (TechRepublic)
Let’s take a look at our sample data set. Obviously, James is associated with several huge spikes in activity and the charts do reveal it, but did we really need Insights to see it? And, of course, the tool can do nothing to explain why the activity spiked. The reasons will have to be explored by a person, AI cannot help us in that regard.
The limited overall capability to what any AI tool can do in a practical setting is important to keep in mind as they become more prevalent and the hype surrounding them becomes louder. While AI may be able to provide a clue toward a pattern or a solution, comprehending the meaning and the significance of that pattern is still going to be the responsibility of a human being for a long time to come.
Also read:
- Microsoft 365: A cheat sheet (TechRepublic)
- Artificial ignorance: The 10 biggest AI failures of 2017 (TechRepublic)
- Microsoft contemplates the ethical and societal impact of artificial intelligence in new book (TechRepublic)
- Elevate your Excel skills to pro level with this Microsoft-approved training (TechRepublic)
- Microsoft’s AI journey beyond Office (ZDNet)
- Microsoft adds more AI-powered updates to Bing, Cortana, Office 365 (ZDNet)
Your thoughts:
Are you using AI for data analysis? How effective is it? Share your thoughts and opinions with your peers at TechRepublic in the discussion thread below.

-
Artificial Intelligence
-
Microsoft
-
Software