
An income statement or profit and loss statement is an essential financial statement where the key value reported is known as Net Income. The statement summarizes a company’s revenues and business expenses to provide the big picture of the financial performance of a company over time. The income statement is typically used in combination with a balance sheet statement.
Advertisement
There are many ways to format an income statement. The two examples provided in the template are meant mainly for small service-oriented businesses or retail companies. (1) The simplified «single-step» income statement groups all of the revenues and expenses, except the income tax expense. (2) The «multi-step» income statement example breaks out the Gross Profit and Operating Income as separate lines. It first calculates the Gross Profit by subtracting Cost of Goods Sold from Net Sales. It calculates the Operating Income and then adjusts for interest expense and income tax to give the Income from Continuing Operations.
If all of those terms are making you queasy, read below the download block for more information.

Description
This income statement template was designed for the small-business owner and contains two example income statements, each on a separate worksheet tab (see the screenshots). The first is a simple single-step income statement with all revenues and expenses lumped together.
The second worksheet, shown on the right, is a multi-step income statement that calculates Gross Profit and Operating Income.
Income Statement Essentials
Net Income = Total Revenue — Total Expenses
Revenues
The income that is generated by providing a service, selling a product, earning interest on investments, renting extra office space, licensing technologies, selling advertising space, or licensing the use of your brand name. In the income statement template, there are categories for Sales revenue, Service revenue, Interest revenue, and Other revenue. You will likely want to customize the Revenue section to highlight your company’s main sources of revenue.
Cost of Goods Sold (COGS)
For a retail company, one of the main expenses is the cost of goods sold. So, you’ll see Cost of Goods Sold broken out into its own section, with Gross Profit calculated as the Net Sales minus Cost of Goods Sold. Use the MultiStep worksheet in this case.
The cost of goods sold can be calculated by adding beginning inventory, goods purchased, raw materials and direct labor for goods manufactured, and then subtracting the ending inventory.
For service businesses, COGS might not be such a large factor, so that is why the SingleStep worksheet doesn’t have a separate COGS section.
Operating Expenses
This section is where you include all your operating expenses such as advertising, salaries, rent, utilities, insurance, legal fees, accounting fees, supplies, research and development costs, maintenance, etc. Don’t include interest expense and income taxes (they will be included later).
Operating Income (EBIT)
In the multi-step income statement, the operating income is calculated as the Gross Profit minus the total Operating Expenses. In general, interest expense and income tax expense are not included as operating expenses, which gives rise to the term EBIT or «earnings before interest and taxes» — another name for Operating Income.
Income from Continuing Operations
This is the «bottom line», calculated as the Operating Income minus interest expense and income tax (and plus/minus non-operating revenues, expenses, gains, and losses, if there are any). If there are no «below-the-line» items, then this is the same as the Net Income.
Below-the-line Items
Some forms of income, such as the sale of a building you are no longer going to be using, are included «below-the-line» (i.e. below the reported Net Income from Continuing Operations) because they may not be expected to occur in the future. These include the effect of accounting changes, income from discontinued operations, and extraordinary items (gaines or losses that are unusual or highly abnormal).
Income Statement References:
- Financial Accounting: Reporting and Analysis by M.A. Diamond, E. K. Slice, and J.D. Slice., 2000.
- Income Statement, Net Income or «Bottom Line» at wikipedia.org
Disclaimer: This spreadsheet and the information on this page is for illustrative and educational purposes only. We do not guarantee the results or the applicability to your financial situation. You should seek the advice of qualified professionals regarding financial decisions.
Содержание
- Income Statement Template
- Income Statement
- Download
- Other Versions
- Description
- Income Statement Essentials
- Revenues
- Cost of Goods Sold (COGS)
- Operating Expenses
- Operating Income (EBIT)
- Income from Continuing Operations
- Income statement templates for Excel
- 2023 Income Statement – Profit & Loss Statement – Small Business
- What is an Income Statement?
- Video Demo
- Income Statement Examples
- Components or parts of an Income Statement
- Income Statement formulas
- Income Statement Format
- Creating Microsoft’s Income Statement
- Creating Income Statement for your Business
- Creating income statement in 4 simple steps
Income Statement Template
An income statement or profit and loss statement is an essential financial statement where the key value reported is known as Net Income. The statement summarizes a company’s revenues and business expenses to provide the big picture of the financial performance of a company over time. The income statement is typically used in combination with a balance sheet statement.
There are many ways to format an income statement. The two examples provided in the template are meant mainly for small service-oriented businesses or retail companies. (1) The simplified «single-step» income statement groups all of the revenues and expenses, except the income tax expense. (2) The «multi-step» income statement example breaks out the Gross Profit and Operating Income as separate lines. It first calculates the Gross Profit by subtracting Cost of Goods Sold from Net Sales. It calculates the Operating Income and then adjusts for interest expense and income tax to give the Income from Continuing Operations.
If all of those terms are making you queasy, read below the download block for more information.
Income Statement
Download
Other Versions
License: Private Use (not for distribution or resale)
Description
This income statement template was designed for the small-business owner and contains two example income statements, each on a separate worksheet tab (see the screenshots). The first is a simple single-step income statement with all revenues and expenses lumped together.
The second worksheet, shown on the right, is a multi-step income statement that calculates Gross Profit and Operating Income.
Income Statement Essentials
Net Income = Total Revenue — Total Expenses
Revenues
The income that is generated by providing a service, selling a product, earning interest on investments, renting extra office space, licensing technologies, selling advertising space, or licensing the use of your brand name. In the income statement template, there are categories for Sales revenue, Service revenue, Interest revenue, and Other revenue. You will likely want to customize the Revenue section to highlight your company’s main sources of revenue.
Cost of Goods Sold (COGS)
For a retail company, one of the main expenses is the cost of goods sold. So, you’ll see Cost of Goods Sold broken out into its own section, with Gross Profit calculated as the Net Sales minus Cost of Goods Sold. Use the MultiStep worksheet in this case.
The cost of goods sold can be calculated by adding beginning inventory, goods purchased, raw materials and direct labor for goods manufactured, and then subtracting the ending inventory.
For service businesses, COGS might not be such a large factor, so that is why the SingleStep worksheet doesn’t have a separate COGS section.
Operating Expenses
This section is where you include all your operating expenses such as advertising, salaries, rent, utilities, insurance, legal fees, accounting fees, supplies, research and development costs, maintenance, etc. Don’t include interest expense and income taxes (they will be included later).
Operating Income (EBIT)
In the multi-step income statement, the operating income is calculated as the Gross Profit minus the total Operating Expenses. In general, interest expense and income tax expense are not included as operating expenses, which gives rise to the term EBIT or «earnings before interest and taxes» — another name for Operating Income.
Income from Continuing Operations
This is the «bottom line», calculated as the Operating Income minus interest expense and income tax (and plus/minus non-operating revenues, expenses, gains, and losses, if there are any). If there are no «below-the-line» items, then this is the same as the Net Income.
Источник
Income statement templates for Excel
Overview
All templates are crafted using the latest reporting best practices. Find the one that suits you best and visualize your data in a way that delivers immediate business insights and inspires action. Not sure which one to choose? Take a look at what they offer below.
Income statements with basic comparisons (up to 3 measures)
These income statement templates for Excel allow you to compare your actual results with up to 3 measures (previous year, plan and forecast). Use them to visualize your data in the form of tables with integrated waterfall charts, taking advantage of unique features like custom calculations (invert/result), formula manager for calculating new data elements, and dynamic comments. They also display absolute and relative variances that are calculated automatically.
Income statement with a bridge chart
This waterfall-chart-based template will help you visualize your profit & loss data and keep track of the trends. Use the template to quickly show how different accounts contribute to the total value, invert the costs and see which account has the biggest impact on your business. The visual automatically calculates and displays the variances, highlights subtotal differences and allows you to add dynamic comments for more context.
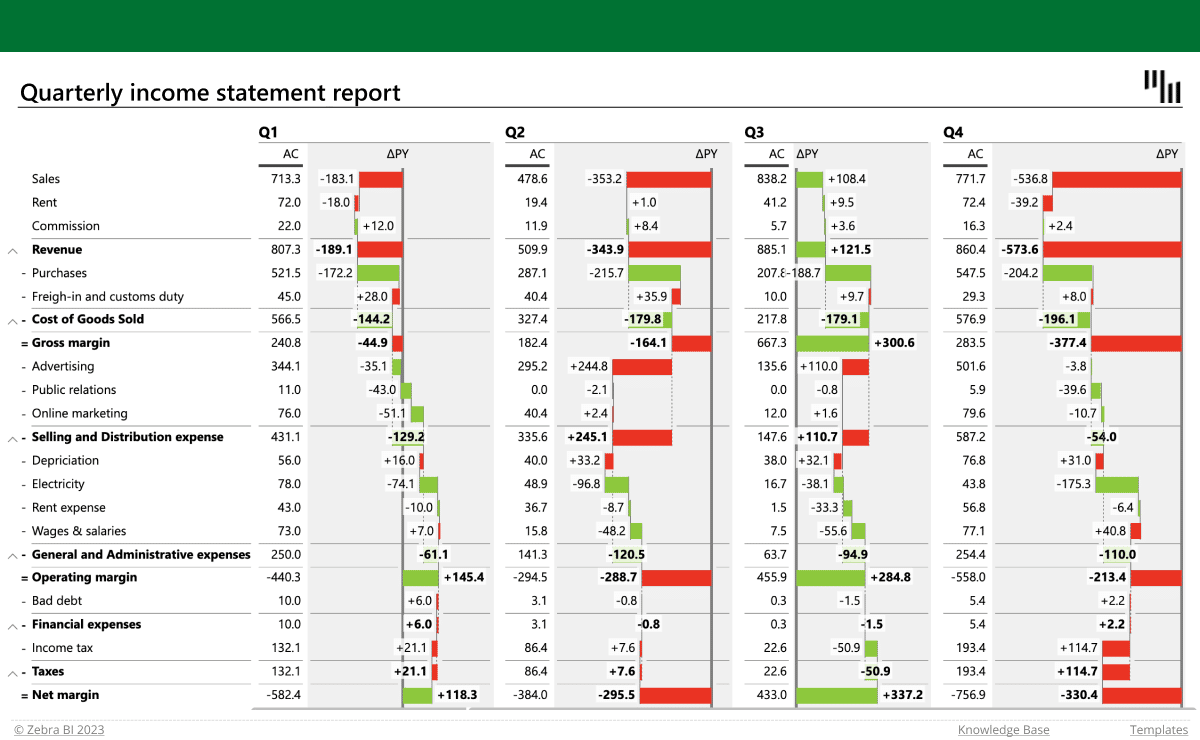
Quarterly income statement
This template allows you to break your profits and losses into quarters and track them across channels. The time dimension and automatically calculated relative and absolute variances are displayed in columns which can be hidden for the purpose of greater clarity. You can expand and collapse the rows to adjust the level of detail, use the formula manager to calculate new data elements or take advantage of custom calculations to invert the negative accounts or mark them as results.
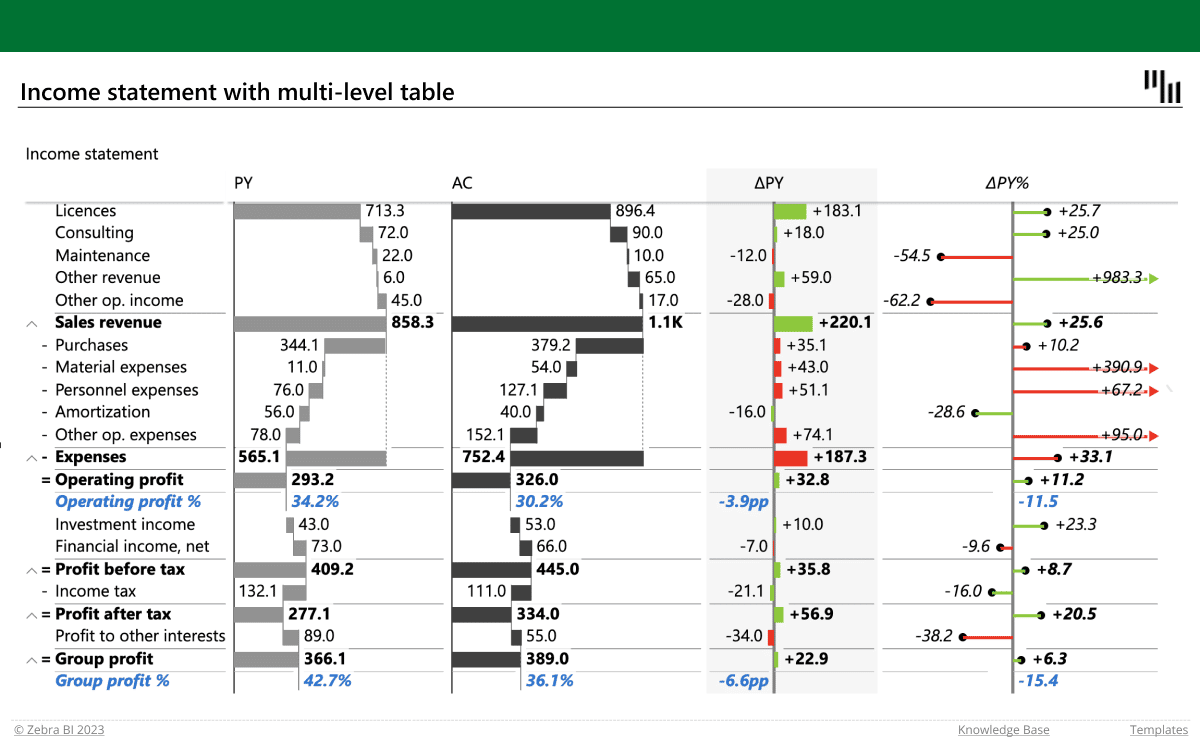
Income statement with multiple levels
Dealing with complex operations? Use this template to visualize multiple levels of data. Insert your numbers into a pivot table and dive deeper into the details of each category by using the expand & collapse functions. Calculate additional data elements with the formula manager and use custom calculations (invert, result) to display your accounts the right way. Take advantage of the automatically calculated variances and multiple comparisons to get your questions answered in no time.
These income statement templates for Excel are super easy to use! Check out the short video below and see for yourself.
Источник
2023 Income Statement – Profit & Loss Statement – Small Business
Indzara | Posted on August 25, 2021 |
In this article, we will cover the definition of an Income statement, use some examples to understand the format of an income statement. We will define the 7 parts of an income statement. We will create Microsoft’s income statement in Excel. We will also discuss how you can create an income statement for your small business using a free Excel template.
What is an Income Statement?
Let’s start with income statement definition.
An income statement is a financial statement of a company that shows the company’s revenues and expenses during a specific period. It is a representation of the ‘profitability’ of a company.
It is one of the three financial statements of a business or a company. Balance Sheet and Cash Flow Statement are the other two.
Income statement is also called using the following names:
- Profit and Loss Statement (P&L)
- Statement of Profit or Loss
- Revenue Statement
- Statement of Financial Performance
- Earnings Statement
- Statement of Earnings
- Operating Statement
- Statement of Operations
Video Demo
Income Statement Examples
In order to understand the structure and parts of an income statement, let us take a look at some example income statements from three well-known companies, Microsoft, Apple and Tesla. These are available to download from the companies’ websites.
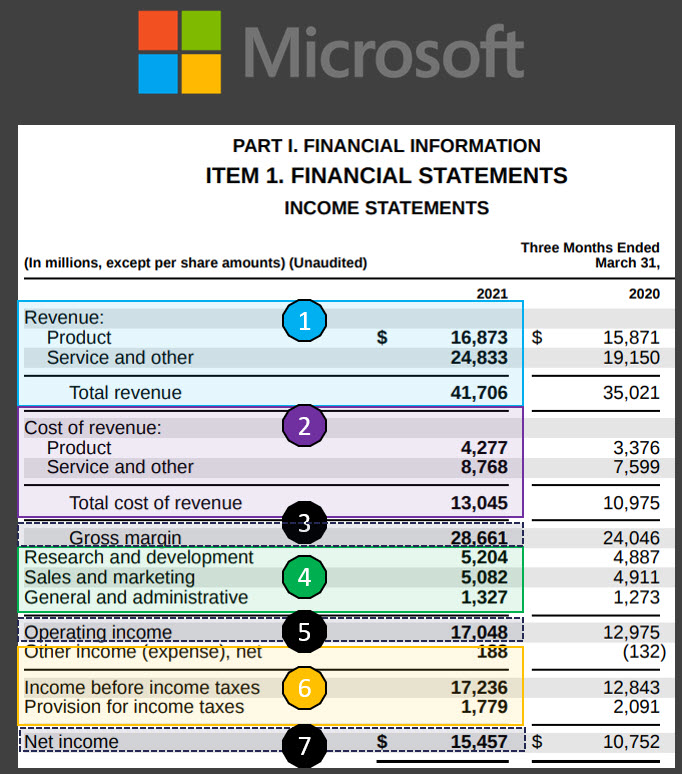
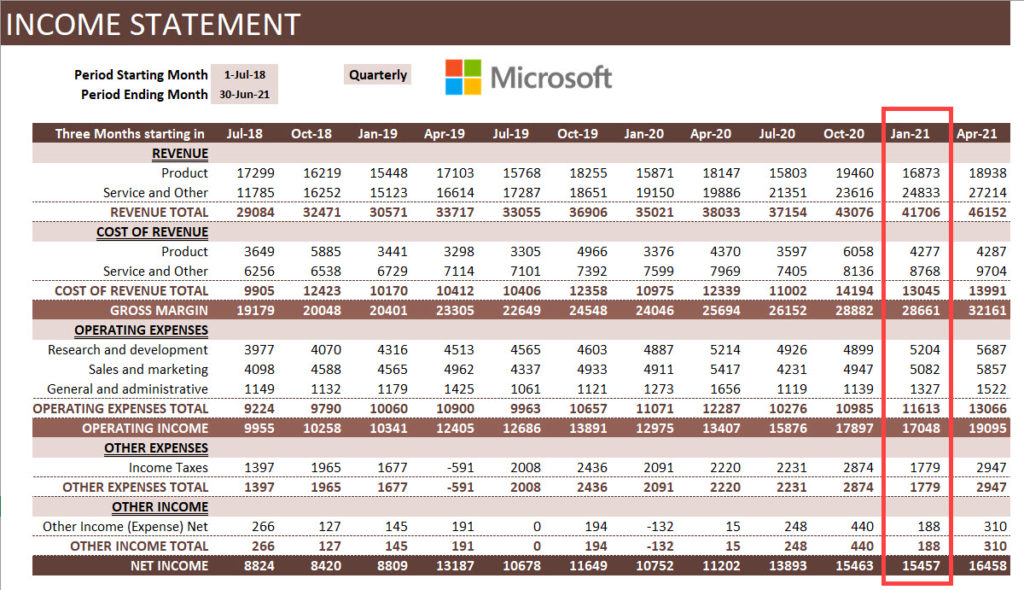
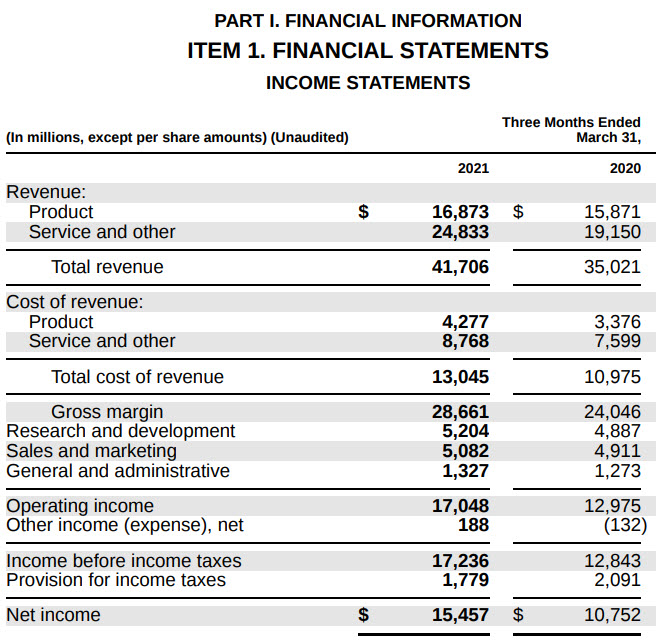 Microsoft Income Statement (ending March 2021)
 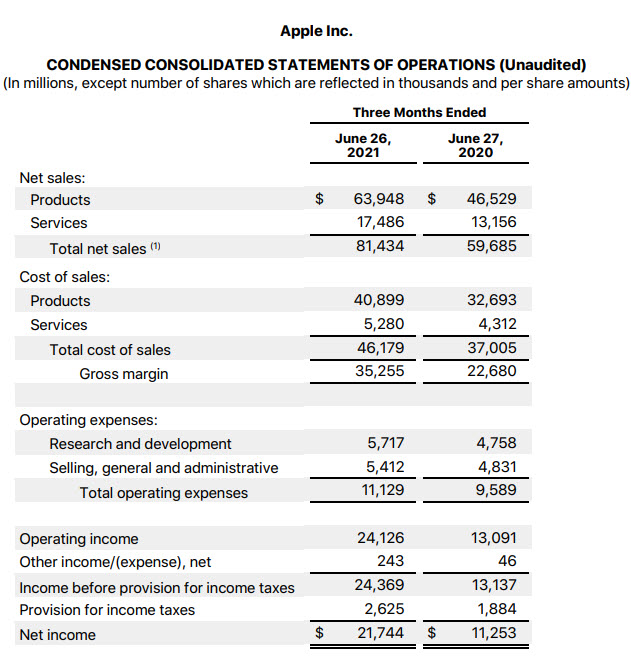 Apple Income Statement (ending June 2021)
 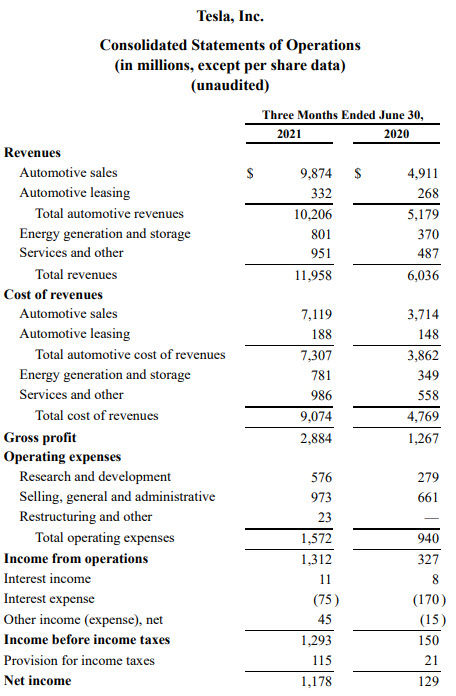 Tesla Income Statement (ending June 2021)
We will talk about some differences later, but let’s focus on similarities between the statements.
Broadly speaking there are 7 key sections that I could see. I will use Microsoft’s income statement for this illustration.
 Parts of an Multi Step Income Statement
- Sales or Revenue
- This is the total sales recorded by the company during the period. In this case, Microsoft recorded $16,873 M of Product revenue and $24,833 M of Service and other revenue. Total Revenue was $41,706 M in 3 months ending March 31, 2021.
- This typically represents the sales amount of products and services shipped out to customers during the period. Whether the customers have made the payments to Microsoft is immaterial when it comes to the Income statement. When the cash actually flows into Microsoft will be reflected in a different financial statement (Cash Flow Statement).
- This is called the top line.
- Cost of Sales or Cost of Revenue
- This is the direct cost of producing the goods. This will typically include raw materials, labor, shipping costs and other costs which were needed to build the inventory and deliver the products and services which generated the sales in the previous section.
- In this case, Microsoft spent $4277 M for Product and $8768 M for Service and Other. Totally cost of revenue was $13,045 M
- Also called as Cost of Goods Sold or COGS.
- Gross Marginor Gross Profit
- This is the amount left over from sales after removing the cost of Sales. This is a good indicator of the margin of our products or services. For example, if it costs $150 to make a product that we sell for $160, it is only $10 Gross margin on each product sold. Let’s assume 1000 products sold during the period. Though the top line may look good with $160,000 it will result in only $10,000 in Gross Margin.
- For Microsoft, if we subtract $13,045 M from $41,706 M, we get $28,661 M.
- Operating Expenses
- An expenditure may be a cost or an expense. Previously, we saw about Cost of Sales. Now, we see expenses.
- This represents the expenditure incurred by a company for operating or running the business. This includes salaries, rent and utility bills like electricity and water.
- Common grouping of Operating Expenses are
- Sales & Marketing expenses
- Research & Development (R&D) expenses
- General & Administrative (G&A) expenses
- These are sometimes called SG&A (Sales, General & Administrative) expenses.
- Microsoft spent totally $11613 M as Operating expenses. I am not sure why Microsoft does not show the subtotal on the statement. I summed the three items to arrive at $11,613 M.
- Operating Income or Income from Operations
- This is the net income for the company subtracting Operating expenses from Gross Margin. This represents a true profit margin of a company because it considers all expenses involved in running the business.
- Microsoft’s operating income was $17, 048 M (which is Gross margin $28,661 M – Operating Expenses $11,613 M)
- Other Income/Expense Net
- Apart from the business operations, if there are other income and expenses they are recorded in this section. This section will include income tax payments.
- For example, if a company sells its real estate for a profit, that will be non-operating income. Paying interest on a loan is non-operating expense, while receiving interest on a bank account will be non-operating income. Income Tax payments will be an expense.
- Microsoft has indicated that their total ‘Other income’ is $188 Million. And $1779 M has been estimated as income taxes.
- Net Income
- Net Income represents the total net income of a company, considering both the operating and non-operating incomes and expenditures. It is Operating Income – Other Income/Expense.
- Microsoft’s net inocme is $15,457 M
- If this amount is positive, that would indicate profit. If negative, it will be a loss.
- This is also referred to as the bottom line of a company.
Components or parts of an Income Statement
To summarize, the 7 parts of an Income statement are below.
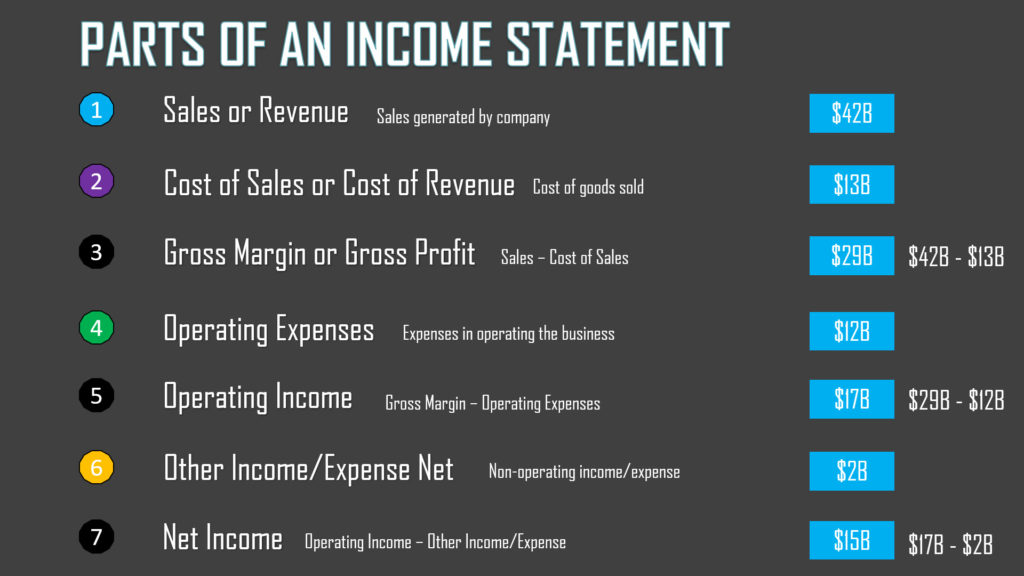
- Sales/Revenue: Sales generated by company
- Cost of Sales/Cost of Revenue: Cost of producing the goods sold
- Gross Margin = Sales – Cost of Sales
- Operating Expenses: Expenses in operating the business
- Operating Income = Gross Profit – Operating Expenses
- Other Income/Expense Net: Net of non-operating income/expense
- Net Income = Operating Income – Other Income/Expense Net
Note: Earnings per share will appear on the income statement if the corporation’s stock is publicly traded. We will skip that part as we are focused on small businesses which are not traded on the stock market.
Income Statement formulas
As we have seen above, there are three calculated indicators in the Income Statement. Their simple formulas are shown below.
- Gross Margin = Sales – Cost of Sales
- Operating Income = Gross Margin – Operating Expenses
- Net Income = Operating Income – Other Income/Expense Net
Income Statement Format
Though there is an overall structure with certain key elements that are standard as per accounting rules, each company may have slightly different formats,
As we scan through the three statements, a few things to note:
- Name of the statement may vary
- Microsoft calls it Income Statement, while Tesla and Apple call them Consolidated statements of Operations.
- Names of the sections or items may vary
- Microsoft and Tesla call Revenue or Revenues while Apple calls it Net Sales
- Microsoft and Tesla call Cost of Revenue while Apple calls it Cost of Sales
- Terms Profit and Income are used interchangeably. Sales and Revenue mean the same.
- Level of detail provided may vary
- Tesla has more detailed product/service break down compared to Microsoft and Apple. Microsoft, for example, in their Excel version of their statement provide product segment breakdown in a separate sheet. So, companies can provide details separately or within the income statement itself.
- Periods may vary
- Though these three statements are quarterly, companies may also provide annual statements as well. In the statements, typically prior period will be compared. If it is quarterly, comparison with previous quarter and if annual, comparison with previous year.
- Delivery Format may vary
- Microsoft seems to provide an Excel version of their income statements, but I didn’t see the same for Apple and Tesla. They do provide PDF and other formats.
Creating Microsoft’s Income Statement
Creating Microsoft’s income statement as a sample is very easy with our Free template.
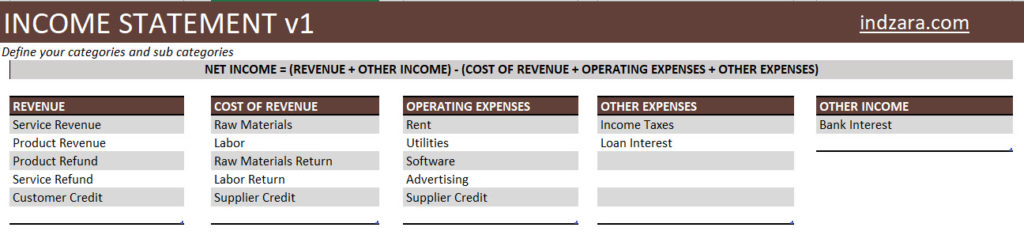
Step 1: Define transaction categories and subcategories.
As we have seen earlier, each company may have different levels of details.
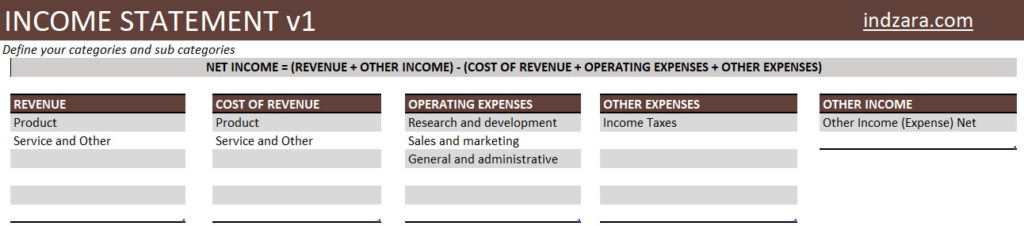 Define categories and sub-categories
In the above screenshot, I have entered the 5 transaction categories (Revenue, Cost of Revenue, Operating Expenses, Other Expenses, Other income) and subcategories within each category. I have mirrored what Microsoft has used in their income statement.
Step 2: (Optional) Customize the terms used.
We will mirror what Microsoft used in its income statement.
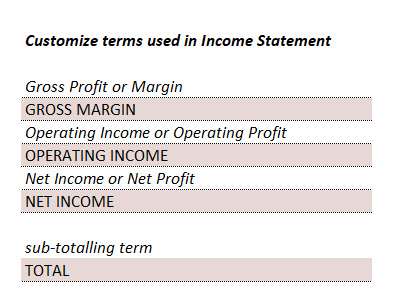 Customize terms
Step 3: Enter quarterly transactions
We have to enter the quarterly entries in the Transactions sheet.
![]() Microsoft’s transactions – Quarterly
Microsoft’s transactions – Quarterly
Since the entries are once per quarter, I have entered the quarter beginning date as transaction date. You can enter any date during the quarter.
In the above screenshot, we show the last 2 quarters of entries.
I have entered 12 quarters (from July 1, 2018 to June 31, 2021) to demonstrate the output.
The Income statement is generated automatically.
Quarterly Income Statement
 Quarterly Income statement
Yearly or Annual Income Statement
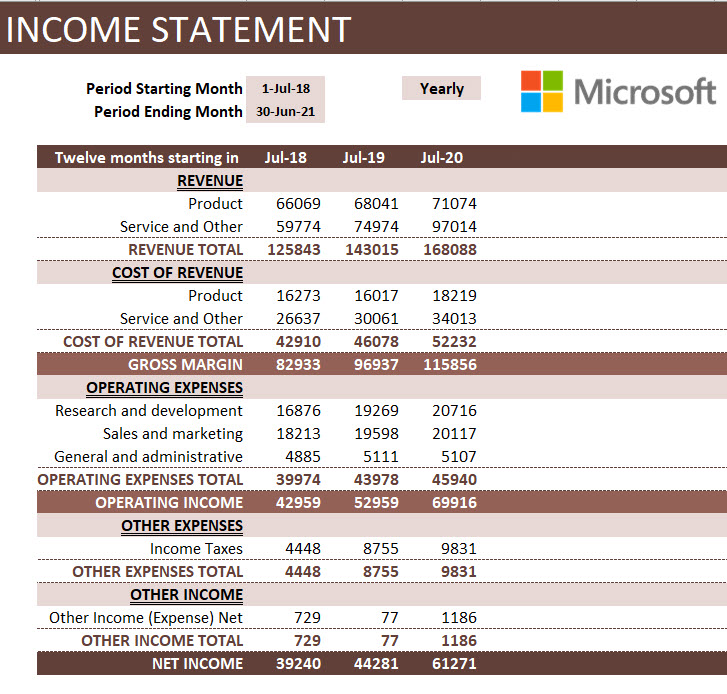 Yearly Income Statement
Creating Income Statement for your Business
Creating income statement in 4 simple steps
1. Define transaction types and categories that suit your business
 Defining categories and sub-categories
In the above, you will see that I have provided some sample sub categories you can choose.
- Granular sub-categories
- WithRevenue and Cost of Revenue, I have included values such as refunds and credits. These are relevant if you would like to get that level of detail in your income statement. I prefer it because it allows more visibility for me as a business owner.
- When it comes to Operating expenses, I have provided more detailed sub-categories like Rent, Utilities, Software, etc. This again will allow me to see how these contribute to the overall profitability of my company.
2. Customize the terms (Optional)

- I would not change much here and will leave the terminology to default. If you are specific about something, please feel free to modify it.
3. Entering transactions
![]()
- I recommend entering more detailed transactions in this table.
- In Microsoft’s case they will have many millions of transactions happening and hence we had to aggregate it. For a small business, if we have thousands of transactions or even a few tens of thousands, we can actually enter them in here as they are.
- For example, in my own personal case, I enter all the orders I have received as individual lines or rows in this table. I could enter Order number in the optional Transactional Notes column for reference. This allows me to troubleshoot or analyze the data in a granular level that I may not be able to, if I enter only one row for all product revenue each quarter.
- For most businesses, the ideal case may be in between the Microsoft example of one row per quarter and my personal example of every single transaction. You could enter one row of Product Revenue for each month. One row of Service Revenue per month, etc.
- There are multiple ways to handle this and the template can handle those easily.
- Add more columns as needed to document information that is relevant
4. Customize Income Statement
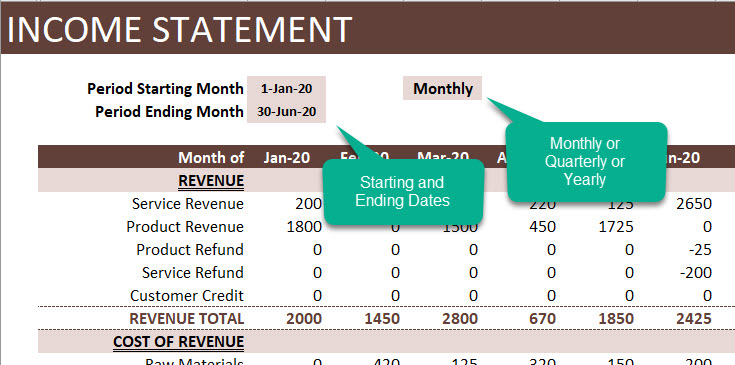
Enter the starting and ending dates.
Choose Monthly or Quarterly or Yearly.
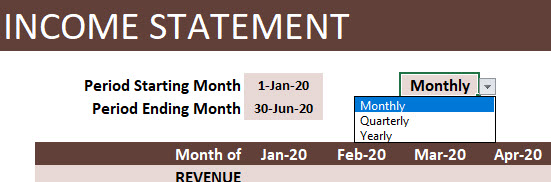
Note: If we didn’t enter Monthly transactions, then we have to choose Quarterly or Yearly. Depending on how often you enter data, the aggregations can be made.
Источник
In the world of financial reporting, there are three main financial statements to consider. One of them is the income statement, alongside the cash flow statement and the balance sheet. This blog post shows how to set-up your own template to generate income statement automatically. Nowadays, companies do not need specialist software or external accounting to keep track of financial data.
An income statement, also called an operating expenses statement, summarizes your company’s revenue and expenses over a specific period of time. Additionally, organizations use it to secure investments and calculate taxes. Moreover, an income statement gives managers and investors a clear overview of a company’s financial situation. Learn how to use your own data and set up an in-house income statement template with spreadsheets.
Why use Excel to generate income statements?
- Flexible: Google Sheets lets you manage and analyze your financial data in the way that suits your business. Whenever you need to change the system you can simply adapt the spreadsheets — without accounting software or IT support.
- Accessible: Because Excel can be stored online, your accountants or admin staff can access and transfer their data at any time, from their phone or laptop.
- Compatible with everything: Every piece of software on the planet integrates with Excel. This means that if your company has data in other programs, you can easily import that information straight into Excel.
- Easy to use: Most people in your company probably already use spreadsheets and Excel is user-friendly for beginners. As a result, the system is easy to maintain and onboarding your team is quick and simple.

How to get started
Sheetgo’s spreadsheet-based template is ideal for anybody looking for a way to convert real-time income and expenses data into an automatically generated monthly income statement.
On top of that, it includes a pre-built dashboard outlining the company’s income and expenses. No matter the size of the organization, this income statement template in Excel allows teams to easily collect and share financial data.
What is an Excel-based workflow template?
Instead of providing you with a single file containing charts and formulas, Sheetgo’s income statement template gives you a complete system. The workflow consists of separate Excel files that exchange data between them automatically.
By having separate spreadsheets, each employee can manage their work privately. This way, you do not have to worry about slow spreadsheets caused by multiple people working in the same file. Besides, your data remains private and secure.
A spreadsheet-based workflow template gives you:
- Organization and data privacy: Each file is dedicated to one task, for better data protection and accuracy. Instead of working in a large shared spreadsheet, colleagues record financial data in their own personal spreadsheet. Sheetgo connections export this data to the manager’s master sheet automatically.
- Scalability: You can build upon your Excel-based system as your company grows. It’s easy to expand the workflow by connecting more spreadsheets, without redesigning the system or switching to a new solution.
- Integration: Excel is compatible with everything, so accountants and managers can easily import and combine data from other software packages. In a couple of clicks, you can connect data from Operations, Sales, or other company workflows to create an integrated financial management system.

What you get with this template
When you install the Sheetgo income statement template, three Microsoft Excel files with pre-built Sheetgo connections are saved to your OneDrive, SharePoint or Dropbox account:
- One Expenses Inputs spreadsheet, to be shared with the person(s) responsible for payments. Some examples of expenses are taxes, purchases, salaries, and other outgoings.
- One Income Inputs spreadsheet, to be shared with the person(s) responsible for processing invoices. The person responsible for this spreadsheet logs any money the company receives.
- One Automated Income Statement master sheet, for the CFO, accountant, or administrator. This master sheet includes an automated income statement, an expenses report and an income report.

How to install the Sheetgo Excel income statement template
Click the blue button below to sign up for Sheetgo and install its income statement workflow template:
![]()
Income statement

Track income and expenses and generate an automated statement report.
- Login to Sheetgo with your Google, Microsoft, or Dropbox account.
- Click Install template and choose your preferred platform to store your copy of the template.
- Please allow a few moments as Sheetgo creates the connections and saves a copy of the template files to your chosen storage.
How to use the income statement template in Excel
Once you’ve installed the template, start by opening the Income statement master sheet from inside the Sheetgo web app.
In this sheet, find an automated overview of net operating income per month, your gross margin, expenses, and more.
Choose to either use the template online or use the Excel Desktop App.
Step 1: Set up the master sheet
- In the Instructions tab of the Income statement master sheet, choose which year you want to analyze.

Step 2: Configure the Income Inputs sheet
- Go back to the Sheetgo web app with the Income Statement workflow and open the Income Inputs sheet by double-clicking it.
Your colleague(s) responsible for processing invoices use this file to enter the company income.

This template contains sample data to give you an idea of how it works. Simply delete or replace this with your own finances.
Another option is to connect your existing finance spreadsheets to this workflow with Sheetgo connections.
- Click the Instructions tab on the left and enter the year you wish to analyze.
- Share this spreadsheet with your accountant or the person responsible for processing invoices and income.
- Click the Share button on the top right side of your screen.
Once your colleagues start entering data in the Income tab, the template creates automated income reports in the Accrual Mapping and Summary per Month tabs automatically.
Step 3: Configure the Expenses Inputs sheet
Now that you have successfully set up and shared the Income Inputs spreadsheet, do the same for the Expenses Input sheet.
- Go back to the Sheetgo web app with the Income statement workflow and double-click the Expenses Input file to open it in a new tab.

Similar to the Income Inputs file, the Expenses tab contains sample data that you can delete or overwrite. The template uses the data in the Expenses tab to automate an Expenses report in the Summary per Month tab.
Share this spreadsheet with the person responsible for making payments in your company. Do so by clicking the Share button on the top right side of your screen.
Step 4: Transfer the data
After you have shared the Income inputs and Expenses inputs sheets with your colleagues and they are entering their data, bring that data back to the Automated Income Statement master sheet by updating your workflow.
- First, go to the tab with the main Income statement workflow and then click Run in the menu bar.

Sheetgo now updates both the connections (Income inputs & Expenses inputs) whilst pulling that data to the Automated Income Statement master sheet. Moreover, the template generates an automated Income report, Expense report, and an Income statement.
Step 5: Automate your workflow
Save yourself and your colleagues valuable time by scheduling automatic transfers. As a result, the template runs automatically on specific moments you select. Automation ensures that your Income Statement and Expenses/Income reports always contain the latest data from the Input spreadsheets.
- Go to the tab with the main Income statement workflow and click Automate in the menu bar.
Under Schedule settings,
- Firstly slide the bar to the right to enable automatic updates.
- Secondly, select how frequently you want Sheetgo to transfer the data.
You have many options here and can choose to transfer multiple times a day, once a day or once a month. Next, select your preferred time window and your time zone.
You are able to see how many transfers per month your selection will approximately amount to at the bottom of the settings tab.
- Finally, save your changes when ready and your workflow will now automatically transfer.

All done!
Congratulations on setting up your Automated Income Statement!
If you want to further customize the template or have any questions, do not hesitate to book a call with our automation experts.
Businesses, both big and small, need to track their performance. This is why financial statements, such as the balance sheet and income statement, are useful.
To check your business’s performance, you don’t even need an accountant or accounting software. Excel can help you make your own statements if you follow the instructions.
To help you prepare your statements, here’s a guide on how to make an income statement.
What Is an Income Statement?
This document is pretty simple. All you need to remember is this formula:
Net Income = (Total Revenue + Gains) - (Total Expenses + Losses)
Once you’ve created your income statement, you’ll see how much you’ve made (or lost) in a period. You will also see the amount you’re making or spending per category.
This information will let you see your efficiency. The data will also tell you what aspects of your business needs improvement.

1. Choose Your Period
Most income statements are prepared annually. That way, you can see how you did your previous year and what you can improve.
However, you can create quarterly (or even monthly) income statements. This is particularly useful if your business is new or if you’re changing strategies. That’s because it allows you to see the overall impact of the changes you make.
2. Have Your Journal on Hand
Accurate record-keeping is necessary for any statement you make. That’s why businesses need to keep track of their financial transactions in a journal.
If you haven’t started a journal yet, you can create your income statement with your receipts, bank statements, and other records. As long as you have complete details, you can make a reasonably accurate income statement.

3. Arrange Your Information
Before moving forward with creating the income statement, you should arrange them first. This document has four primary categories:
- Revenue/Profit Section: refer to money made and spent under your company’s primary purpose.
- Operating Expenses: refers to your company’s day-to-day expenses. These are your required expenditures to run your business.
- Gains (Losses) from Continuing Operations: refers to your interest expense, taxes, and other cash movements unrelated to operations.
- Non-recurring Events: refers to significant, non-recurring gains and losses. These could be the sale or purchase of significant assets, income from discontinued operations, accounting considerations, and other items.
Find which section each transaction falls in so it will be easier to fill out your Excel file later.
4. Make the Excel File
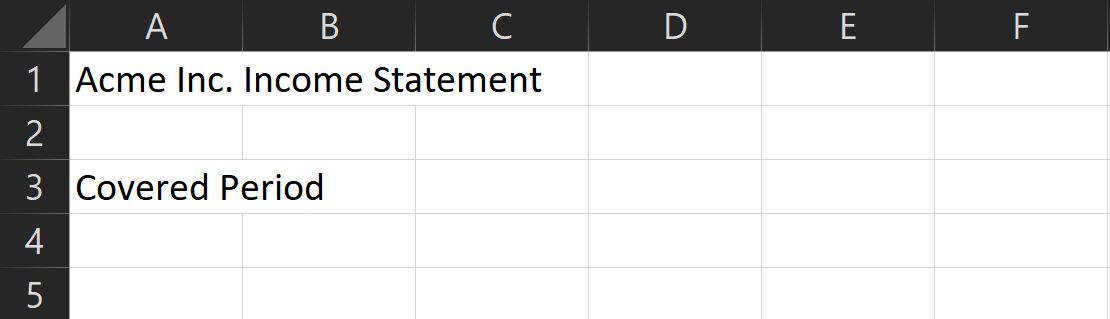
- To make your Income Statement, first, open up Microsoft Excel, then create a new file.

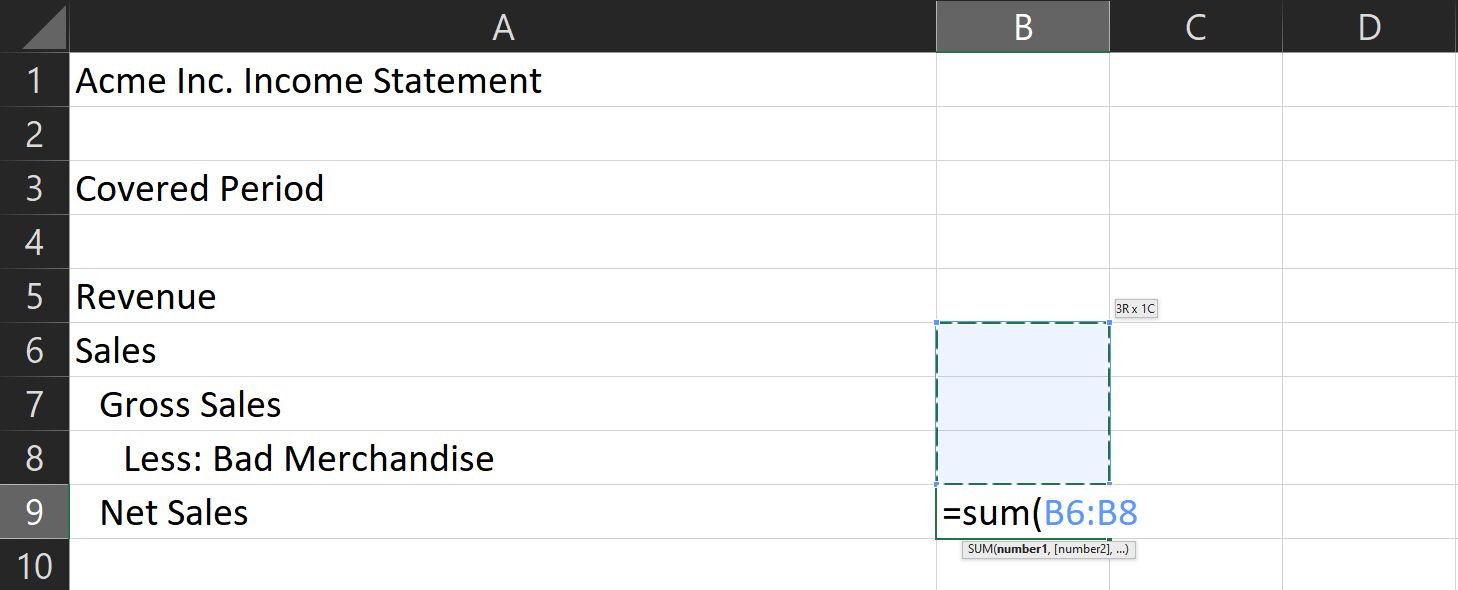
- In the first cell, type in [Company Name] Income Statement. This helps you organize your files, especially if you need to print this document.
- Skip one row and then write Covered Period. This shows what dates are covered by this income statement.
5. Find Your Subcategories
The four categories provided remain the same across most companies. However, the sections under here will change from business to business.
To help you choose which section to place, here are some examples:
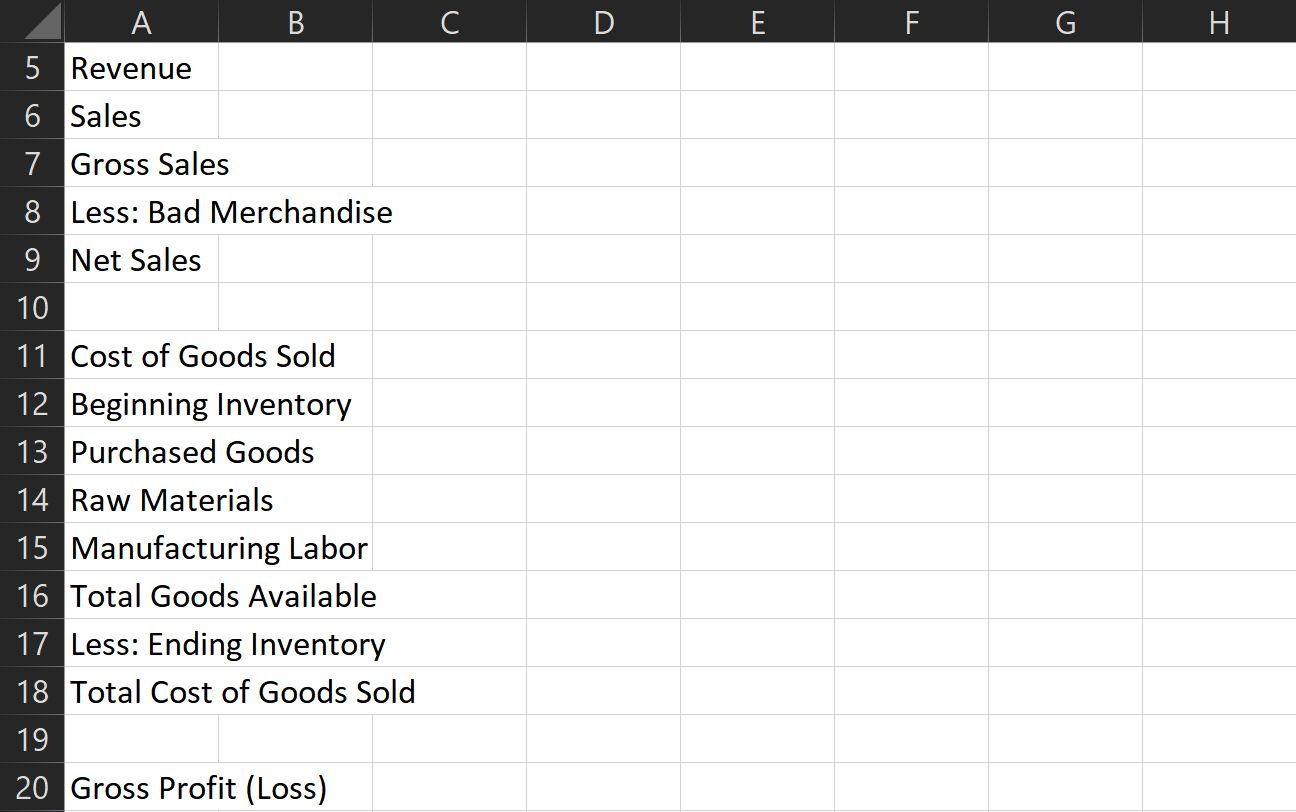
1. Revenue
- Sales
- Gross Sales
- Bad Merchandise
- Net Sales
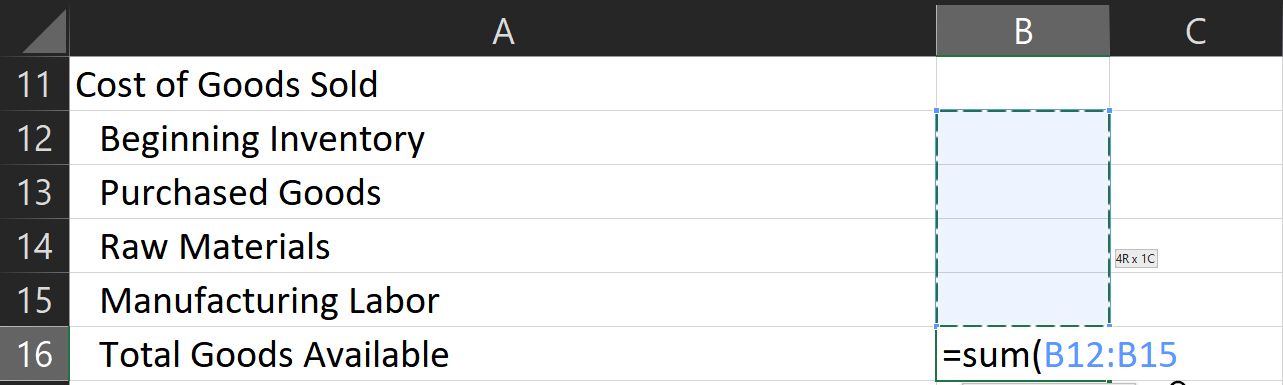
- Cost of Goods Sold: this refers to your capital for your inventory. This is only applicable if your business deals with physical items. If you’re a service-based business, you can skip this section.
- Beginning inventory
- Purchased goods
- Raw materials
- Manufacturing labor
- Total Goods Available
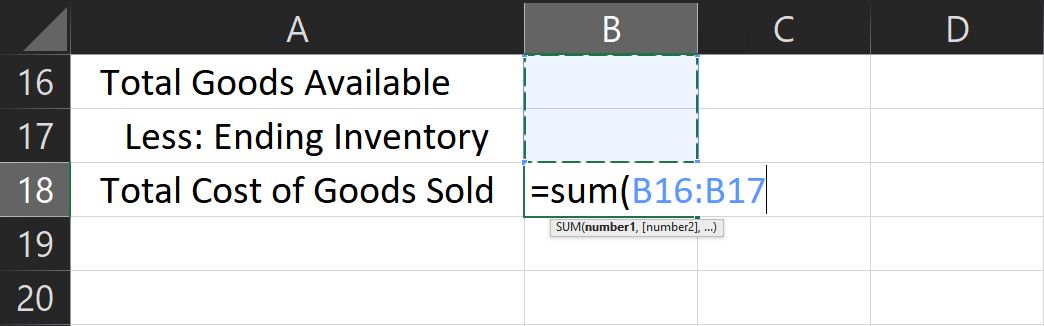
- Ending Inventory
- Total Cost of Goods Sold
- Gross Profit (Loss)
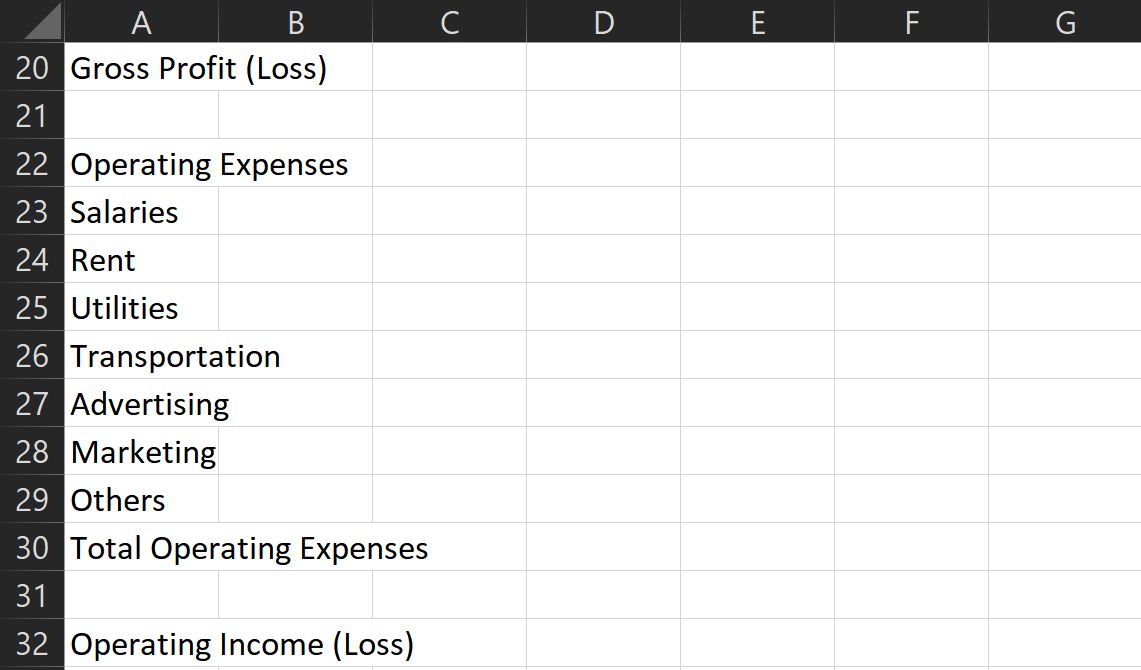
2. Operating Expenses
- Salaries
- Rent
- Utilities
- Transportation
- Advertising
- Marketing
- Others
- Total Operating Expenses
- Operating Income (Loss)
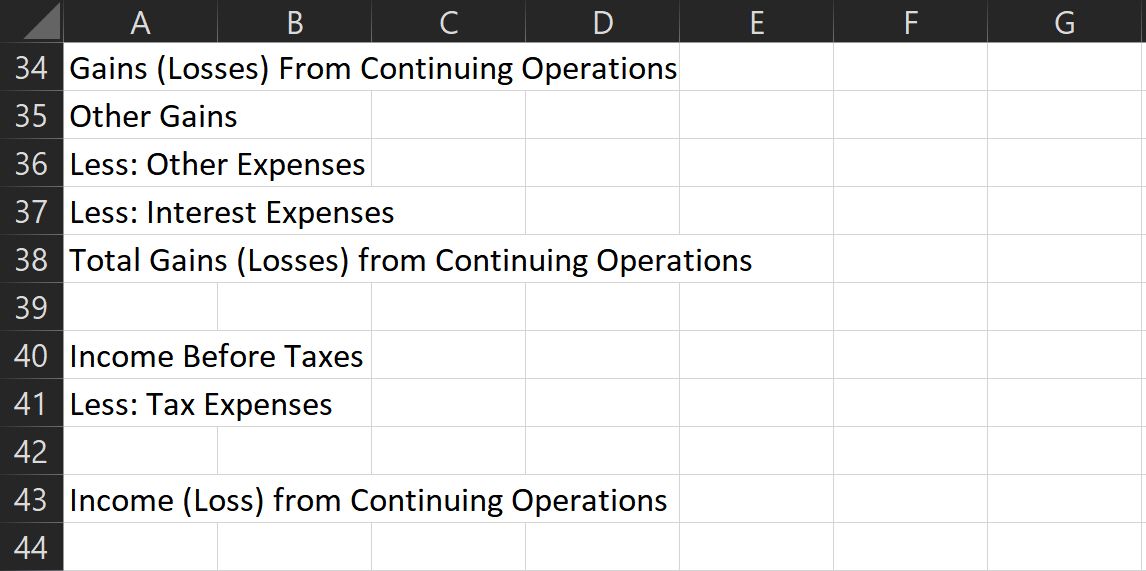
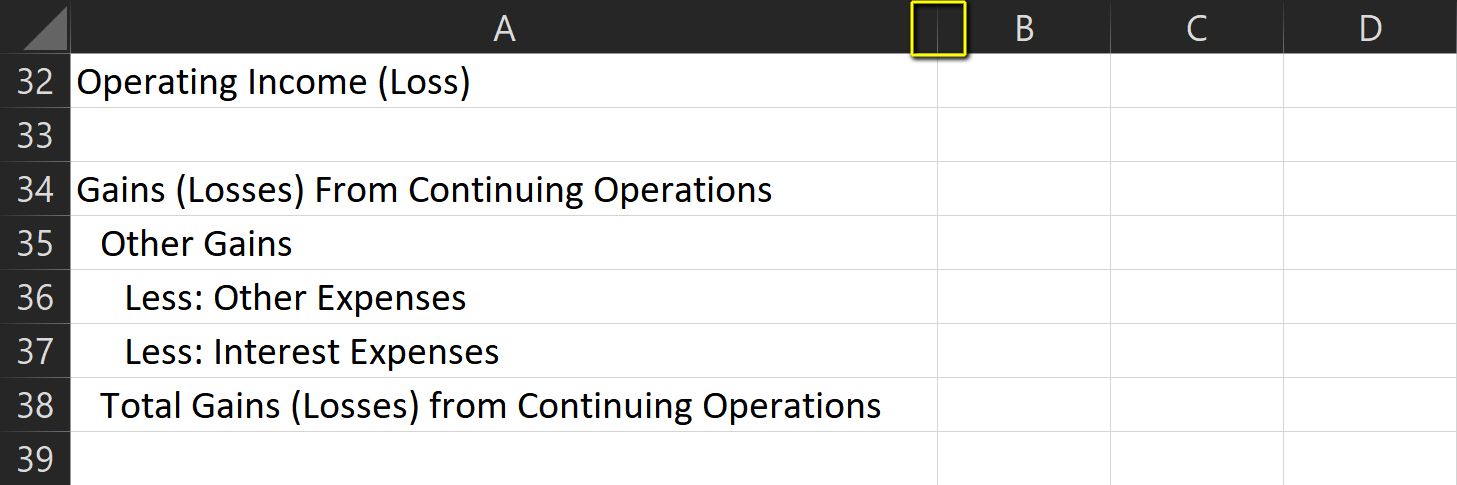
3. Gains (Losses) From Continuing Operations
- Other Gains
- Other Expenses
- Interest Expenses
- Total Gains (Losses) from Continuing Operations
- Income Before Taxes
- Tax Expenses
- Income (Loss) from Continuing Operations
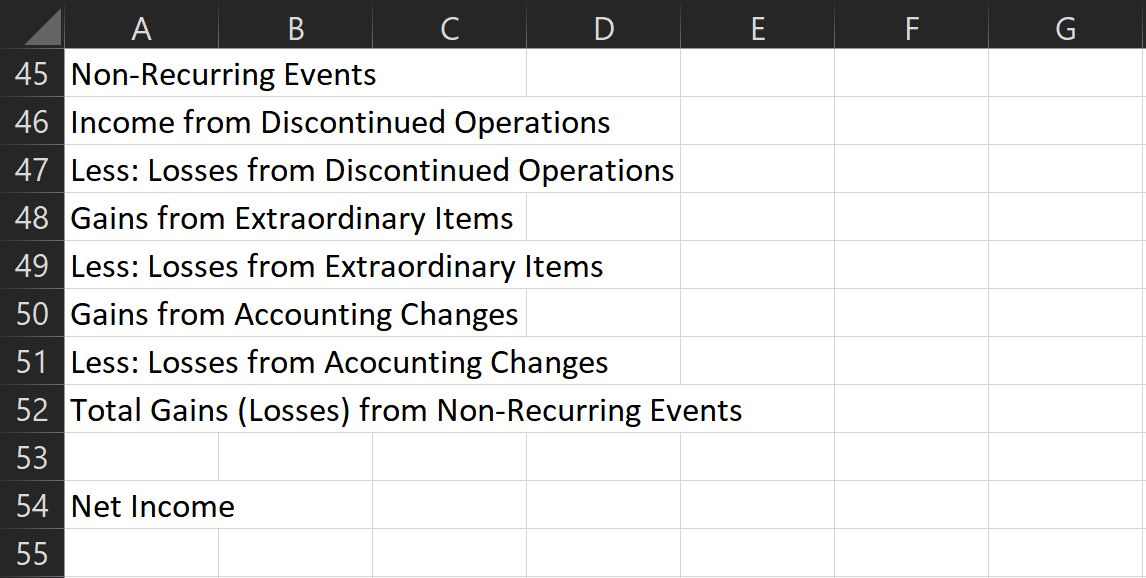
4. Non-Recurring Events
- Income from discontinued operations
- Losses from discontinued operations
- Gains from extraordinary items
- Losses from extraordinary items
- Gains from accounting changes
- Losses from accounting changes
- Total Gains (Losses) from Non-recurring Events
- Net Income
These categories are what most businesses use for their income statement. However, feel free to change this as you see fit.
Always add spaces between categories and subcategory sections. This ensures that you won’t get confused with tightly packed information.
Indent each subsection to help differentiate it from other sections. In the Home ribbon, you can find the Indent button under Alignment.
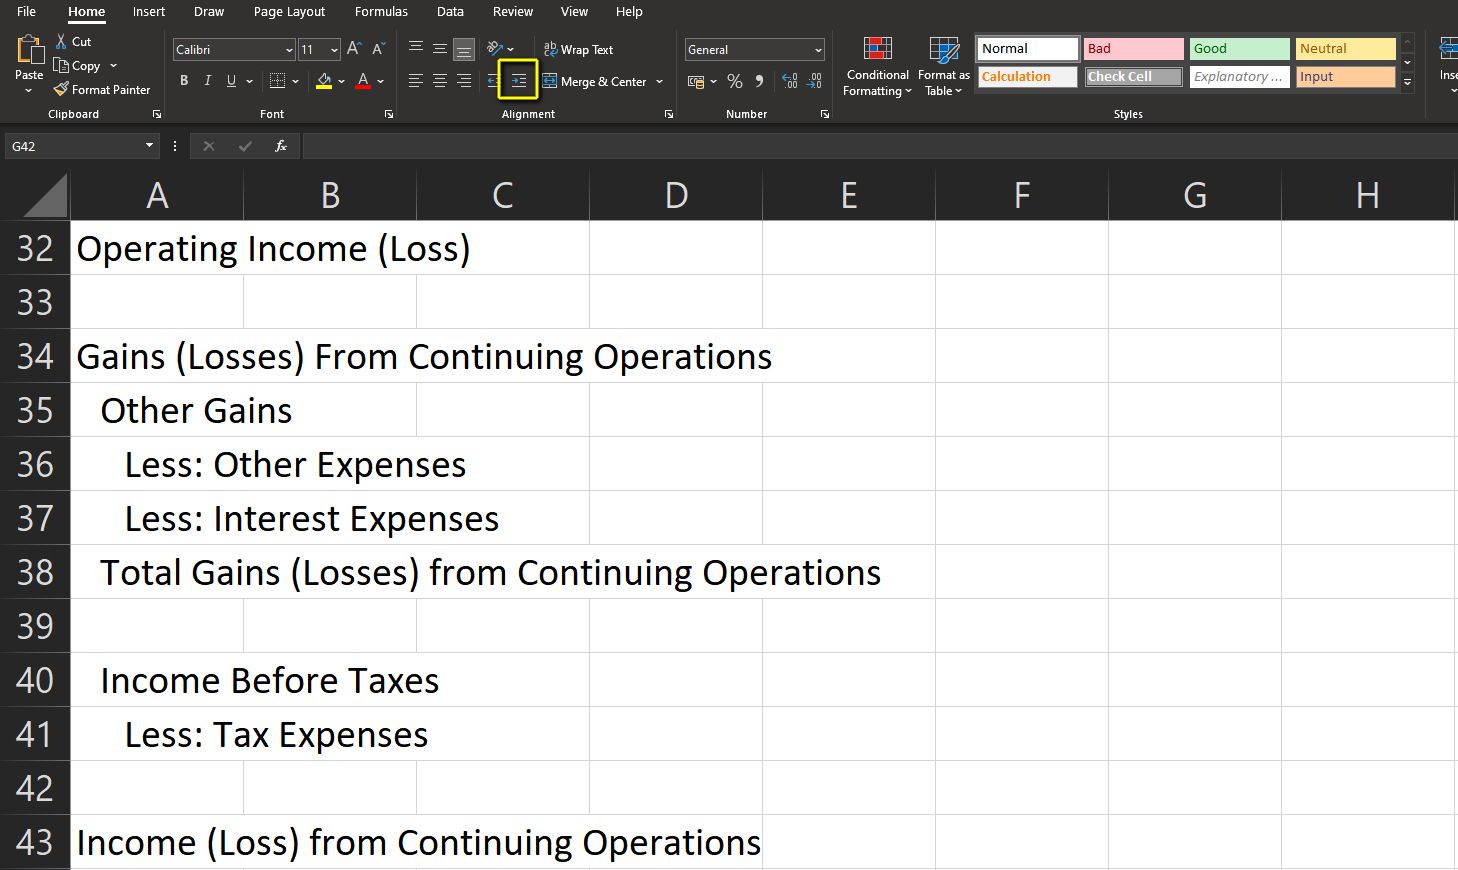
You can also resize the columns to ensure that all contents fit. Do that by double-clicking on the line between columns A and B.
6. Prepare Your Formulas
Formulas in your income statement are simple. After all, it’s just a matter of adding or subtracting values.
However, all values are connected, so you should be careful when writing your formulas. First, prepare the formula for Net Sales. All you need is to find the sum of the entries here.
To do that, type =SUM( and then select all entries under the Sales subsection. Don’t forget to hold the Shift key to select multiple cells.
The Cost of Goods Sold section has two subtotals. The first one is Total Goods Available. This is the sum of all your current inventory. To find this value, repeat the formula above and select all entries above Total Goods Available.
The Total Cost of Goods Sold is the sum of Total Goods Available and Less: Ending Inventory. Its formula is =SUM([Total Goods Available]:[Less:Ending Inventory])
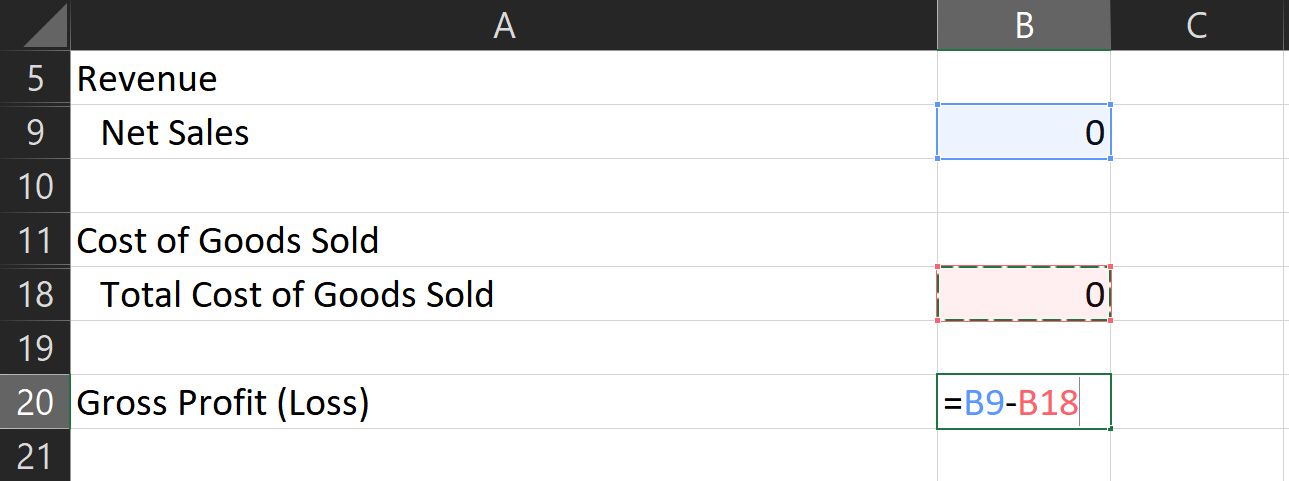
Once you have that value, compute your gross profit using this formula: =[Net Sales]-[Total Cost of Goods Sold]
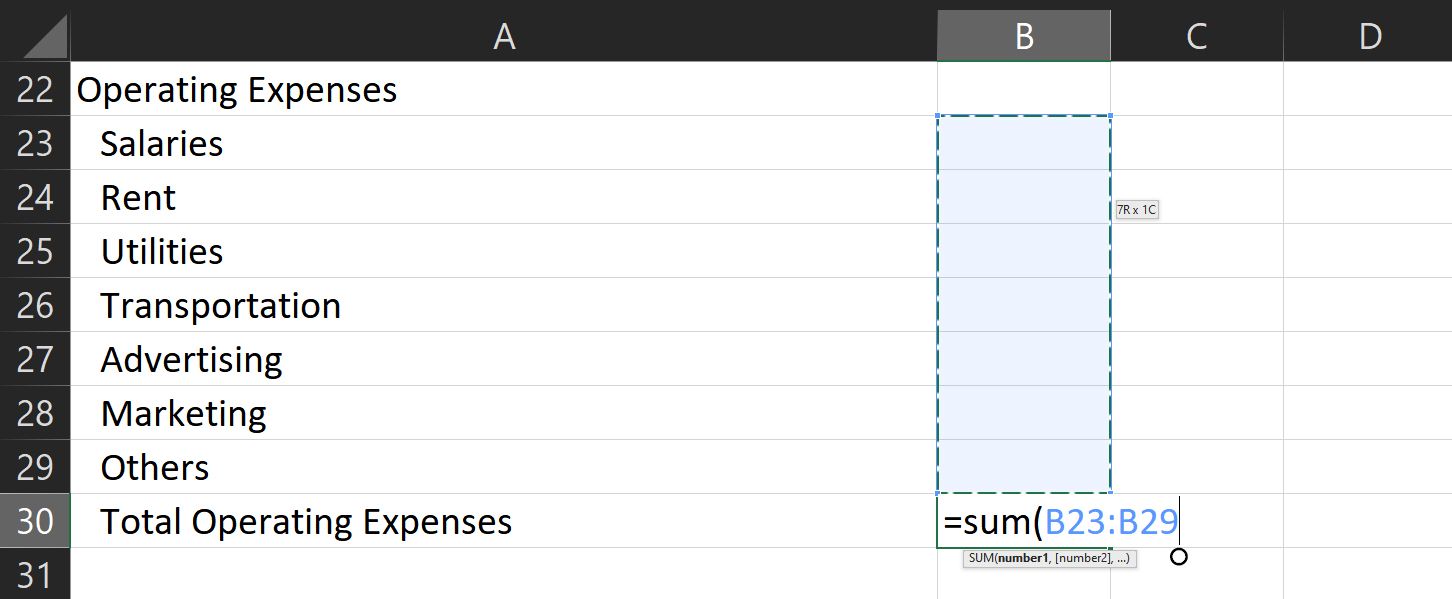
The formula for total operating expenses is like the one used in net sales. Use =SUM( then select all cells under this subcategory.
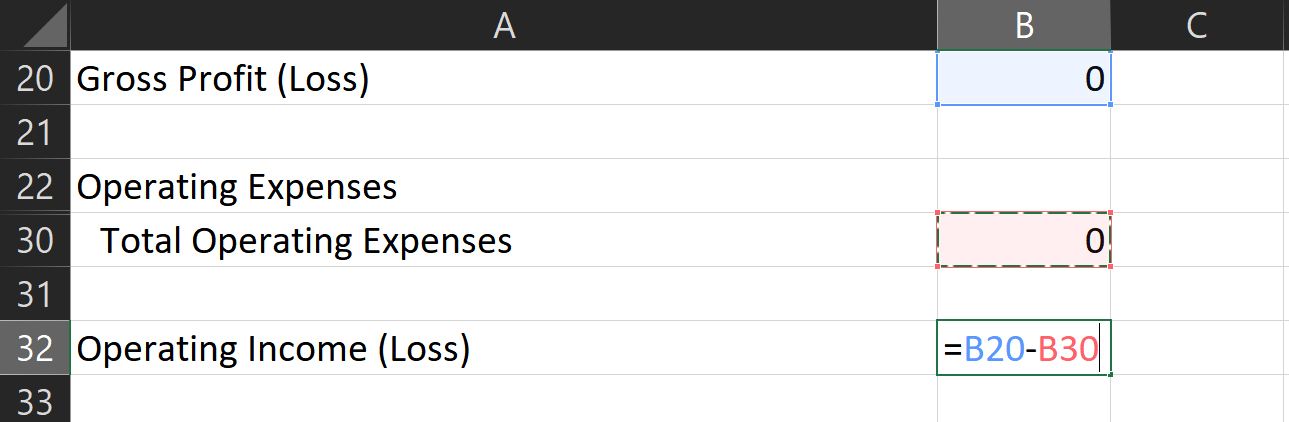
To compute your operating income (loss), use the formula =[Gross Profit (Loss)]-[Total Operating Expenses].
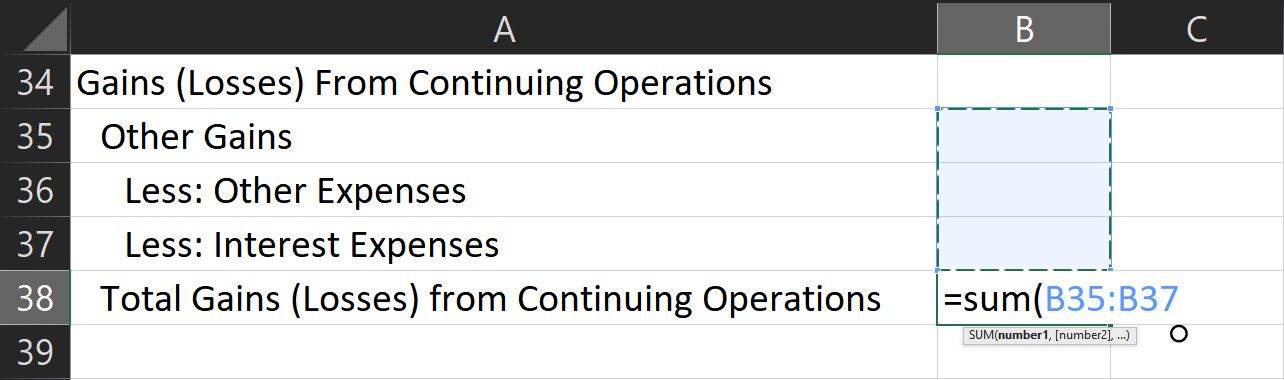
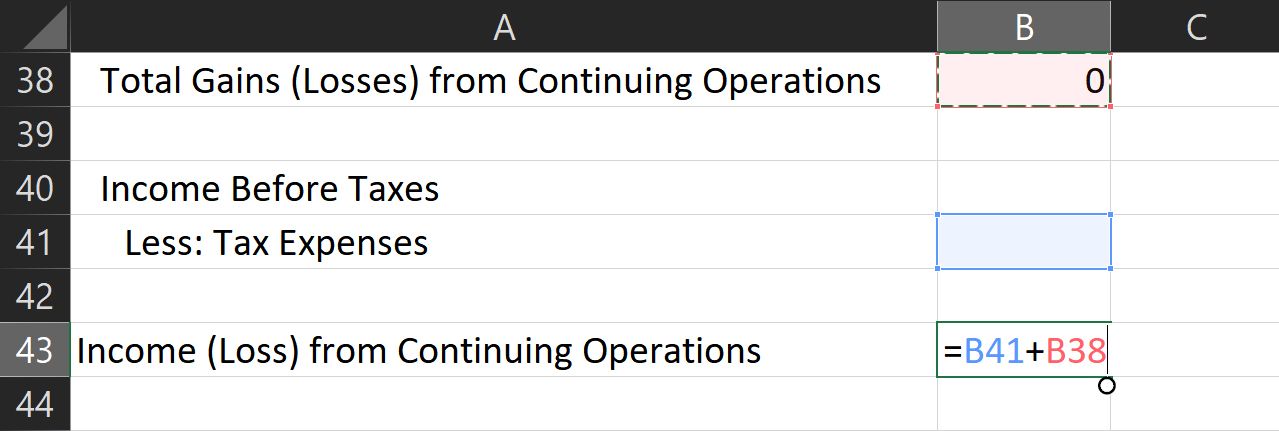
Compute your total gains (losses) from continuing operations by using the sum function. Then once you have that amount, find your income before taxes with this formula: =[Operating Income (Loss)]+[Total Gains (Losses)].
To get your income from continuing operations, add your income before taxes, less: tax expenses value, and operating income.
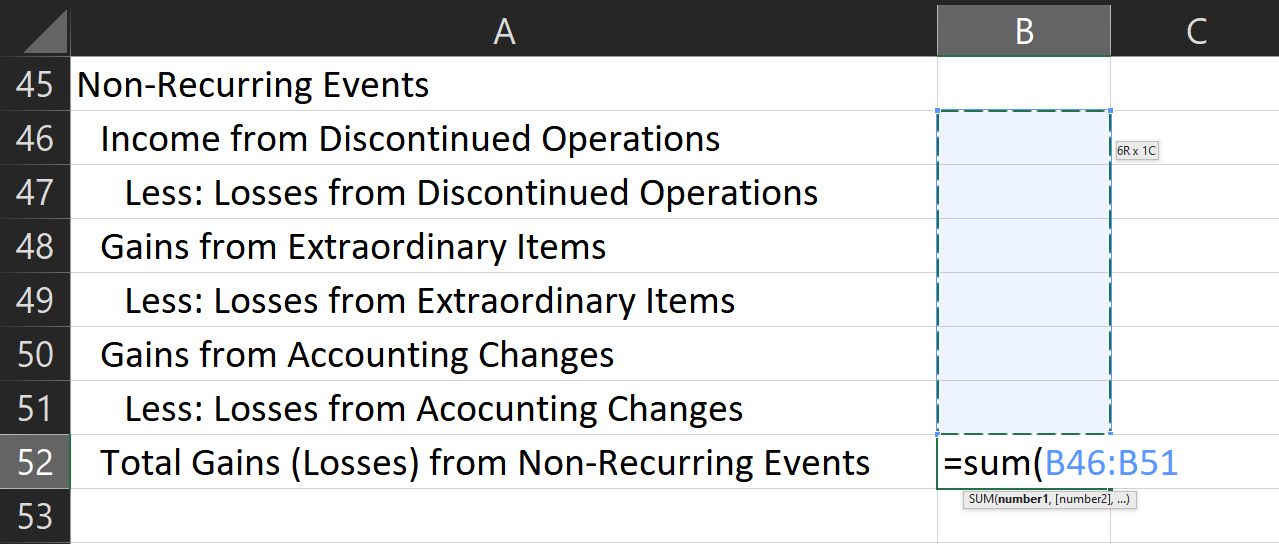
You then need to find the total gains/losses from non-recurring events. Use the SUM function to do this.
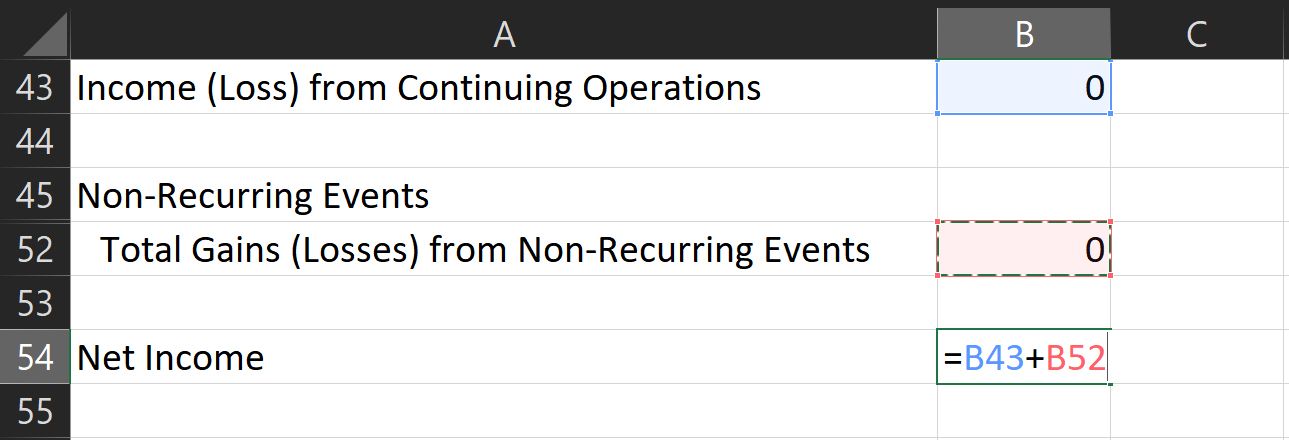
To calculate net profit, add the income from continuing operations and nonrecurring gains or losses.
7. Format Your Document
To make your document easier to read, format it so that negative numbers appear red. Do this so that you can quickly analyze your statement with just a glance.
To do that, select all your data. Then, look for the dropdown menu in the Number section at the Home ribbon.
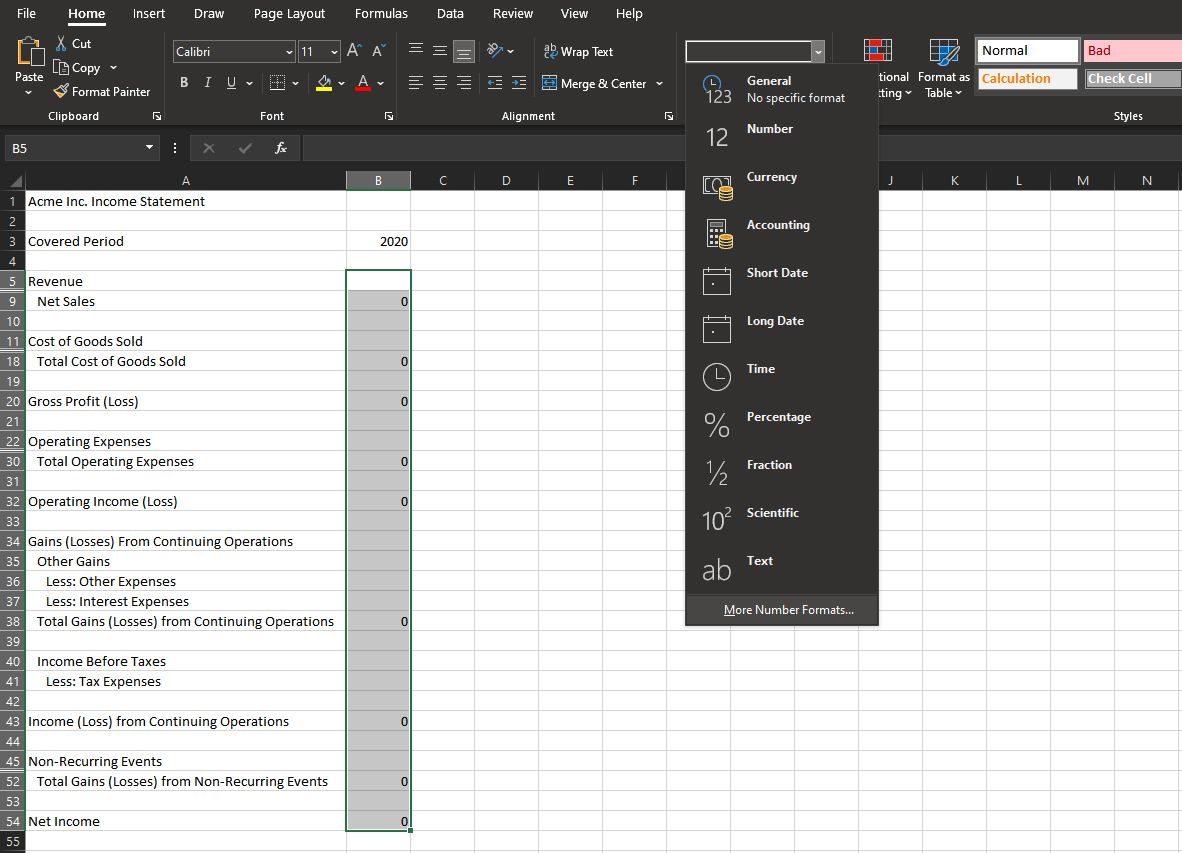
- Choose More number formats…
- You will see a new window titled Format Cells. Look for the Number tab at the top row.
- Click on it, then, under the Category subwindow, choose Currency.
- Find the correct Symbol that represents your currency accurately.
- Afterward, under the Negative numbers: subwindow, select the -$1234.10 with a red font color option.
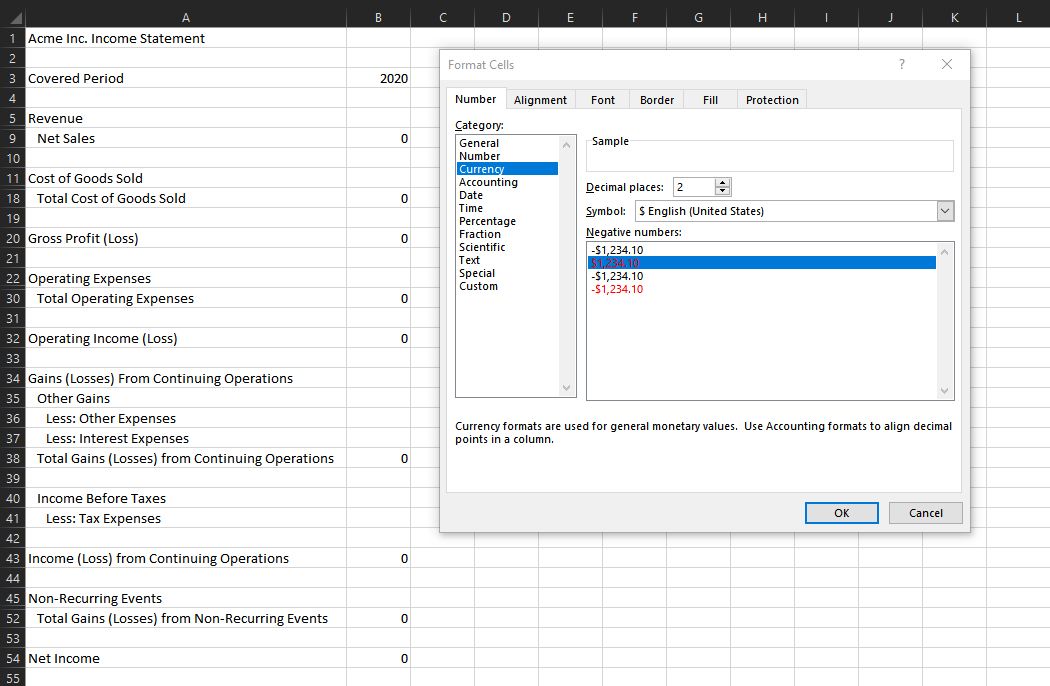
You should then see all negative values in your data, making it easier to find and see.
Also, select each category, subtotal, and total row and assign different colors. This makes it easier to read and gives your income statement a professional look.
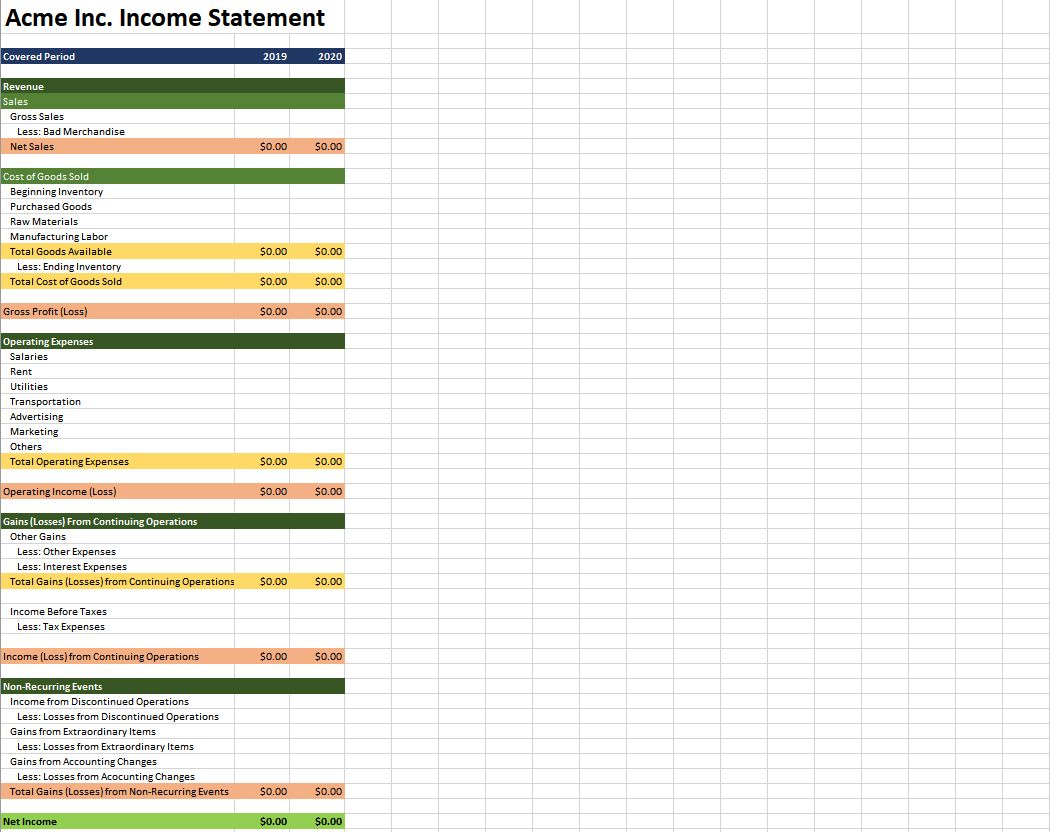
8. Place Your Values
Once you’ve prepared everything, place all the actual values that you’ve prepared. All amounts you enter should be positive unless it’s for a row that’s marked Less:
You can access and save a copy of this income statement sample here.
See How Your Business Performed
Now that you know where you make money and where your expenses are, you can see if you are hitting your goals. Using this document, you can see how efficiently you run your business.
You can also compare this document between two periods. It’s especially helpful if you’re making strategic changes. You’ll see if the changes you made are effective or not.
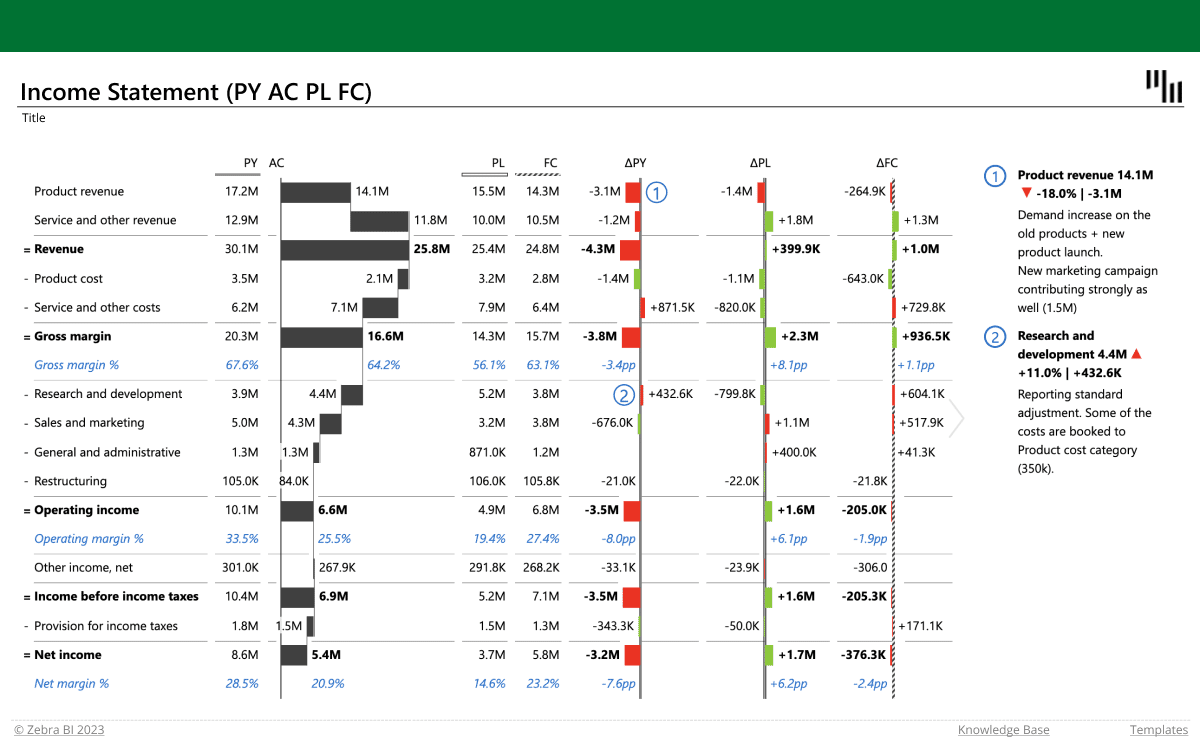
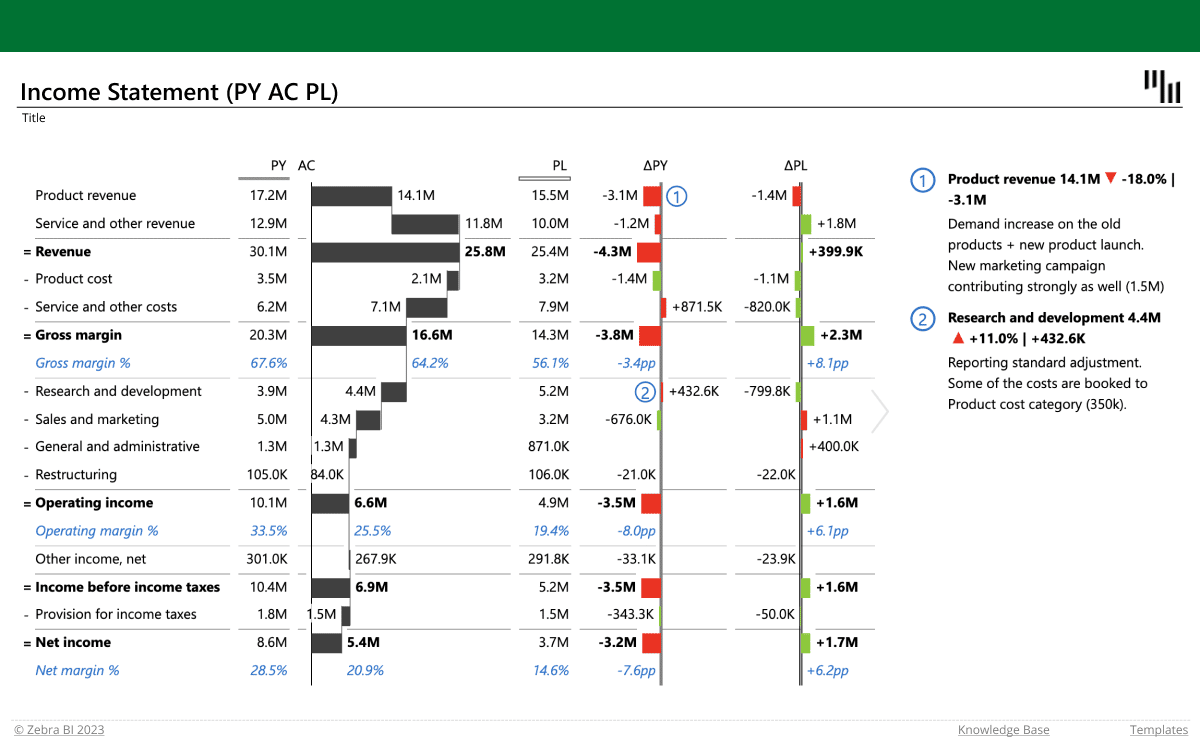
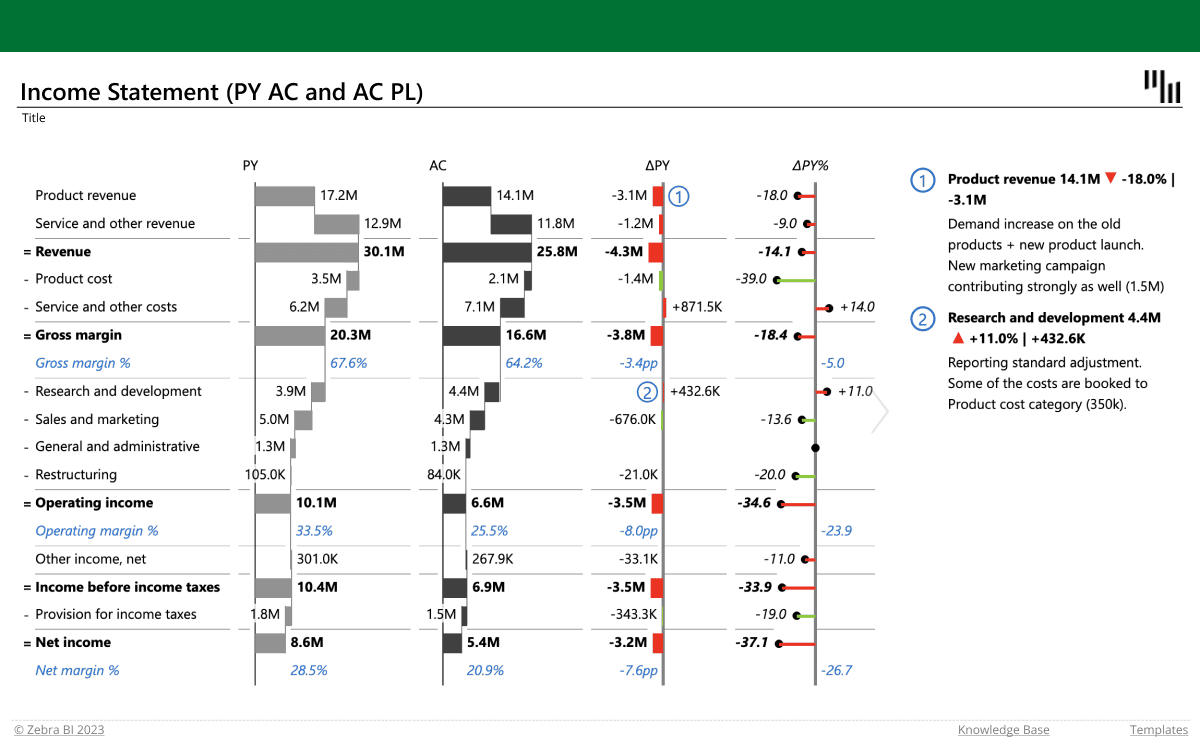
If there is one report that’s a business constant, it’s the income statement (also known as a profit and loss statement). Its core purpose is to show managers and investors the bottom line of a company for a specific period. It is normally delivered as a structured spreadsheet that shows how the top line (revenues) is transformed into the bottom line after taking out expenses.
There is a much better way, however. An income statement tells a very important story about your company and you can tell it in a much more effective way. Instead of relying on just numbers, you can use visual language that makes your story not just much more attractive but also much easier to understand.
A Basic Income Statement
First, let’s take a look at a relatively simple income statement showing business results for two years.
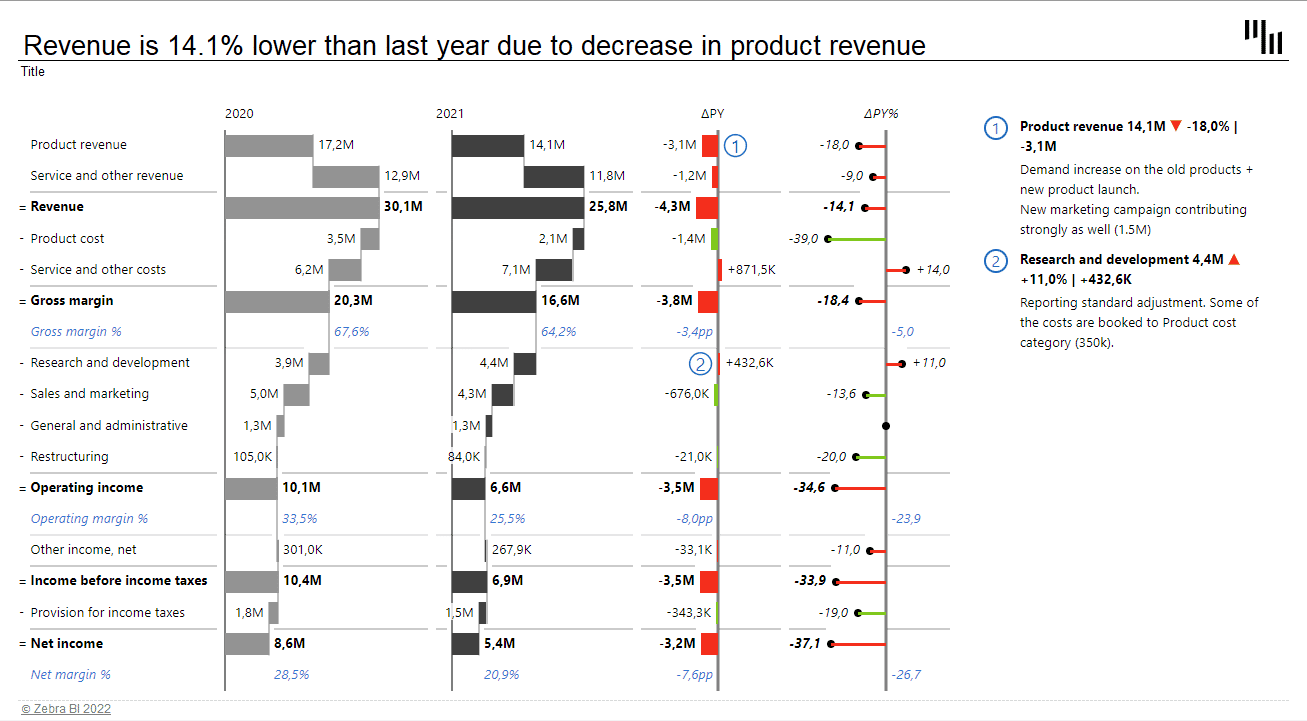
Tip: There are many things you can do to improve the readability of your report. Some are more subtle than others — for example, in the structure waterfall chart, the numbers that have positive contribution are displayed to the right of the bar, while negative contribution values are marked on the left. This is a good practice that clarifies your story without any added visual noise.
The first and second columns of the waterfall charts show the different types of revenue and costs that make up total profit across two different years. The first section of the chart shows revenue sources and growth that contribute to the overall profit, followed by costs, such as product, service, and other operating expenses that reduce the overall profit. Note the «Operating income» which is a subtotal of all other expenses above it. This intermediate calculation improves readability and helps visualize the end result. These subtotals are actually very easy to do in Zebra BI for Office. You only need to right-click on the selected row and select the option ‘Result’ and Zebra BI will do the rest.
When you create a report like this, you use the «structure» waterfall chart. This type of waterfall chart shows the structure of the final profit and contributions of individual items. You could also use the «Variance» chart that puts the focus on actual differences.
The two waterfall charts are complemented by a variance bar chart and a lollipop chart on the right:
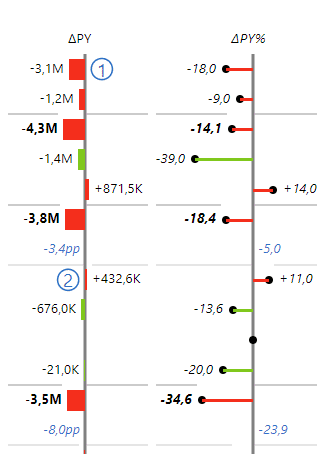
The bar chart displays absolute values and their change. The lollipop chart represents relative growth or decrease in percentages. The important thing about the variance chart is that it is scaled. The length of the chart now corresponds to the actual difference between 2020 and 2021 values.
Tip: Use a waterfall chart instead of a bar chart to display absolute variance. You will be able to visualize not only the values but also how they contribute to the total difference. Like this:
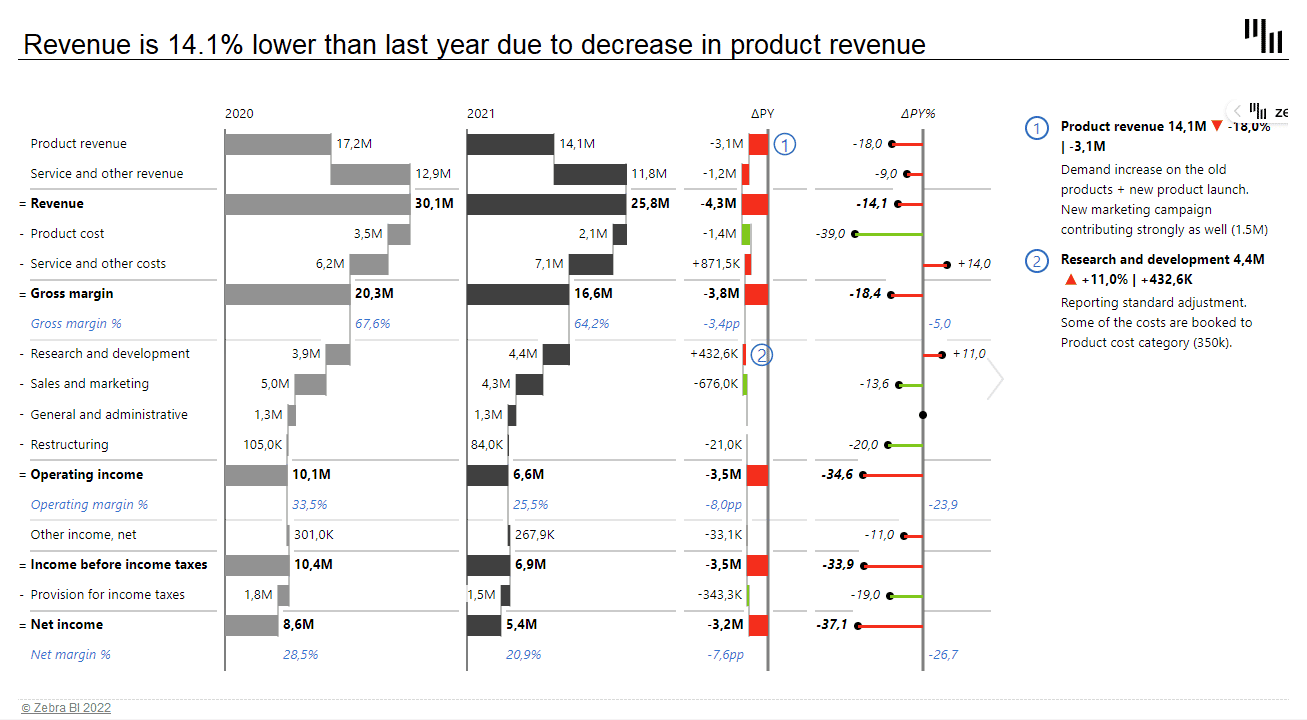
When working with comparisons, you will soon meet the Zebra BI custom calculations. Instead of using negative or positive numbers, you can use the custom calculation Invert to define whether an item is a positive or negative addition to the total. Using this feature you can easily invert KPIs that have a negative contribution despite being a positive value. Simply right-click on the selected KPI and choose Invert. For example, an increase in the cost of research and development is a positive value with a negative impact on your overall profit. Zebra BI will show it in red, despite it being a positive value.
Taking It Up a Notch
In real life, you might want to show data for more than just two years. A typical scenario is a report with the current and past year’s data and plans for the coming year.
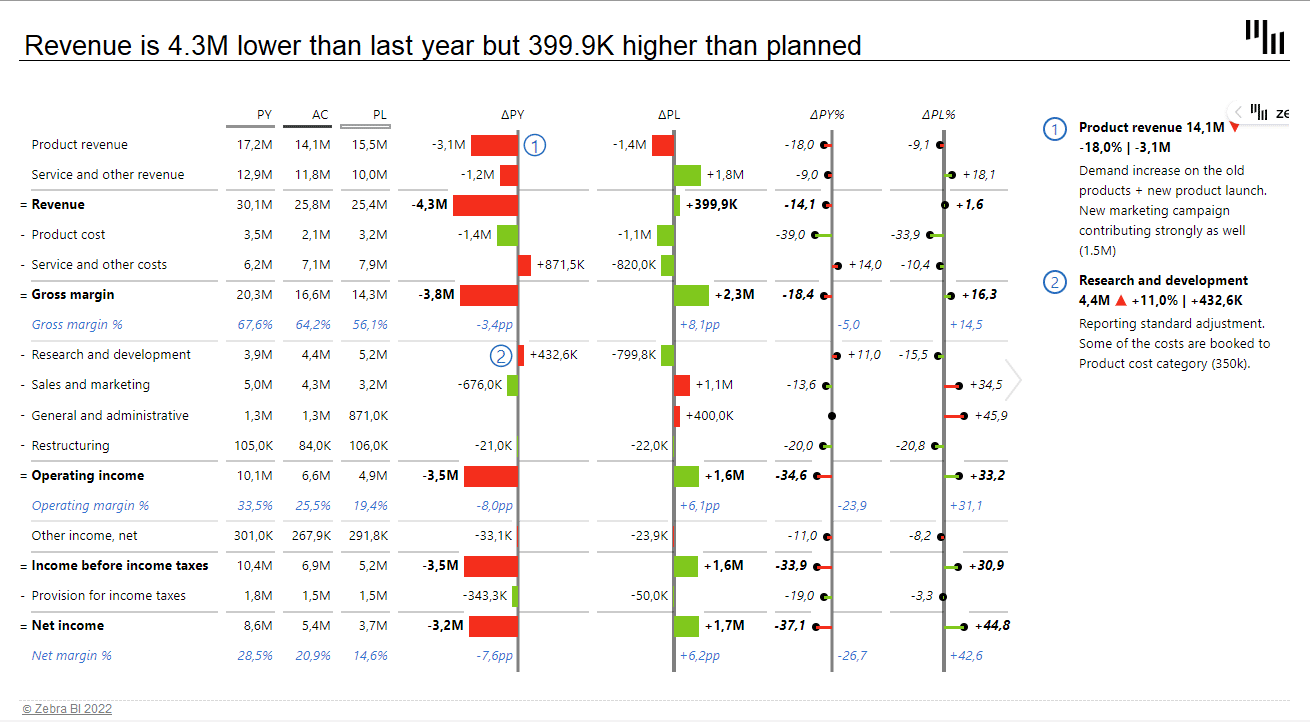
Notice a different approach to designing the report. With three data sets, we are coming up short on space. Since the variance data is much more relevant, we used a table and chart combination. The PY, AC and BU values are displayed in a table, while the more important variance data is visualized with charts.
The bar and a lollipop charts are telling the same story as with the previous template. However, we now have two pairs of them — one pair for showing variance from the past year and the second pair displaying the difference compared to the plan.
The great thing about Zebra BI is that you have complete design freedom. For example, you could change the order of charts or even place data columns between charts.
Tip: When designing a more complex template like this, decide on an order of charts and stick to it. I prefer showing the variance compared to the previous year and then the comparison to the plan. You might want to use a different approach, just make sure to stay consistent. This way, you’ll ensure your income statement always tells a clear story at first glance.
When designing a report like this, make sure that all the charts that visualize the same type of data are scaled. You can see here that bar lengths clearly display the difference between the previous year and the plan. Keep in mind that this type of report is fairly useless if it’s not scaled. Luckily, scaling is one of the strong points of Zebra BI as it happens automatically.
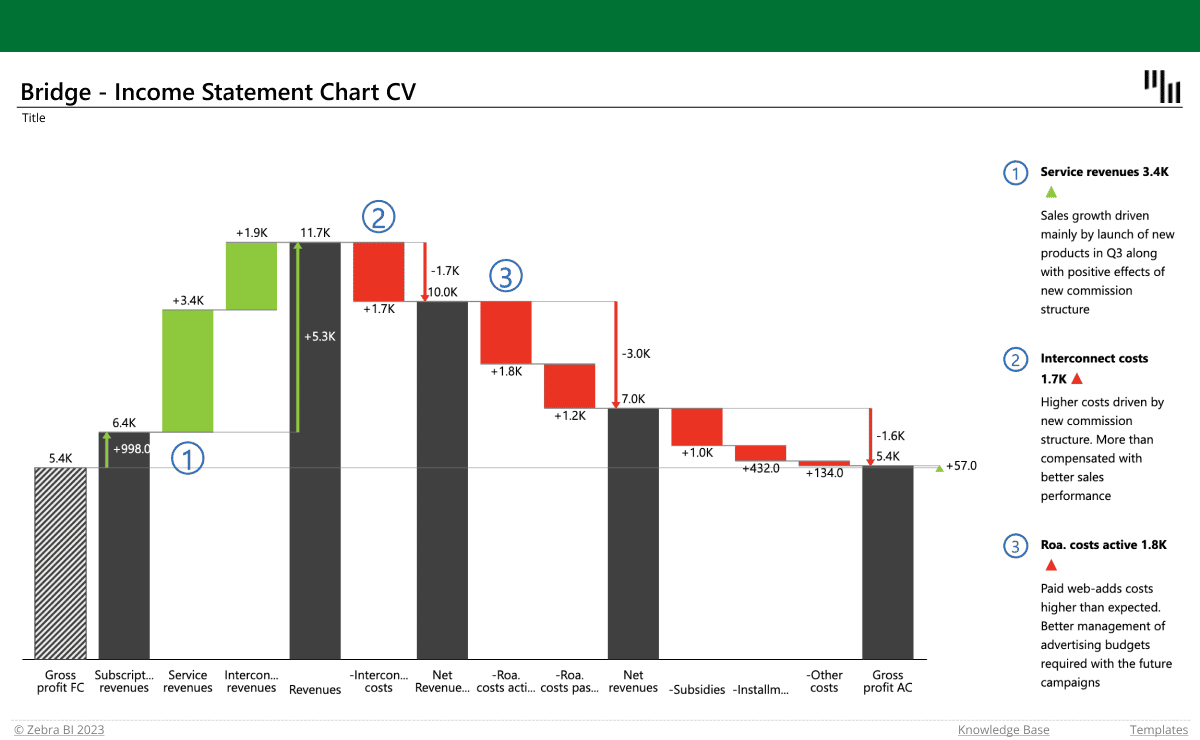
The more the merrier
These two sample income statements were for a single company. But what about if we are create an income statement for a group of companies, subsidiaries, or profit centers? In this case, you might want to show multiple countries or companies on a single page. Take a look at an example:
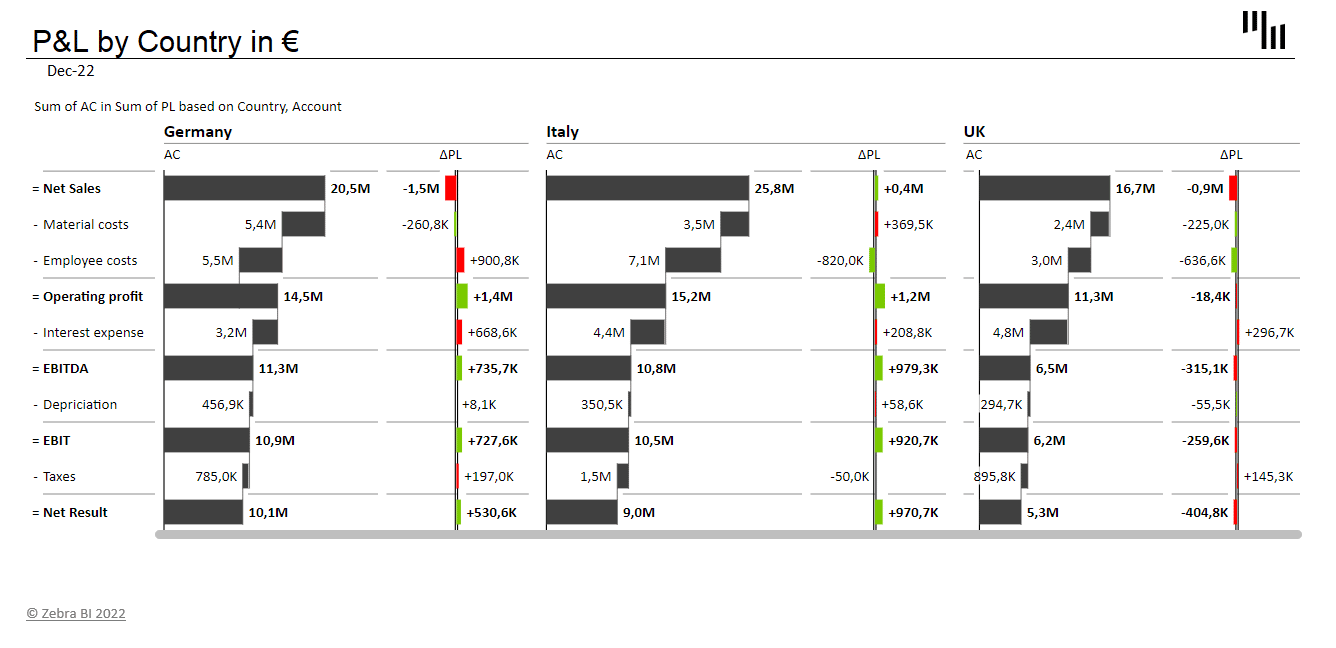
This table contains multiple levels of data — you can see the performance of key metrics for three different countries within one visual. The actual value is represented with a waterfall chart and it shows clearly the net sales, costs, operating profit, EBITDA, and net result. On the right are variance charts showing differences compared to the plan. This is a great way to show the picture of your business on a single page.
Tip: When designing visual reports like this, pay attention to labeling and headings. Clear and understandable headings help you tell the story while comments help you draw attention to significant data points.
All these visualizations comply with the IBCS standards, which ensures that you can easily read this page without losing sight of the overall picture.
Want to create income statements like these?
If you’d like to create the income statements that you see in this article, you can download our free templates:
An income statement is an essential tool for analyzing financial data.


It is one of the documents that you can use to make informed financial decisions. The income statement template in Excel enables you to create one for your financial data.
This blog will discuss how to create an income statement and analyze the data in Excel.
Table of Content:
- What is an Income Statement?
- Types of Income Statements
- Purpose of Using an Income Statement
- Best Graphs to Visualize Income Statement
- How to Analyze Financial Data from Income Statements in Excel?
- Benefits of Using an Income Statement
- Importance of an Income Statement Template in Financial Analysis
- Wrap Up
What is an Income Statement?
An income statement is a financial statement that allows you to analyze your financial data systematically. It contains information about the company’s revenues, expenses, net income, and other key financial indicators.
You can use it to analyze data for a specific period, such as a month, quarter, or year. You can also track your income and expenses and make better financial management decisions.
Businesses and individuals use the income statement to prepare their financial statements. Banks and other financial institutions use it to assess the financial position of their customers. In addition, investors use it to assess the performance of their investments.
Types of Income Statements
-
Classified Income Statement
The classified income statement separates the company’s income and expenses into different categories. It allows for a detailed analysis of the company’s performance.
The categories may include operating income, non-operating income, cost of goods sold, operating expenses, and non-operating expenses.
-
Comparative Income Statement
The comparative income statement shows the company’s income and expenses over two periods. It enables you to compare the company’s performance over time.
-
Condensed Income Statement
The condensed income statement is a simplified version of the classified income statement. It shows the company’s total revenue and expenses without breaking them down.
-
Cash Basis Income Statement
The cash basis income statement shows cash transactions. It does not include any non-cash transactions such as depreciation or amortization.
-
Partial Income Statement
The partial income statement shows certain categories of income and expenses, such as revenues, expenses, and net income. It is used for smaller companies or companies with limited business activity.
Purpose of Using an Income Statement
-
Convey Profitability
The income statement shows how much money the business has made or lost. Stakeholders can understand how the company is performing by looking at the income statement. It can help identify areas where you can cut costs or increase revenue. Thus, the business can become more profitable and lead to long-term success.
-
Decision Making
You can use it to make informed decisions about a business’s operations. For example, if you identify that expenses are higher than revenue. You can look at the income statement to identify where you can make cuts.
-
Financial Strategizing
You can use it to plan for the future and set yourself up for long-term success. By looking at the income statement, you can identify areas where you can focus your efforts. For example, you can see that the revenues are lower than the expenses.
Thus, focus on increasing the revenue. You may focus on marketing efforts, expanding the product line, or targeting a new market.
-
Financial Performance Comparison
You can use an income statement to compare a company’s financial performance from different periods. This comparison can help you to identify areas of strength and weakness and inform future strategies.
Best Graphs to Visualize Income Statement
-
Sankey Chart
The Sankey Chart displays the flow of income from one source to another. It is a great way to visualize a company’s or individual’s income and expenses. The Sankey Chart also helps identify trends and patterns in financial data.
You can use a Sankey Chart as an income statement projection template.
Example 1: Company Income Statement Template
- For example, you have financial data and want to observe how money is moving.
| Income Sources | Income | Spending Sources | Spending | Amount |
| Domestic | Income | Taxes | Federal | 991936 |
| Domestic | Income | Taxes | State | 295067 |
| Domestic | Income | Savings | Stock | 1932447 |
| Regional | Income | Savings | Bonds | 263979 |
| Regional | Income | Savings | Cash | 689532 |
| Regional | Income | Salaries | 1479664 | |
| Regional | Income | Food & Dining | 24448 | |
| Regional | Income | Office | 9409 | |
| Regional | Income | Travel | 8481 | |
| Regional | Income | Fitness | 4694 | |
| Pacific | Income | Health Insurance | 3410 | |
| Pacific | Income | Bills & Utilities | 4918 | |
| Pacific | Income | Other Expenses | 76650 |
- Here is a Sankey Chart for the following company financial data.

Example 2: Personal Income Statement Template
- You can use a Sankey Chart to determine whether you are using your finances on relevant items.
| Income | Budget | Categories | Spending | Amount |
| Salary | Total Income | Federal Taxes | 7126 | |
| Salary | Total Income | State Taxes | 1247 | |
| Salary | Total Income | Local Taxes | 945 | |
| Social Security | Total Income | Spending | Housing | 13497 |
| Dividends | Total Income | Spending | Utilities | 2290 |
| Dividends | Total Income | Spending | Vehicle | 4826 |
| Property | Total Income | Spending | Gas | 2254 |
| Other Income | Total Income | Spending | Food | 1754 |
| Other Income | Total Income | Spending | Eating Out | 495 |
| Salary | Total Income | Spending | Household | 5161 |
| Salary | Total Income | Spending | Insurance | 3260 |
| Salary | Total Income | Spending | Alcohol | 592 |
| Salary | Total Income | Spending | Clothing | 3133 |
| Salary | Total Income | Spending | Entertainment | 414 |
| Salary | Total Income | Spending | Phone | 1587 |
| Salary | Total Income | Saving | 7541 |
- Here is a Sankey Chart for the following company financial data of relevant items.

-
Clustered Bar Chart
A Clustered Bar Chart is a great way to compare different income statement items. It enables you to see how much money you are making or losing. It is a perfect comparison graph for identifying strengths and weaknesses.
Example
| Months | Income | Expenses |
| January | 40134 | 8919 |
| February | 21757 | 10038 |
| March | 26950 | 8595 |
| April | 48140 | 10793 |
| May | 46486 | 9584 |
| June | 40333 | 9042 |
- The visualization will look like as follows:

-
Sentiment Trend Chart
A Sentiment Trend Chart visualizes changes in income statement items over time. You can see how revenue, expenses, or net income changes have impacted the business.

-
Multi-Axis Line Chart
A Multi-Axis Line Chart displays multiple lines with two or more axes. It is useful for visualizing complex data sets with multiple dimensions or variables. You can use it to compare the profitability between periods.
Example
| Months | Orders | Sales | Profits |
| Jan | 756 | 18766 | 18 |
| Feb | 485 | 18788 | 29 |
| Mar | 412 | 18743 | 24 |
| Apr | 607 | 18788 | 22 |
| May | 915 | 16406 | 19 |
| Jun | 413 | 17765 | 22 |
| Jul | 828 | 20532 | 26 |
| Aug | 611 | 20016 | 19 |
| Sep | 683 | 20122 | 18 |
| Oct | 886 | 20125 | 25 |
| Nov | 397 | 23783 | 21 |
| Dec | 408 | 22942 | 21 |
- The visualization will look like as follows:

-
Waterfall Chart
A Waterfall Chart shows the cumulative impact of changes in finances. You can pinpoint sections of the company where you can reduce expenditures and increase income.
Example
| Stacks | Bridges | Amount |
| Sales | Mobiles | 20025 |
| Sales | Tablets | 9746 |
| Sales | PCs | 7095 |
| Service | Mobiles | 9077 |
| Service | Tablets | 6650 |
| Service | PCs | 3959 |
| Total Revenue | Mobiles | 29102 |
| Total Revenue | Tablets | 16400 |
| Total Revenue | PCs | 11100 |
| Cost of Goods Sold | Mobiles | -4630 |
| Cost of Goods Sold | Tablets | -2360 |
| Cost of Goods Sold | PCs | -2650 |
| Marketing | Mobiles | -2150 |
| Marketing | Tablets | -935 |
| Marketing | PCs | -965 |
| Salaries | Mobiles | -3360 |
| Salaries | Tablets | -2340 |
| Salaries | PCs | -1130 |
| Wages | Mobiles | -3510 |
| Wages | Tablets | -2390 |
| Wages | PCs | -930 |
| Operating Cost | Mobiles | -5460 |
| Operating Cost | Tablets | -3700 |
| Operating Cost | PCs | -1240 |
| Taxes | Mobiles | -4180 |
| Taxes | Tablets | -1800 |
| Taxes | PCs | -640 |
| Net Income | Mobiles | 2750 |
| Net Income | Tablets | 3160 |
| Net Income | PCs | 5980 |
- The visualization will look like as follows:

How to Analyze Financial Data from Income Statements in Excel?
Analyzing financial data from an income statement is a straightforward process. First, enter your income and expenses into the income statement template.
You can enter data from other financial statements, such as the balance sheet and cash flow statement.
Once you have entered your data into the template, you can begin to analyze it. You can track changes in your finances over time and project future income and expenses.
ChartExpo enables you to create a perfect income statement using the appropriate graphs. You can also use the template to identify areas for improvement.
Furthermore, it can also help you understand the financial impact of your income and expenses changes.
How to Install ChartExpo in Excel?
- Open your Excel application.
- Open the worksheet and click on the “Insert” menu.
- You’ll see the “My Apps”.
- In the office Add-ins window, click on “Store” and search for ChartExpo on my Apps Store.
- Click on “Add” button to install ChartExpo in your Excel.
ChartExpo charts and graphs are available both in Google Sheets and Microsoft Excel. Please use the following CTA’s to install the tool of your choice and create beautiful visualizations in a few clicks in your favorite tool.

Example
Let’s generate an income statement using the data below.
| Income Sources | Income | Spending Sources | Spending | Amount |
| Domestic | Income | Taxes | Federal | 991936 |
| Domestic | Income | Taxes | State | 295067 |
| Domestic | Income | Savings | Stock | 1932447 |
| Regional | Income | Savings | Bonds | 263979 |
| Regional | Income | Savings | Cash | 689532 |
| Regional | Income | Salaries | 1479664 | |
| Regional | Income | Food & Dining | 24448 | |
| Regional | Income | Office | 9409 | |
| Regional | Income | Travel | 8481 | |
| Regional | Income | Fitness | 4694 | |
| Pacific | Income | Health Insurance | 3410 | |
| Pacific | Income | Bills & Utilities | 4918 | |
| Pacific | Income | Other Expenses | 76650 |
- To get started with ChartExpo, install ChartExpo in Excel.
- Now, click on My Apps from the INSERT menu.

- Choose ChartExpo from My Apps, then click Insert.

- Once ChartExpo is loaded. Click on “Sankey Chart” from the list of charts.

- Click “Create Chart From Selection” button after selecting the data from the sheet, as shown.

- The Sankey Chart will look like as follows.

- If you want to have the title of chart, click on Edit Chart, as shown in the above image.
- To change the title of the chart, click on the pencil icon that is available very next to Chart Header.
- It will open the properties dialog. Under the Text section, you can add a heading in Line 1 and enable the Show Give the appropriate title of your chart and click on Apply button.

- Let’s add the Prefix (e.g. $ Sign) with the numeric values in the chart.
- Click on the highlighted pencil icon. Expand the “Symbols” properties to add the Prefix value (e.g. $ sign).

- To change the node color, click on the pencil icon available with the node. Expand the Node properties and change color from the Node Color property. Click on the Apply button.
- For saving changes click on Save Changes. This will persist the changes.

- Final chart will look like as follow.

Insights
- Domestic sales accounted for most of the company’s income, which amounted to $3.22 million. Pacific sales were the least contributor in income, contributing $84.98 thousand. The total income of the company was $5.78 million. It was divided into separate categories: taxes, savings, and salaries.
- Salaries consumed the largest portion of the income, totaling approximately $1.48 million.
- Of the savings, they stored $1.93 million in stocks, and they invested $263.98 thousand in bonds. The remaining $689.53 thousand was held in cash.
- They spent $1.29 million on taxes. They designated $295.07 thousand to state taxes, and allocated $991.94 thousand to federal taxes.

Benefits of Using an Income Statement
-
Shows the Effectiveness of Financial Strategies
An income statement reveals the effectiveness of the company’s financial strategies. It helps the stakeholders to understand the financial performance of strategies used and make informed decisions.
-
Provides Detailed Financial Information
An income statement provides detailed financial information about the company. It includes information about the company’s revenue, expenses, profits, and losses. It also conveys information about assets and liabilities.
-
Eases Financial Communication to Stakeholders
The income statement helps to ease communication with stakeholders. It provides detailed information about the company’s financial performance. This helps the stakeholders to understand the financial position of the company.
-
Provides Lending Institutions with an Unbiased View of the Company’s Financial Health
It provides detailed information that helps lending institutions evaluate the company’s financial position. This helps them decide whether to lend money to the company or not.
Importance of an Income Statement Template in Financial Analysis
- It helps you track your income and expenses, plan for the future, and make better decisions.
- You can use it to analyze changes in your income and expenses over time. This analysis can help you understand the financial impact of these changes. Thus you can make better decisions about how to manage your finances.
- It helps with preparing financial statements and assessing your financial performance.
- It helps track a company’s or individual’s profitability over a certain period. It also helps to identify areas of improvement or areas of concern in terms of profitability.
- It is used to assess the ability of a company or individual to pay back a loan. It also helps to assess the creditworthiness of a customer.
FAQs:
What is an income statement?
An income statement is a financial statement that records and analyzes the revenue and expenses of the company. It helps with measuring the financial performance of a business. It also helps the stakeholders to make informed decisions.
Does Excel have an income statement template?
Yes, Excel does have an income statement template. The template is designed to provide an easy-to-use format for creating an income statement. It can be customized to fit the specific needs of the user.
What is the template of the income statement?
An income statement template is a spreadsheet that allows you to visualize your income and expenses. You can use it to analyze your financial data in a systematic and organized way.
What is the purpose of using an income statement?
The primary purpose of an income statement is to provide an overview of a company’s financial health. It allows you to see how much the business has earned or lost over a period. In addition, it helps you assess whether the company is making a profit.
Wrap Up
An income statement is an essential part of a business’s financial statement. It provides detailed information about the company’s revenue, expenses, profits, and losses. Using an income statement template in Excel can help you track your income and expenses. Thus, it is an important tool for analyzing financial data.
Using an Excel income statement template, you can quickly analyze your financial data. You can also use it to make better decisions about the company’s future performance. Furthermore, you can gain insights into the profitability of your business and develop strategies for long-term success.
Are you looking for an easy and efficient way to analyze your financial data? An income statement template in Excel is the perfect solution. So, what are you waiting for? Get started today with ChartExpo.
| Posted on August 25, 2021 |
In this article, we will cover the definition of an Income statement, use some examples to understand the format of an income statement. We will define the 7 parts of an income statement. We will create Microsoft’s income statement in Excel. We will also discuss how you can create an income statement for your small business using a free Excel template.
What is an Income Statement?
Let’s start with income statement definition.
An income statement is a financial statement of a company that shows the company’s revenues and expenses during a specific period. It is a representation of the ‘profitability’ of a company.
It is one of the three financial statements of a business or a company. Balance Sheet and Cash Flow Statement are the other two.
Income statement is also called using the following names:
- Profit and Loss Statement (P&L)
- Statement of Profit or Loss
- Revenue Statement
- Statement of Financial Performance
- Earnings Statement
- Statement of Earnings
- Operating Statement
- Statement of Operations
Source: Wikipedia
Video Demo
Income Statement Examples
In order to understand the structure and parts of an income statement, let us take a look at some example income statements from three well-known companies, Microsoft, Apple and Tesla. These are available to download from the companies’ websites.
We will talk about some differences later, but let’s focus on similarities between the statements.
Broadly speaking there are 7 key sections that I could see. I will use Microsoft’s income statement for this illustration.
- Sales or Revenue
- This is the total sales recorded by the company during the period. In this case, Microsoft recorded $16,873 M of Product revenue and $24,833 M of Service and other revenue. Total Revenue was $41,706 M in 3 months ending March 31, 2021.
- This typically represents the sales amount of products and services shipped out to customers during the period. Whether the customers have made the payments to Microsoft is immaterial when it comes to the Income statement. When the cash actually flows into Microsoft will be reflected in a different financial statement (Cash Flow Statement).
- This is called the top line.
- Cost of Sales or Cost of Revenue
- This is the direct cost of producing the goods. This will typically include raw materials, labor, shipping costs and other costs which were needed to build the inventory and deliver the products and services which generated the sales in the previous section.
- In this case, Microsoft spent $4277 M for Product and $8768 M for Service and Other. Totally cost of revenue was $13,045 M
- Also called as Cost of Goods Sold or COGS.
- Gross Marginor Gross Profit
- This is the amount left over from sales after removing the cost of Sales. This is a good indicator of the margin of our products or services. For example, if it costs $150 to make a product that we sell for $160, it is only $10 Gross margin on each product sold. Let’s assume 1000 products sold during the period. Though the top line may look good with $160,000 it will result in only $10,000 in Gross Margin.
- For Microsoft, if we subtract $13,045 M from $41,706 M, we get $28,661 M.
- Operating Expenses
- An expenditure may be a cost or an expense. Previously, we saw about Cost of Sales. Now, we see expenses.
- This represents the expenditure incurred by a company for operating or running the business. This includes salaries, rent and utility bills like electricity and water.
- Common grouping of Operating Expenses are
- Sales & Marketing expenses
- Research & Development (R&D) expenses
- General & Administrative (G&A) expenses
- These are sometimes called SG&A (Sales, General & Administrative) expenses.
- Microsoft spent totally $11613 M as Operating expenses. I am not sure why Microsoft does not show the subtotal on the statement. I summed the three items to arrive at $11,613 M.
- Operating Income or Income from Operations
- This is the net income for the company subtracting Operating expenses from Gross Margin. This represents a true profit margin of a company because it considers all expenses involved in running the business.
- Microsoft’s operating income was $17, 048 M (which is Gross margin $28,661 M – Operating Expenses $11,613 M)
- Other Income/Expense Net
- Apart from the business operations, if there are other income and expenses they are recorded in this section. This section will include income tax payments.
- For example, if a company sells its real estate for a profit, that will be non-operating income. Paying interest on a loan is non-operating expense, while receiving interest on a bank account will be non-operating income. Income Tax payments will be an expense.
- Microsoft has indicated that their total ‘Other income’ is $188 Million. And $1779 M has been estimated as income taxes.
- Net Income
- Net Income represents the total net income of a company, considering both the operating and non-operating incomes and expenditures. It is Operating Income – Other Income/Expense.
- Microsoft’s net inocme is $15,457 M
- If this amount is positive, that would indicate profit. If negative, it will be a loss.
- This is also referred to as the bottom line of a company.
Components or parts of an Income Statement
To summarize, the 7 parts of an Income statement are below.
- Sales/Revenue: Sales generated by company
- Cost of Sales/Cost of Revenue: Cost of producing the goods sold
- Gross Margin = Sales – Cost of Sales
- Operating Expenses: Expenses in operating the business
- Operating Income = Gross Profit – Operating Expenses
- Other Income/Expense Net: Net of non-operating income/expense
- Net Income = Operating Income – Other Income/Expense Net
Note: Earnings per share will appear on the income statement if the corporation’s stock is publicly traded. We will skip that part as we are focused on small businesses which are not traded on the stock market.
Income Statement formulas
As we have seen above, there are three calculated indicators in the Income Statement. Their simple formulas are shown below.
- Gross Margin = Sales – Cost of Sales
- Operating Income = Gross Margin – Operating Expenses
- Net Income = Operating Income – Other Income/Expense Net
Income Statement Format
Though there is an overall structure with certain key elements that are standard as per accounting rules, each company may have slightly different formats,
As we scan through the three statements, a few things to note:
- Name of the statement may vary
- Microsoft calls it Income Statement, while Tesla and Apple call them Consolidated statements of Operations.
- Names of the sections or items may vary
- Microsoft and Tesla call Revenue or Revenues while Apple calls it Net Sales
- Microsoft and Tesla call Cost of Revenue while Apple calls it Cost of Sales
- Terms Profit and Income are used interchangeably. Sales and Revenue mean the same.
- Level of detail provided may vary
- Tesla has more detailed product/service break down compared to Microsoft and Apple. Microsoft, for example, in their Excel version of their statement provide product segment breakdown in a separate sheet. So, companies can provide details separately or within the income statement itself.
- Periods may vary
- Though these three statements are quarterly, companies may also provide annual statements as well. In the statements, typically prior period will be compared. If it is quarterly, comparison with previous quarter and if annual, comparison with previous year.
- Delivery Format may vary
- Microsoft seems to provide an Excel version of their income statements, but I didn’t see the same for Apple and Tesla. They do provide PDF and other formats.
Creating Microsoft’s Income Statement
Creating Microsoft’s income statement as a sample is very easy with our Free template.
Step 1: Define transaction categories and subcategories.
As we have seen earlier, each company may have different levels of details.
In the above screenshot, I have entered the 5 transaction categories (Revenue, Cost of Revenue, Operating Expenses, Other Expenses, Other income) and subcategories within each category. I have mirrored what Microsoft has used in their income statement.
Step 2: (Optional) Customize the terms used.
We will mirror what Microsoft used in its income statement.
Step 3: Enter quarterly transactions
We have to enter the quarterly entries in the Transactions sheet.
![]()
Since the entries are once per quarter, I have entered the quarter beginning date as transaction date. You can enter any date during the quarter.
In the above screenshot, we show the last 2 quarters of entries.
I have entered 12 quarters (from July 1, 2018 to June 31, 2021) to demonstrate the output.
The Income statement is generated automatically.
Quarterly Income Statement
Yearly or Annual Income Statement
Creating Income Statement for your Business
Creating income statement in 4 simple steps
1. Define transaction types and categories that suit your business
In the above, you will see that I have provided some sample sub categories you can choose.
- Granular sub-categories
- WithRevenue and Cost of Revenue, I have included values such as refunds and credits. These are relevant if you would like to get that level of detail in your income statement. I prefer it because it allows more visibility for me as a business owner.
- When it comes to Operating expenses, I have provided more detailed sub-categories like Rent, Utilities, Software, etc. This again will allow me to see how these contribute to the overall profitability of my company.
2. Customize the terms (Optional)
- I would not change much here and will leave the terminology to default. If you are specific about something, please feel free to modify it.
3. Entering transactions
![]()
- I recommend entering more detailed transactions in this table.
- In Microsoft’s case they will have many millions of transactions happening and hence we had to aggregate it. For a small business, if we have thousands of transactions or even a few tens of thousands, we can actually enter them in here as they are.
- For example, in my own personal case, I enter all the orders I have received as individual lines or rows in this table. I could enter Order number in the optional Transactional Notes column for reference. This allows me to troubleshoot or analyze the data in a granular level that I may not be able to, if I enter only one row for all product revenue each quarter.
- For most businesses, the ideal case may be in between the Microsoft example of one row per quarter and my personal example of every single transaction. You could enter one row of Product Revenue for each month. One row of Service Revenue per month, etc.
- There are multiple ways to handle this and the template can handle those easily.
- Add more columns as needed to document information that is relevant
4. Customize Income Statement
Enter the starting and ending dates.
Choose Monthly or Quarterly or Yearly.
Note: If we didn’t enter Monthly transactions, then we have to choose Quarterly or Yearly. Depending on how often you enter data, the aggregations can be made.
Benefits
- All the calculations/math are done automatically
- Flexible (Monthly/Quarterly/Yearly)
- Dynamic – Number of sub categories
- Customize – Change the labels easily
- Enter raw transaction level data.
Downloads
Recommended Templates
For more small business templates, please visit Small Business Excel templates
Specifically, for automated income statements, bank balance tracking, cash flow report, tracking unpaid invoices and bills, please use the Small Business Finance manager (available for Excel and Google sheets).
-

Small Business Finance Manager Excel Template
$49
Rated 5.00 out of 5 based on 15 customer ratings
-
Small Business Finance Manager – Google Sheet Template
$49
Rated 5.00 out of 5 based on 3 customer ratings


References:
Financial Statements: A step-by-step Guide to Understanding and Creating Financial Reports – by Thomas R. Ittelson
Statement Templates
8+ Excel Income Statement Templates
Income Statement Templates are print-ready tools that companies can use to record, present, and analyze the operation of the businesses for a given period, usually one financial year. The income statement is generally a record of income received and expenses incurred over that period. Companies can use the overall results to find the net profit or loss incurred for the period ended at the end of the year. The following are the best excel templates you can use to record the income statement of your enterprise.

Income Statement Template

Details
File Format
- MS Word
- Google Docs
- Google Sheets
- Excel
- Apple Numbers
- Apple Pages
Download
Free Pro Forma Income Statement Excel Template

jaxworks.com
Details
File Format
- XLS
- XLSx
Size: 12 kB
Download
The sheet features a simple design which makes it easy to use. It integrates Excel functions and guides, suits online calculator, and ratio and formulas for financial analysis. It is also suitable for payroll analysis.
Common Small Business Income Statement Excel Template

classnet.wcdsb.ca
Details
File Format
- XLS
- XLSx
Size: 11 kB
Download
The Common Size income statement is a four-section template that you can rely on for an accurate financial analysis. Besides the profit and loss page, you also get a comparative balance sheet, additional ratio, and simple ratio.
> What are the uses of the Income Statement Templates?
Of course, the goal of every business on the market is to make profit, but there must be a mechanism that helps a business to determine whether it is making profits or otherwise. That is where the Profit & Loss Statement comes in.
Therefore, the Income Statement Templates enable the accounting team to determine the total amount of profit plowed back to your company for the given period. It also makes it possible to account for the expenses incurred to operate the company. At the end of the day, the difference between revenues and expenses will determine whether a business has made a profit and loss statement.
Excel Balance Sheet And Income Statement Accounting Template

womensenterprise.ca
Details
File Format
- XLS
- XLSx
Size: 9 kB
Download
This is a two-section file which enables businesses to conduct appropriate accounting to find out whether a company has made profits or incurred losses, and of course, by how much. The sample template is free to download.
> Target audiences for these Templates
New businesses may not have well established accounting team, but they must prepare the income statement at the end of the day. If you are running a business as a sole proprietor, you can still use the sample Excel files to conduct the accounting process. It is important to understand that the market has many small businesses that deal with different franchises. You can also see Financial Statement Templates.
That means Profit and Loss Excel Sheets are quite common among many small businesses. Moreover, bigger companies, like lending institutions and universities, can use the template for accounting. Of course, freelancers, too, can use the sample document to do small accountings.
Simple Projected Income Statement Excel Template

schools.nyc.gov
Details
File Format
- XLS
- XLSx
Size: 2 kB
Download
Contribution Margin Income Statement Excel Template

highered.mheducation.com
Details
File Format
- XLS
- XLSx
Size: 17 kB
Download
Free Budgeted Personal Income Statement Excel Template

andrews.edu
Details
File Format
- XLS
- XLSx
Size: 9 kB
Download
Printable Single-Step Income Statement Excel Template

ghc.instructure.com
Details
File Format
- XLS
- XLSx
Size: 39kB
Download
Blank Monthly Income Statement Excel Template

ggp.com
Details
File Format
- XLS
- XLSx
Size: 5 kB
Download
> What are the benefits of Income Statements?
The income statements can and will help you to understand the health status of your business. The term ‘health status’ in this context means how much worth your business is. The results enable you to determine whether there are changes that you need to make if you must make more profits or you are already making enough profit from the business template.
Income statements can also help you to do what’s known as business forecasting, a technique known to help businesses, an almost accurate guess about the future of their enterprises. You can also see Income Statement Templates in word.
It is important to understand that you won’t have consistent result every financial period, so the figures will vary from time to time. For now, your smart goal should be to see great result, and the only best way to do that is to work hard so that your business can flourish; this will make it easy to lower overheads and make more profits.
More in Statement Templates
| Income Statement Template – 15+ Free Word, Excel, PDF Format … | Income Statement Templates – 15+ Free Word, Excel, PDF … |
| Income Statement Format — 9+ Free Sample, Example, Format Free … | Multi Step Income Statement — 8+ Free Word, PDF, Excel Documents … |
| Income Statement Template — 9+ Free Excel, PDF Documents … | Income Statement Template Excel — 7+ Free Excel Documents … |
| Income Statement Template — 5 Free Excel, PDF Documents … | Pro Forma Excel Template — 6+ Free Excel Documents Download … |