
Время на прочтение
5 мин
Количество просмотров 63K
Excel — это чрезвычайно распространённый инструмент для анализа данных. С ним легко научиться работать, есть он практически на каждом компьютере, а тот, кто его освоил, может с его помощью решать довольно сложные задачи. Python часто считают инструментом, возможности которого практически безграничны, но который освоить сложнее, чем Excel. Автор материала, перевод которого мы сегодня публикуем, хочет рассказать о решении с помощью Python трёх задач, которые обычно решают в Excel. Эта статья представляет собой нечто вроде введения в Python для тех, кто хорошо знает Excel.

Загрузка данных
Начнём с импорта Python-библиотеки pandas и с загрузки в датафреймы данных, которые хранятся на листах sales и states книги Excel. Такие же имена мы дадим и соответствующим датафреймам.
import pandas as pd
sales = pd.read_excel('https://github.com/datagy/mediumdata/raw/master/pythonexcel.xlsx', sheet_name = 'sales')
states = pd.read_excel('https://github.com/datagy/mediumdata/raw/master/pythonexcel.xlsx', sheet_name = 'states')
Теперь воспользуемся методом .head() датафрейма sales для того чтобы вывести элементы, находящиеся в начале датафрейма:
print(sales.head())
Сравним то, что будет выведено, с тем, что можно видеть в Excel.
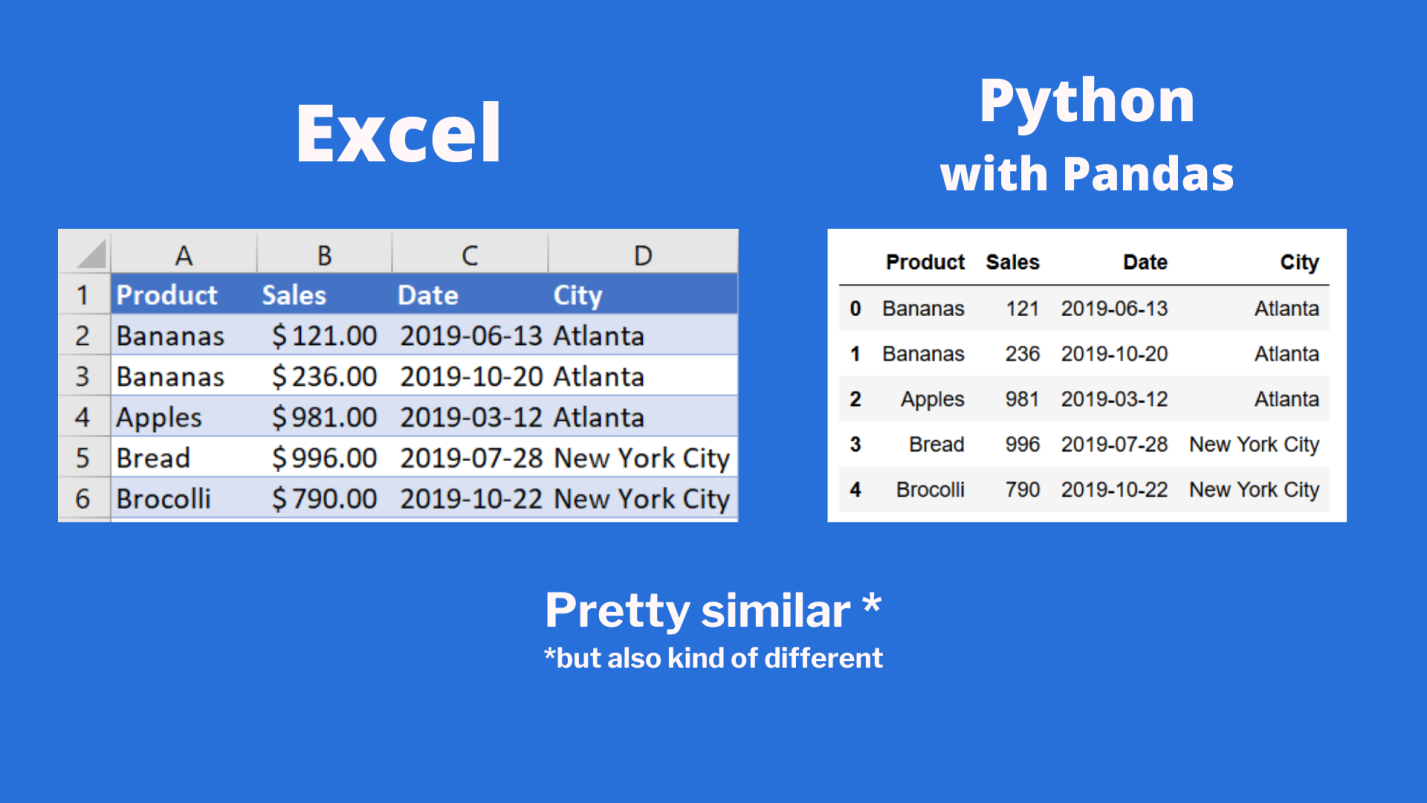
Сравнение внешнего вида данных, выводимых в Excel, с внешним видом данных, выводимых из датафрейма pandas
Тут можно видеть, что результаты визуализации данных из датафрейма очень похожи на то, что можно видеть в Excel. Но тут имеются и некоторые очень важные различия:
- Нумерация строк в Excel начинается с 1, а в pandas номер (индекс) первой строки равняется 0.
- В Excel столбцы имеют буквенные обозначения, начинающиеся с буквы
A, а в pandas названия столбцов соответствуют именам соответствующих переменных.
Продолжим исследование возможностей pandas, позволяющих решать задачи, которые обычно решают в Excel.
Реализация возможностей Excel-функции IF в Python
В Excel существует очень удобная функция IF, которая позволяет, например, записать что-либо в ячейку, основываясь на проверке того, что находится в другой ячейке. Предположим, нужно создать в Excel новый столбец, ячейки которого будут сообщать нам о том, превышают ли 500 значения, записанные в соответствующие ячейки столбца B. В Excel такому столбцу (в нашем случае это столбец E) можно назначить заголовок MoreThan500, записав соответствующий текст в ячейку E1. После этого, в ячейке E2, можно ввести следующее:
=IF([@Sales]>500, "Yes", "No")
Использование функции IF в Excel
Для того чтобы сделать то же самое с использованием pandas, можно воспользоваться списковым включением (list comprehension):
sales['MoreThan500'] = ['Yes' if x > 500 else 'No' for x in sales['Sales']]
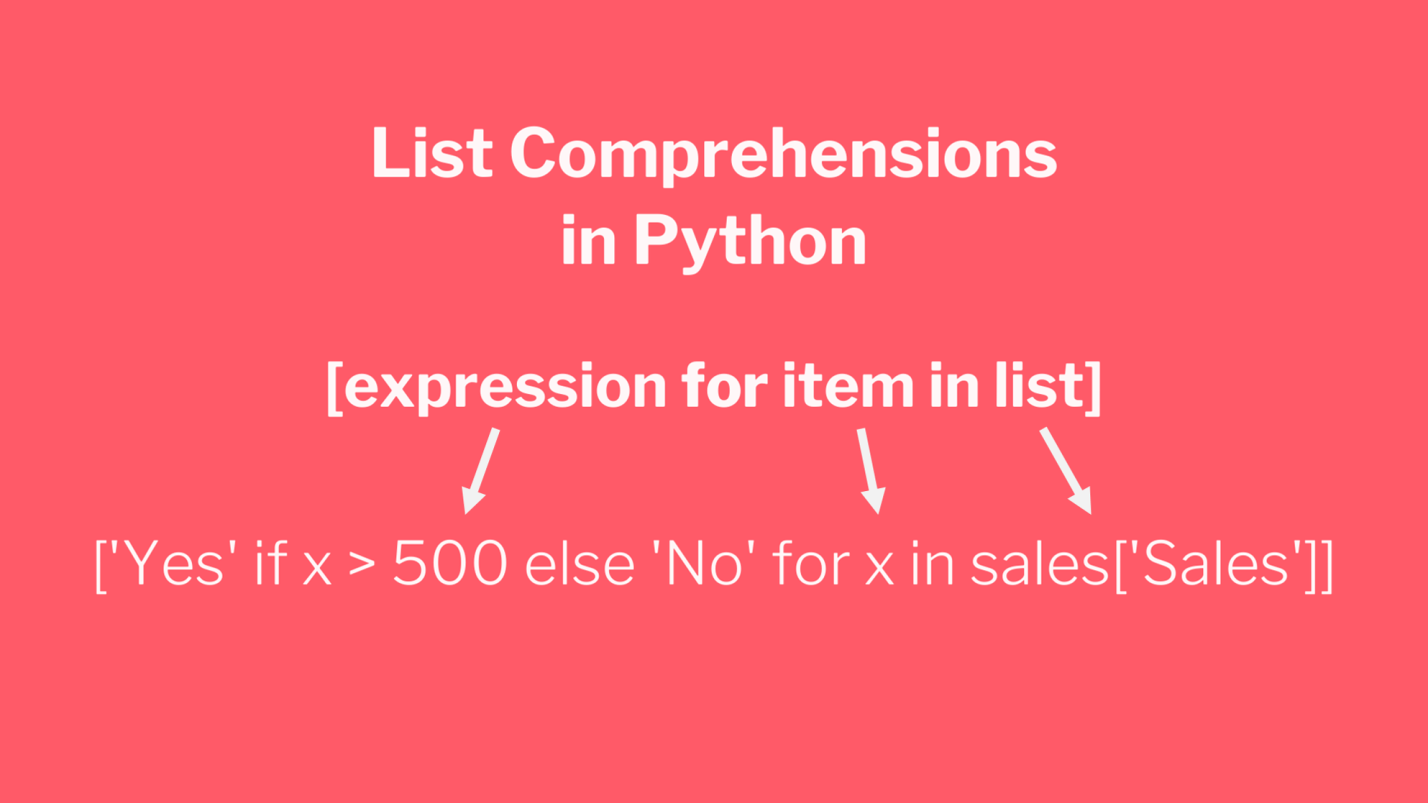
Списковые включения в Python: если текущее значение больше 500 — в список попадает Yes, в противном случае — No
Списковые включения — это отличное средство для решения подобных задач, позволяющее упростить код за счёт уменьшения потребности в сложных конструкциях вида if/else. Ту же задачу можно решить и с помощью if/else, но предложенный подход экономит время и делает код немного чище. Подробности о списковых включениях можно найти здесь.
Реализация возможностей Excel-функции VLOOKUP в Python
В нашем наборе данных, на одном из листов Excel, есть названия городов, а на другом — названия штатов и провинций. Как узнать о том, где именно находится каждый город? Для этого подходит Excel-функция VLOOKUP, с помощью которой можно связать данные двух таблиц. Эта функция работает по принципу левого соединения, когда сохраняется каждая запись из набора данных, находящегося в левой части выражения. Применяя функцию VLOOKUP, мы предлагаем системе выполнить поиск определённого значения в заданном столбце указанного листа, а затем — вернуть значение, которое находится на заданное число столбцов правее найденного значения. Вот как это выглядит:
=VLOOKUP([@City],states,2,false)
Зададим на листе sales заголовок столбца F как State и воспользуемся функцией VLOOKUP для того чтобы заполнить ячейки этого столбца названиями штатов и провинций, в которых расположены города.

Использование функции VLOOKUP в Excel
В Python сделать то же самое можно, воспользовавшись методом merge из pandas. Он принимает два датафрейма и объединяет их. Для решения этой задачи нам понадобится следующий код:
sales = pd.merge(sales, states, how='left', on='City')
Разберём его:
- Первый аргумент метода
merge— это исходный датафрейм. - Второй аргумент — это датафрейм, в котором мы ищем значения.
- Аргумент
howуказывает на то, как именно мы хотим соединить данные. - Аргумент
onуказывает на переменную, по которой нужно выполнить соединение (тут ещё можно использовать аргументыleft_onиright_on, нужные в том случае, если интересующие нас данные в разных датафреймах названы по-разному).
Сводные таблицы
Сводные таблицы (Pivot Tables) — это одна из самых мощных возможностей Excel. Такие таблицы позволяют очень быстро извлекать ценные сведения из больших наборов данных. Создадим в Excel сводную таблицу, выводящую сведения о суммарных продажах по каждому городу.
Создание сводной таблицы в Excel
Как видите, для создания подобной таблицы достаточно перетащить поле City в раздел Rows, а поле Sales — в раздел Values. После этого Excel автоматически выведет суммарные продажи для каждого города.
Для того чтобы создать такую же сводную таблицу в pandas, нужно будет написать следующий код:
sales.pivot_table(index = 'City', values = 'Sales', aggfunc = 'sum')
Разберём его:
- Здесь мы используем метод
sales.pivot_table, сообщая pandas о том, что мы хотим создать сводную таблицу, основанную на датафреймеsales. - Аргумент
indexуказывает на столбец, по которому мы хотим агрегировать данные. - Аргумент
valuesуказывает на то, какие значения мы собираемся агрегировать. - Аргумент
aggfuncзадаёт функцию, которую мы хотим использовать при обработке значений (тут ещё можно воспользоваться функциямиmean,max,minи так далее).
Итоги
Из этого материала вы узнали о том, как импортировать Excel-данные в pandas, о том, как реализовать средствами Python и pandas возможности Excel-функций IF и VLOOKUP, а также о том, как воспроизвести средствами pandas функционал сводных таблиц Excel. Возможно, сейчас вы задаётесь вопросом о том, зачем вам пользоваться pandas, если то же самое можно сделать и в Excel. На этот вопрос нет однозначного ответа. Python позволяет создавать код, который поддаётся тонкой настройке и глубокому исследованию. Такой код можно использовать многократно. Средствами Python можно описывать очень сложные схемы анализа данных. А возможностей Excel, вероятно, достаточно лишь для менее масштабных исследований данных. Если вы до этого момента пользовались только Excel — рекомендую испытать Python и pandas, и узнать о том, что у вас из этого получится.
А какие инструменты вы используете для анализа данных?
Напоминаем, что у нас продолжается конкурс прогнозов, в котором можно выиграть новенький iPhone. Еще есть время ворваться в него, и сделать максимально точный прогноз по злободневным величинам.

Microsoft Excel is one of the most powerful spreadsheet software applications in the world, and it has become critical in all business processes. Companies across the world, both big and small, are using Microsoft Excel to store, organize, analyze, and visualize data.
As a data professional, when you combine Python with Excel, you create a unique data analysis bundle that unlocks the value of the enterprise data.
In this tutorial, we’re going to learn how to read and work with Excel files in Python.
After you finish this tutorial, you’ll understand the following:
- Loading Excel spreadsheets into pandas DataFrames
- Working with an Excel workbook with multiple spreadsheets
- Combining multiple spreadsheets
- Reading Excel files using the
xlrdpackage
In this tutorial, we assume you know the fundamentals of pandas DataFrames. If you aren’t familiar with the pandas library, you might like to try our Pandas and NumPy Fundamentals – Dataquest.
Let’s dive in.
Reading Spreadsheets with Pandas
Technically, multiple packages allow us to work with Excel files in Python. However, in this tutorial, we’ll use pandas and xlrd libraries to interact with Excel workbooks. Essentially, you can think of a pandas DataFrame as a spreadsheet with rows and columns stored in Series objects. Traversability of Series as iterable objects allows us to grab specific data easily. Once we load an Excel workbook into a pandas DataFrame, we can perform any kind of data analysis on the data.
Before we proceed to the next step, let’s first download the following spreadsheet:
Sales Data Excel Workbook — xlsx ver.
The Excel workbook consists of two sheets that contain stationery sales data for 2020 and 2021.
NOTE
Although Excel spreadsheets can contain formula and also support formatting, pandas only imports Excel spreadsheets as flat files, and it doesn’t support spreadsheet formatting.
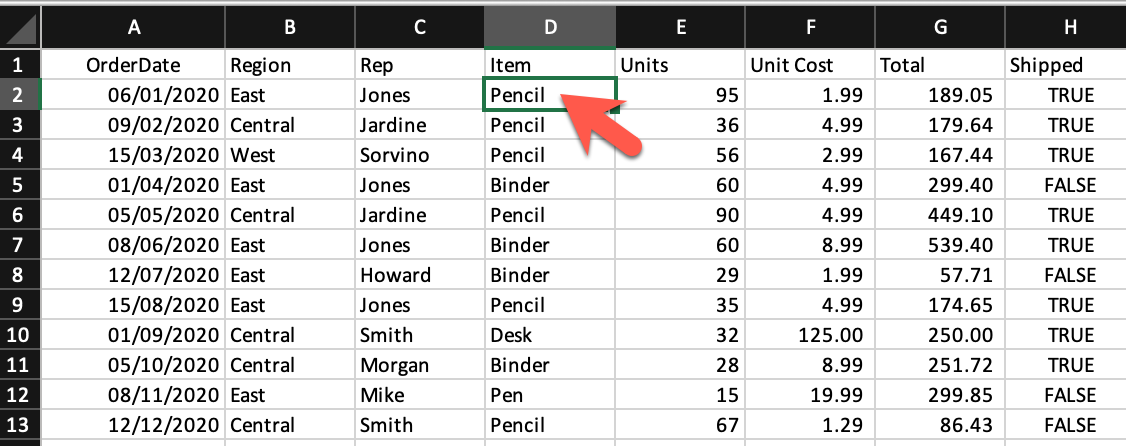
To import the Excel spreadsheet into a pandas DataFrame, first, we need to import the pandas package and then use the read_excel() method:
import pandas as pd
df = pd.read_excel('sales_data.xlsx')

display(df)| OrderDate | Region | Rep | Item | Units | Unit Cost | Total | Shipped | |
|---|---|---|---|---|---|---|---|---|
| 0 | 2020-01-06 | East | Jones | Pencil | 95 | 1.99 | 189.05 | True |
| 1 | 2020-02-09 | Central | Jardine | Pencil | 36 | 4.99 | 179.64 | True |
| 2 | 2020-03-15 | West | Sorvino | Pencil | 56 | 2.99 | 167.44 | True |
| 3 | 2020-04-01 | East | Jones | Binder | 60 | 4.99 | 299.40 | False |
| 4 | 2020-05-05 | Central | Jardine | Pencil | 90 | 4.99 | 449.10 | True |
| 5 | 2020-06-08 | East | Jones | Binder | 60 | 8.99 | 539.40 | True |
| 6 | 2020-07-12 | East | Howard | Binder | 29 | 1.99 | 57.71 | False |
| 7 | 2020-08-15 | East | Jones | Pencil | 35 | 4.99 | 174.65 | True |
| 8 | 2020-09-01 | Central | Smith | Desk | 32 | 125.00 | 250.00 | True |
| 9 | 2020-10-05 | Central | Morgan | Binder | 28 | 8.99 | 251.72 | True |
| 10 | 2020-11-08 | East | Mike | Pen | 15 | 19.99 | 299.85 | False |
| 11 | 2020-12-12 | Central | Smith | Pencil | 67 | 1.29 | 86.43 | False |
If you want to load only a limited number of rows into the DataFrame, you can specify the number of rows using the nrows argument:
df = pd.read_excel('sales_data.xlsx', nrows=5)
display(df)| OrderDate | Region | Rep | Item | Units | Unit Cost | Total | Shipped | |
|---|---|---|---|---|---|---|---|---|
| 0 | 2020-01-06 | East | Jones | Pencil | 95 | 1.99 | 189.05 | True |
| 1 | 2020-02-09 | Central | Jardine | Pencil | 36 | 4.99 | 179.64 | True |
| 2 | 2020-03-15 | West | Sorvino | Pencil | 56 | 2.99 | 167.44 | True |
| 3 | 2020-04-01 | East | Jones | Binder | 60 | 4.99 | 299.40 | False |
| 4 | 2020-05-05 | Central | Jardine | Pencil | 90 | 4.99 | 449.10 | True |
Skipping a specific number of rows from the begining of a spreadsheet or skipping over a list of particular rows is available through the skiprows argument, as follows:
df = pd.read_excel('sales_data.xlsx', skiprows=range(5))
display(df)| 2020-05-05 00:00:00 | Central | Jardine | Pencil | 90 | 4.99 | 449.1 | True | |
|---|---|---|---|---|---|---|---|---|
| 0 | 2020-06-08 | East | Jones | Binder | 60 | 8.99 | 539.40 | True |
| 1 | 2020-07-12 | East | Howard | Binder | 29 | 1.99 | 57.71 | False |
| 2 | 2020-08-15 | East | Jones | Pencil | 35 | 4.99 | 174.65 | True |
| 3 | 2020-09-01 | Central | Smith | Desk | 32 | 125.00 | 250.00 | True |
| 4 | 2020-10-05 | Central | Morgan | Binder | 28 | 8.99 | 251.72 | True |
| 5 | 2020-11-08 | East | Mike | Pen | 15 | 19.99 | 299.85 | False |
| 6 | 2020-12-12 | Central | Smith | Pencil | 67 | 1.29 | 86.43 | False |
The code above skips the first five rows and returns the rest of the data. Instead, the following code returns all the rows except for those with the mentioned indices:
df = pd.read_excel('sales_data.xlsx', skiprows=[1, 4,7,10])
display(df)| OrderDate | Region | Rep | Item | Units | Unit Cost | Total | Shipped | |
|---|---|---|---|---|---|---|---|---|
| 0 | 2020-02-09 | Central | Jardine | Pencil | 36 | 4.99 | 179.64 | True |
| 1 | 2020-03-15 | West | Sorvino | Pencil | 56 | 2.99 | 167.44 | True |
| 2 | 2020-05-05 | Central | Jardine | Pencil | 90 | 4.99 | 449.10 | True |
| 3 | 2020-06-08 | East | Jones | Binder | 60 | 8.99 | 539.40 | True |
| 4 | 2020-08-15 | East | Jones | Pencil | 35 | 4.99 | 174.65 | True |
| 5 | 2020-09-01 | Central | Smith | Desk | 32 | 125.00 | 250.00 | True |
| 6 | 2020-11-08 | East | Mike | Pen | 15 | 19.99 | 299.85 | False |
| 7 | 2020-12-12 | Central | Smith | Pencil | 67 | 1.29 | 86.43 | False |
Another useful argument is usecols, which allows us to select spreadsheet columns with their letters, names, or positional numbers. Let’s see how it works:
df = pd.read_excel('sales_data.xlsx', usecols='A:C,G')
display(df)| OrderDate | Region | Rep | Total | |
|---|---|---|---|---|
| 0 | 2020-01-06 | East | Jones | 189.05 |
| 1 | 2020-02-09 | Central | Jardine | 179.64 |
| 2 | 2020-03-15 | West | Sorvino | 167.44 |
| 3 | 2020-04-01 | East | Jones | 299.40 |
| 4 | 2020-05-05 | Central | Jardine | 449.10 |
| 5 | 2020-06-08 | East | Jones | 539.40 |
| 6 | 2020-07-12 | East | Howard | 57.71 |
| 7 | 2020-08-15 | East | Jones | 174.65 |
| 8 | 2020-09-01 | Central | Smith | 250.00 |
| 9 | 2020-10-05 | Central | Morgan | 251.72 |
| 10 | 2020-11-08 | East | Mike | 299.85 |
| 11 | 2020-12-12 | Central | Smith | 86.43 |
In the code above, the string assigned to the usecols argument contains a range of columns with : plus column G separated by a comma. Also, we’re able to provide a list of column names and assign it to the usecols argument, as follows:
df = pd.read_excel('sales_data.xlsx', usecols=['OrderDate', 'Region', 'Rep', 'Total'])
display(df)| OrderDate | Region | Rep | Total | |
|---|---|---|---|---|
| 0 | 2020-01-06 | East | Jones | 189.05 |
| 1 | 2020-02-09 | Central | Jardine | 179.64 |
| 2 | 2020-03-15 | West | Sorvino | 167.44 |
| 3 | 2020-04-01 | East | Jones | 299.40 |
| 4 | 2020-05-05 | Central | Jardine | 449.10 |
| 5 | 2020-06-08 | East | Jones | 539.40 |
| 6 | 2020-07-12 | East | Howard | 57.71 |
| 7 | 2020-08-15 | East | Jones | 174.65 |
| 8 | 2020-09-01 | Central | Smith | 250.00 |
| 9 | 2020-10-05 | Central | Morgan | 251.72 |
| 10 | 2020-11-08 | East | Mike | 299.85 |
| 11 | 2020-12-12 | Central | Smith | 86.43 |
The usecols argument accepts a list of column numbers, too. The following code shows how we can pick up specific columns using their indices:
df = pd.read_excel('sales_data.xlsx', usecols=[0, 1, 2, 6])
display(df)| OrderDate | Region | Rep | Total | |
|---|---|---|---|---|
| 0 | 2020-01-06 | East | Jones | 189.05 |
| 1 | 2020-02-09 | Central | Jardine | 179.64 |
| 2 | 2020-03-15 | West | Sorvino | 167.44 |
| 3 | 2020-04-01 | East | Jones | 299.40 |
| 4 | 2020-05-05 | Central | Jardine | 449.10 |
| 5 | 2020-06-08 | East | Jones | 539.40 |
| 6 | 2020-07-12 | East | Howard | 57.71 |
| 7 | 2020-08-15 | East | Jones | 174.65 |
| 8 | 2020-09-01 | Central | Smith | 250.00 |
| 9 | 2020-10-05 | Central | Morgan | 251.72 |
| 10 | 2020-11-08 | East | Mike | 299.85 |
| 11 | 2020-12-12 | Central | Smith | 86.43 |
Working with Multiple Spreadsheets
Excel files or workbooks usually contain more than one spreadsheet. The pandas library allows us to load data from a specific sheet or combine multiple spreadsheets into a single DataFrame. In this section, we’ll explore how to use these valuable capabilities.
By default, the read_excel() method reads the first Excel sheet with the index 0. However, we can choose the other sheets by assigning a particular sheet name, sheet index, or even a list of sheet names or indices to the sheet_name argument. Let’s try it:
df = pd.read_excel('sales_data.xlsx', sheet_name='2021')
display(df)| OrderDate | Region | Rep | Item | Units | Unit Cost | Total | Shipped | |
|---|---|---|---|---|---|---|---|---|
| 0 | 2021-01-15 | Central | Gill | Binder | 46 | 8.99 | 413.54 | True |
| 1 | 2021-02-01 | Central | Smith | Binder | 87 | 15.00 | 1305.00 | True |
| 2 | 2021-03-07 | West | Sorvino | Binder | 27 | 19.99 | 139.93 | True |
| 3 | 2021-04-10 | Central | Andrews | Pencil | 66 | 1.99 | 131.34 | False |
| 4 | 2021-05-14 | Central | Gill | Pencil | 53 | 1.29 | 68.37 | False |
| 5 | 2021-06-17 | Central | Tom | Desk | 15 | 125.00 | 625.00 | True |
| 6 | 2021-07-04 | East | Jones | Pen Set | 62 | 4.99 | 309.38 | True |
| 7 | 2021-08-07 | Central | Tom | Pen Set | 42 | 23.95 | 1005.90 | True |
| 8 | 2021-09-10 | Central | Gill | Pencil | 47 | 1.29 | 9.03 | True |
| 9 | 2021-10-14 | West | Thompson | Binder | 57 | 19.99 | 1139.43 | False |
| 10 | 2021-11-17 | Central | Jardine | Binder | 11 | 4.99 | 54.89 | False |
| 11 | 2021-12-04 | Central | Jardine | Binder | 94 | 19.99 | 1879.06 | False |
The code above reads the second spreadsheet in the workbook, whose name is 2021. As mentioned before, we also can assign a sheet position number (zero-indexed) to the sheet_name argument. Let’s see how it works:
df = pd.read_excel('sales_data.xlsx', sheet_name=1)
display(df)| OrderDate | Region | Rep | Item | Units | Unit Cost | Total | Shipped | |
|---|---|---|---|---|---|---|---|---|
| 0 | 2021-01-15 | Central | Gill | Binder | 46 | 8.99 | 413.54 | True |
| 1 | 2021-02-01 | Central | Smith | Binder | 87 | 15.00 | 1305.00 | True |
| 2 | 2021-03-07 | West | Sorvino | Binder | 27 | 19.99 | 139.93 | True |
| 3 | 2021-04-10 | Central | Andrews | Pencil | 66 | 1.99 | 131.34 | False |
| 4 | 2021-05-14 | Central | Gill | Pencil | 53 | 1.29 | 68.37 | False |
| 5 | 2021-06-17 | Central | Tom | Desk | 15 | 125.00 | 625.00 | True |
| 6 | 2021-07-04 | East | Jones | Pen Set | 62 | 4.99 | 309.38 | True |
| 7 | 2021-08-07 | Central | Tom | Pen Set | 42 | 23.95 | 1005.90 | True |
| 8 | 2021-09-10 | Central | Gill | Pencil | 47 | 1.29 | 9.03 | True |
| 9 | 2021-10-14 | West | Thompson | Binder | 57 | 19.99 | 1139.43 | False |
| 10 | 2021-11-17 | Central | Jardine | Binder | 11 | 4.99 | 54.89 | False |
| 11 | 2021-12-04 | Central | Jardine | Binder | 94 | 19.99 | 1879.06 | False |
As you can see, both statements take in either the actual sheet name or sheet index to return the same result.
Sometimes, we want to import all the spreadsheets stored in an Excel file into pandas DataFrames simultaneously. The good news is that the read_excel() method provides this feature for us. In order to do this, we can assign a list of sheet names or their indices to the sheet_name argument. But there is a much easier way to do the same: to assign None to the sheet_name argument. Let’s try it:
all_sheets = pd.read_excel('sales_data.xlsx', sheet_name=None)Before exploring the data stored in the all_sheets variable, let’s check its data type:
type(all_sheets)dictAs you can see, the variable is a dictionary. Now, let’s reveal what is stored in this dictionary:
for key, value in all_sheets.items():
    print(key, type(value))
2020 <class 'pandas.core.frame.DataFrame'>
2021 <class 'pandas.core.frame.DataFrame'>The code above shows that the dictionary’s keys are the Excel workbook sheet names, and its values are pandas DataFrames for each spreadsheet. To print out the content of the dictionary, we can use the following code:
for key, value in all_sheets.items():
    print(key)
display(value)2020| OrderDate | Region | Rep | Item | Units | Unit Cost | Total | Shipped | |
|---|---|---|---|---|---|---|---|---|
| 0 | 2020-01-06 | East | Jones | Pencil | 95 | 1.99 | 189.05 | True |
| 1 | 2020-02-09 | Central | Jardine | Pencil | 36 | 4.99 | 179.64 | True |
| 2 | 2020-03-15 | West | Sorvino | Pencil | 56 | 2.99 | 167.44 | True |
| 3 | 2020-04-01 | East | Jones | Binder | 60 | 4.99 | 299.40 | False |
| 4 | 2020-05-05 | Central | Jardine | Pencil | 90 | 4.99 | 449.10 | True |
| 5 | 2020-06-08 | East | Jones | Binder | 60 | 8.99 | 539.40 | True |
| 6 | 2020-07-12 | East | Howard | Binder | 29 | 1.99 | 57.71 | False |
| 7 | 2020-08-15 | East | Jones | Pencil | 35 | 4.99 | 174.65 | True |
| 8 | 2020-09-01 | Central | Smith | Desk | 32 | 125.00 | 250.00 | True |
| 9 | 2020-10-05 | Central | Morgan | Binder | 28 | 8.99 | 251.72 | True |
| 10 | 2020-11-08 | East | Mike | Pen | 15 | 19.99 | 299.85 | False |
| 11 | 2020-12-12 | Central | Smith | Pencil | 67 | 1.29 | 86.43 | False |
2021| OrderDate | Region | Rep | Item | Units | Unit Cost | Total | Shipped | |
|---|---|---|---|---|---|---|---|---|
| 0 | 2021-01-15 | Central | Gill | Binder | 46 | 8.99 | 413.54 | True |
| 1 | 2021-02-01 | Central | Smith | Binder | 87 | 15.00 | 1305.00 | True |
| 2 | 2021-03-07 | West | Sorvino | Binder | 27 | 19.99 | 139.93 | True |
| 3 | 2021-04-10 | Central | Andrews | Pencil | 66 | 1.99 | 131.34 | False |
| 4 | 2021-05-14 | Central | Gill | Pencil | 53 | 1.29 | 68.37 | False |
| 5 | 2021-06-17 | Central | Tom | Desk | 15 | 125.00 | 625.00 | True |
| 6 | 2021-07-04 | East | Jones | Pen Set | 62 | 4.99 | 309.38 | True |
| 7 | 2021-08-07 | Central | Tom | Pen Set | 42 | 23.95 | 1005.90 | True |
| 8 | 2021-09-10 | Central | Gill | Pencil | 47 | 1.29 | 9.03 | True |
| 9 | 2021-10-14 | West | Thompson | Binder | 57 | 19.99 | 1139.43 | False |
| 10 | 2021-11-17 | Central | Jardine | Binder | 11 | 4.99 | 54.89 | False |
| 11 | 2021-12-04 | Central | Jardine | Binder | 94 | 19.99 | 1879.06 | False |
Combining Multiple Excel Spreadsheets into a Single Pandas DataFrame
Having one DataFrame per sheet allows us to have different columns or content in different sheets.
But what if we prefer to store all the spreadsheets’ data in a single DataFrame? In this tutorial, the workbook spreadsheets have the same columns, so we can combine them with the concat() method of pandas.
If you run the code below, you’ll see that the two DataFrames stored in the dictionary are concatenated:
combined_df = pd.concat(all_sheets.values(), ignore_index=True)
display(combined_df)| OrderDate | Region | Rep | Item | Units | Unit Cost | Total | Shipped | |
|---|---|---|---|---|---|---|---|---|
| 0 | 2020-01-06 | East | Jones | Pencil | 95 | 1.99 | 189.05 | True |
| 1 | 2020-02-09 | Central | Jardine | Pencil | 36 | 4.99 | 179.64 | True |
| 2 | 2020-03-15 | West | Sorvino | Pencil | 56 | 2.99 | 167.44 | True |
| 3 | 2020-04-01 | East | Jones | Binder | 60 | 4.99 | 299.40 | False |
| 4 | 2020-05-05 | Central | Jardine | Pencil | 90 | 4.99 | 449.10 | True |
| 5 | 2020-06-08 | East | Jones | Binder | 60 | 8.99 | 539.40 | True |
| 6 | 2020-07-12 | East | Howard | Binder | 29 | 1.99 | 57.71 | False |
| 7 | 2020-08-15 | East | Jones | Pencil | 35 | 4.99 | 174.65 | True |
| 8 | 2020-09-01 | Central | Smith | Desk | 32 | 125.00 | 250.00 | True |
| 9 | 2020-10-05 | Central | Morgan | Binder | 28 | 8.99 | 251.72 | True |
| 10 | 2020-11-08 | East | Mike | Pen | 15 | 19.99 | 299.85 | False |
| 11 | 2020-12-12 | Central | Smith | Pencil | 67 | 1.29 | 86.43 | False |
| 12 | 2021-01-15 | Central | Gill | Binder | 46 | 8.99 | 413.54 | True |
| 13 | 2021-02-01 | Central | Smith | Binder | 87 | 15.00 | 1305.00 | True |
| 14 | 2021-03-07 | West | Sorvino | Binder | 27 | 19.99 | 139.93 | True |
| 15 | 2021-04-10 | Central | Andrews | Pencil | 66 | 1.99 | 131.34 | False |
| 16 | 2021-05-14 | Central | Gill | Pencil | 53 | 1.29 | 68.37 | False |
| 17 | 2021-06-17 | Central | Tom | Desk | 15 | 125.00 | 625.00 | True |
| 18 | 2021-07-04 | East | Jones | Pen Set | 62 | 4.99 | 309.38 | True |
| 19 | 2021-08-07 | Central | Tom | Pen Set | 42 | 23.95 | 1005.90 | True |
| 20 | 2021-09-10 | Central | Gill | Pencil | 47 | 1.29 | 9.03 | True |
| 21 | 2021-10-14 | West | Thompson | Binder | 57 | 19.99 | 1139.43 | False |
| 22 | 2021-11-17 | Central | Jardine | Binder | 11 | 4.99 | 54.89 | False |
| 23 | 2021-12-04 | Central | Jardine | Binder | 94 | 19.99 | 1879.06 | False |
Now the data stored in the combined_df DataFrame is ready for further processing or visualization. In the following piece of code, we’re going to create a simple bar chart that shows the total sales amount made by each representative. Let’s run it and see the output plot:
total_sales_amount = combined_df.groupby('Rep').Total.sum()
total_sales_amount.plot.bar(figsize=(10, 6))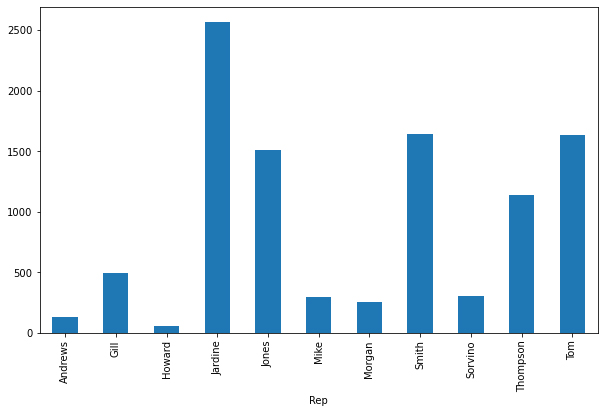
Reading Excel Files Using xlrd
Although importing data into a pandas DataFrame is much more common, another helpful package for reading Excel files in Python is xlrd. In this section, we’re going to scratch the surface of how to read Excel spreadsheets using this package.
NOTE
The xlrd package doesn’t support xlsx files due to a potential security vulnerability. So, we use the xls version of the sales data. You can download the xls version from the link below:
Sales Data Excel Workbook — xls ver.
Let’s see how it works:
import xlrd
excel_workbook = xlrd.open_workbook('sales_data.xls')
Above, the first line imports the xlrd package, then the open_workbook method reads the sales_data.xls file.
We can also open an individual sheet containing the actual data. There are two ways to do so: opening a sheet by index or by name. Let’s open the first sheet by index and the second one by name:
excel_worksheet_2020 = excel_workbook.sheet_by_index(0)
excel_worksheet_2021 = excel_workbook.sheet_by_name('2021')
Now, let’s see how we can print a cell value. The xlrd package provides a method called cell_value() that takes in two arguments: the cell’s row index and column index. Let’s explore it:
print(excel_worksheet_2020.cell_value(1, 3))PencilWe can see that the cell_value function returned the value of the cell at row index 1 (the 2nd row) and column index 3 (the 4th column).
The xlrd package provides two helpful properties: nrows and ncols, returning the number of nonempty spreadsheet’s rows and columns respectively:
print('Columns#:', excel_worksheet_2020.ncols)
print('Rows#:', excel_worksheet_2020.nrows)
Columns#: 8
Rows#: 13Knowing the number of nonempty rows and columns in a spreadsheet helps us with iterating over the data using nested for loops. This makes all the Excel sheet data accessible via the cell_value() method.
Conclusion
This tutorial discussed how to load Excel spreadsheets into pandas DataFrames, work with multiple Excel sheets, and combine them into a single pandas DataFrame. We also explored the main aspects of the xlrd package as one of the simplest tools for accessing the Excel spreadsheets data.
Learn how to import an Excel file (having .xlsx extension) using python pandas.
Pandas is the most popular data manipulation package in Python, and DataFrames are the Pandas data type for storing tabular 2D data. Reading data from excel files or CSV files, and writing data to Excel files or CSV files using Python Pandas is a necessary skill for any analyst or data scientist.
Table of Contents
- Python Pandas read_excel() Syntax
- Import Excel file using Python Pandas (Example)
- read_excel Important Parameters Examples
- Import Specific Excel Sheet using sheet name
- Import Multiple Excel Sheets Pandas
- Import only n Rows of Excel Sheet
- Import specific columns of Excel Sheet
- Import Specific Excel Sheet using sheet name
- Common Errors and Troubleshooting
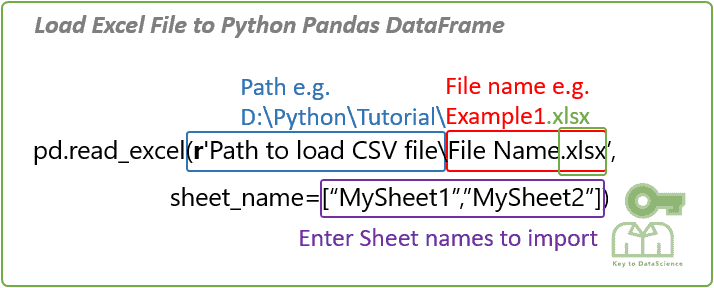
1. Pandas read_excel() Syntax
The syntax of DataFrame to_excel() function and some of the important parameters are:
pandas.read_excel(io='filepath', sheet_name=0, header=0, usecols=None, nrows=None)| Sr.No | Parameters Description |
|---|---|
| 1 | io the file path from where you want to read the data. This could be a URL path or, could be a local system file path. Valid URL schemes include http, ftp, s3, and file. |
| 2 | sheet_name: str, int, list, or None, default 0 Available cases: ~Default is 0: 1st sheet as a DataFrame~Use 1: To read 2nd sheet as a DataFrame~Use Specific Sheet Name: "Sheet1" to load sheet with name “Sheet1”~Load Multiple Sheets using dict: [0, 2, "MySheet"] will load first, third and sheet named “MySheet” as a dictionary of DataFrame~None: Load All sheets |
| 3 | header default is 0. Pass Header = 1 to consider the second line of the dataset as a header. Use None if there is no header. |
| 4 | usecols ~Default is None, then parse all columns.~If str, then provide a comma-separated list of Excel columns (“A, B, D, E”) or range of Excel columns (e.g. “A:F” or “A, B,E:F”). Ranges are inclusive of both sides.~If list of int, indicates list of column numbers to be parsed e.g. [1,2,5].~If list of string, provide list of column names to be parsed e.g. [“A, B, D, E”]. |
| 5 | nrows: Default is NoneNumber of rows to parse (provide int). |
For complete list of read_excel parameters refer to official documentation.
2. Import Excel file using Python Pandas
Let’s review a full example:
- Create a DataFrame from scratch and save it as Excel
- Import (or load) the DataFrame from above saved Excel file
import pandas as pd
# Create a dataframe
raw_data = {'first_name': ['Sam','Ziva','Kia','Robin'],
'degree': ['PhD','MBA','','MS'],
'age': [25, 29, 19, 21]}
df = pd.DataFrame(raw_data)
df
#Save the dataframe to the current directory
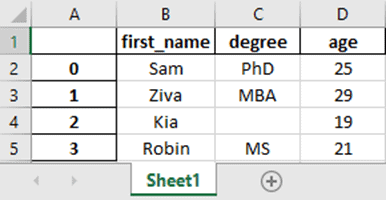
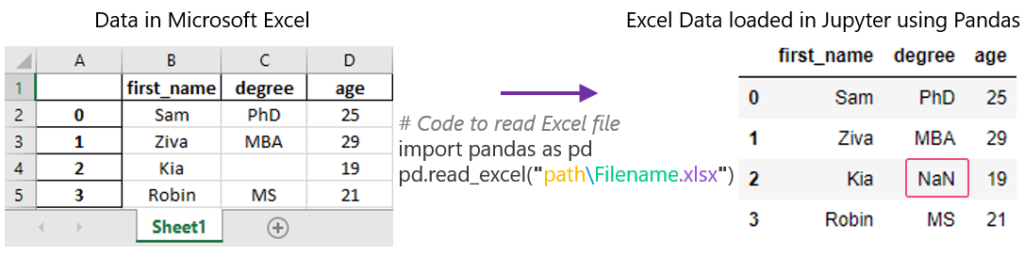
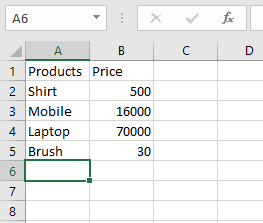
df.to_excel(r'Example1.xlsx')We have the following data about students:
| first_name | degree | age | |
|---|---|---|---|
| 0 | Sam | PhD | 25 |
| 1 | Ziva | MBA | 29 |
| 2 | Kia | 19 | |
| 3 | Robin | MS | 21 |
Read Excel file into Pandas DataFrame (Explained)
Now, let’s see the steps to import the Excel file into a DataFrame.
Step 1: Enter the path and filename where the Excel file is stored. The could be a local system file path or URL path.
For example,
pd.read_excel(r‘D:PythonTutorialExample1.csv‘)
Notice that path is highlighted with 3 different colors:
- The blue part represents the path where the Excel file is saved.
- The green part is the name of the file you want to import.
- The purple part represents the file type or Excel file extension. Use ‘.xlsx’ in case of an Excel file.
Modify the Python above code to reflect the path where the Excel file is stored on your computer.
Note: You can save or read an Excel file without explicitly providing a file path (blue part) by placing the file in the current working directory. To find current directory path use below code:
# Current working directory
import os
print(os.getcwd())

# Display all files present in the current working directory
print(os.listdir(os.getcwd()))
D:PythonTutorial Example1.xlsx
Find out how to read multiple files in a folder(directory) here.
Step 2: Enter the following code and make the necessary changes to your path to read the Excel file.
import pandas as pd
# Read the excel file
df = pd.read_excel(r'D:PythonTutorialExample1.xlsx')
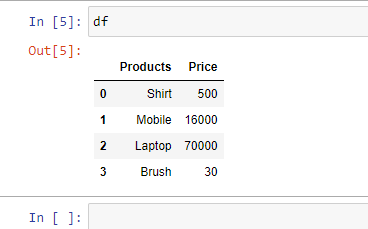
dfSnapshot of Data Representation in Excel files
On the left side of the image Excel file is opened in Microsoft Excel. On the right side same Excel file is opened in Juptyter Notebook using pandas read_excel.
3. Pandas read_excel Important Parameters Examples
3.1 Import Specific Excel Sheet using Python Pandas


There may be Multiple Sheets in an Excel file. Pandas provide various methods to import one or multiple excel sheets in sheet_name parameter.
- Default is
0: Read the 1st sheet in Excel as a DataFrame - Use
1: To read 2nd sheet as a DataFrame - Use Specific Sheet Name:
"Sheet1"to load sheet with name “Sheet1” - Load Multiple Sheets using dict:
[0, 2, "MySheet"]will load first, third and sheet named “MySheet” as a dictionary of DataFrame - None: Load All sheets
1. Import Excel Sheet using Integer
By default sheet_name = 0 imports the 1st sheet in Excel as a DataFrame. To import Second Excel Sheet i.e. “Salary Info” in our case as a Pandas DataFrame use sheet_name = 1
import pandas as pd

# Read "Salary Info" Sheet from Excel file (2nd Sheet)
df = pd.read_excel(r'D:PythonTutorialExample1.xlsx',sheet_name=1)

df| first_name | salary | |
| 0 | Sam | 120000 |
| 1 | Ziva | 80000 |
| 2 | Kia | 110000 |
| 3 | Robin | 150000 |
2. Import Specific Excel Sheet using Sheet Name
To import Specific Excel Sheet i.e. “Personal Info” as a Pandas DataFrame using sheet_name = "Personal Info"
import pandas as pd

# Read excel file sheet "Personal Info" using sheetname
df = pd.read_excel(r'D:PythonTutorialExample1.xlsx',sheet_name="Personal Info")

df| first_name | degree | age | |
| 0 | Sam | PhD | 25 |
| 1 | Ziva | MBA | 29 |
| 2 | Kia | NaN | 19 |
| 3 | Robin | MS | 21 |
3. Import Multiple Excel Sheet into Pandas DataFrame
Multiple Excel Sheets can be read into Pandas DataFrame by passing list in the sheet_name parameter e.g. [0, “Salary Info”] will load the first sheet and sheet named “Salary Info” as a dictionary of DataFrame.
import pandas as pd

# Read multiple excel file sheets as dictionary of DataFrame
df = pd.read_excel(r'D:PythonTutorialExample1.xlsx',sheet_name=[0, "Salary Info"])

df
Now to store different sheets into different DataFrames use Dictionary Key Value.
import pandas as pd

# Read multiple excel file sheets as dictionary of DataFrame
df = pd.read_excel(r'D:PythonTutorialExample1.xlsx',sheet_name=[0, "Salary Info"])

# As seen in the output above Keys are 0 and "Salary_Info"
Personal_Info = df[0]
Salary_Info = df["Salary Info"]

print(Personal_Info)
print(Salary_Info)
3.2 Import only n Rows of Excel Sheet using Pandas
Sometimes Excel file is quite big or our system has memory constraints. In this case, we can import only the top n rows of Excel Sheet using Pandas read_excel nrows parameter. For example, to import only top 2 rows use nrows=2
import pandas as pd

# Load top 2 rows of Excel sheets as Pandas DataFrame
df = pd.read_excel(r'D:PythonTutorialExample1.xlsx',nrows=2)

df| first_name | degree | age | |
| 0 | Sam | PhD | 25 |
| 1 | Ziva | MBA | 29 |
3.3 Import specific columns of Excel Sheet
There may be hundreds of columns in excel sheet, but while importing we need only few columns. In this case, we can pass usecols parameter. Different ways to use usecols parameter are below:
- Default is
None, parse all columns. - If
str, then provide a comma-separated list of Excel columns (“A, B, D, E”) or range of Excel columns (e.g. “A:F” or “A, B,E:F”). Ranges are inclusive of both sides. - If
list of int, indicates list of column numbers to be parsed e.g. [0,2,5]. - If
list of string, provide list of column names to be parsed e.g. [“A, B, D, E”].
import pandas as pd

# Import 1st and 3rd columns of Execl sheet as Pandas DataFrame
df = pd.read_excel(r'D:PythonTutorialExample1.xlsx',usecols=[0,2])

df| first_name | age | |
| 0 | Sam | 25 |
| 1 | Ziva | 29 |
| 2 | Kia | 19 |
| 3 | Robin | 21 |
4. Common Errors and Troubleshooting
Listing down the common error you can face while loading data from CSV files into Pandas dataframe will be:
FileNotFoundError: File b'filename.csv' does not exist- Reason: File Not Found error typically occurs when there is an issue with the file path (or directory) or file name.
- Fix: Check file path, file name, and file extension.
SyntaxError: (unicode error) 'unicodeescape' codec can't decode bytes in position 2-3: truncated UXXXXXXXX escape- Reason: In
Ustarts an eight-character Unicode escape, such asU00014321. In the code, the escape is followed by the character ‘s’, which is invalid. - Fix:
- Use the prefix string with
r(to produce a raw string)pd.read_excel(r'D:PythonTutorialfilename.xlsx')or, - You either need to duplicate all backslashes
pd.read_excel(r'D:\Python\Tutorial\filename.xlsx')
- Use the prefix string with
- Reason: In
ImportError: Install xlrd >= 1.0.0 for Excel support.- Reason: xlrd package is not available in the python environment
- Fix: Install xlrd package if you get the above error
pip install xlrd
Conclusion
We have covered the steps needed to read an Excel file in python using pandas read_excel function.
Go to read data from csv files, and write data to CSV files using Python.
In this tutorial, you’ll learn how to use Python and Pandas to read Excel files using the Pandas read_excel function. Excel files are everywhere – and while they may not be the ideal data type for many data scientists, knowing how to work with them is an essential skill.
By the end of this tutorial, you’ll have learned:
- How to use the Pandas read_excel function to read an Excel file
- How to read specify an Excel sheet name to read into Pandas
- How to read multiple Excel sheets or files
- How to certain columns from an Excel file in Pandas
- How to skip rows when reading Excel files in Pandas
- And more
Let’s get started!
The Quick Answer: Use Pandas read_excel to Read Excel Files
To read Excel files in Python’s Pandas, use the read_excel() function. You can specify the path to the file and a sheet name to read, as shown below:
# Reading an Excel File in Pandas
import pandas as pd

df = pd.read_excel('/Users/datagy/Desktop/Sales.xlsx')

# With a Sheet Name
df = pd.read_excel(
   io='/Users/datagy/Desktop/Sales.xlsx'
   sheet_name ='North'
)
In the following sections of this tutorial, you’ll learn more about the Pandas read_excel() function to better understand how to customize reading Excel files.
Understanding the Pandas read_excel Function
The Pandas read_excel() function has a ton of different parameters. In this tutorial, you’ll learn how to use the main parameters available to you that provide incredible flexibility in terms of how you read Excel files in Pandas.
| Parameter | Description | Available Option |
|---|---|---|
io= |
The string path to the workbook. | URL to file, path to file, etc. |
sheet_name= |
The name of the sheet to read. Will default to the first sheet in the workbook (position 0). | Can read either strings (for the sheet name), integers (for position), or lists (for multiple sheets) |
usecols= |
The columns to read, if not all columns are to be read | Can be strings of columns, Excel-style columns (“A:C”), or integers representing positions columns |
dtype= |
The datatypes to use for each column | Dictionary with columns as keys and data types as values |
skiprows= |
The number of rows to skip from the top | Integer value representing the number of rows to skip |
nrows= |
The number of rows to parse | Integer value representing the number of rows to read |
.read_excel() functionThe table above highlights some of the key parameters available in the Pandas .read_excel() function. The full list can be found in the official documentation. In the following sections, you’ll learn how to use the parameters shown above to read Excel files in different ways using Python and Pandas.
As shown above, the easiest way to read an Excel file using Pandas is by simply passing in the filepath to the Excel file. The io= parameter is the first parameter, so you can simply pass in the string to the file.
The parameter accepts both a path to a file, an HTTP path, an FTP path or more. Let’s see what happens when we read in an Excel file hosted on my Github page.
# Reading an Excel file in Pandas
import pandas as pd

df = pd.read_excel('https://github.com/datagy/mediumdata/raw/master/Sales.xlsx')
print(df.head())

# Returns:
#         Date Customer  Sales
# 0 2022-04-01        A    191
# 1 2022-04-02        B    727
# 2 2022-04-03        A    782
# 3 2022-04-04        B    561
# 4 2022-04-05        A    969
If you’ve downloaded the file and taken a look at it, you’ll notice that the file has three sheets? So, how does Pandas know which sheet to load? By default, Pandas will use the first sheet (positionally), unless otherwise specified.
In the following section, you’ll learn how to specify which sheet you want to load into a DataFrame.
How to Specify Excel Sheet Names in Pandas read_excel
As shown in the previous section, you learned that when no sheet is specified, Pandas will load the first sheet in an Excel workbook. In the workbook provided, there are three sheets in the following structure:
Sales.xlsx
|---East
|---West
|---North
Because of this, we know that the data from the sheet “East” was loaded. If we wanted to load the data from the sheet “West”, we can use the sheet_name= parameter to specify which sheet we want to load.
The parameter accepts both a string as well as an integer. If we were to pass in a string, we can specify the sheet name that we want to load.
Let’s take a look at how we can specify the sheet name for 'West':
# Specifying an Excel Sheet to Load by Name
import pandas as pd

df = pd.read_excel(
    io='https://github.com/datagy/mediumdata/raw/master/Sales.xlsx',
    sheet_name='West')
print(df.head())

# Returns:
#         Date Customer  Sales
# 0 2022-04-01        A    504
# 1 2022-04-02        B    361
# 2 2022-04-03        A    694
# 3 2022-04-04        B    702
# 4 2022-04-05        A    255
Similarly, we can load a sheet name by its position. By default, Pandas will use the position of 0, which will load the first sheet. Say we wanted to repeat our earlier example and load the data from the sheet named 'West', we would need to know where the sheet is located.
Because we know the sheet is the second sheet, we can pass in the 1st index:
# Specifying an Excel Sheet to Load by Position
import pandas as pd

df = pd.read_excel(
    io='https://github.com/datagy/mediumdata/raw/master/Sales.xlsx',
    sheet_name=1)
print(df.head())

# Returns:
#         Date Customer  Sales
# 0 2022-04-01        A    504
# 1 2022-04-02        B    361
# 2 2022-04-03        A    694
# 3 2022-04-04        B    702
# 4 2022-04-05        A    255
We can see that both of these methods returned the same sheet’s data. In the following section, you’ll learn how to specify which columns to load when using the Pandas read_excel function.
How to Specify Columns Names in Pandas read_excel
There may be many times when you don’t want to load every column in an Excel file. This may be because the file has too many columns or has different columns for different worksheets.
In order to do this, we can use the usecols= parameter. It’s a very flexible parameter that lets you specify:
- A list of column names,
- A string of Excel column ranges,
- A list of integers specifying the column indices to load
Most commonly, you’ll encounter people using a list of column names to read in. Each of these columns are comma separated strings, contained in a list.
Let’s load our DataFrame from the example above, only this time only loading the 'Customer' and 'Sales' columns:
# Specifying Columns to Load by Name
import pandas as pd

df = pd.read_excel(
    io='https://github.com/datagy/mediumdata/raw/master/Sales.xlsx',
    usecols=['Customer', 'Sales'])
print(df.head())

# Returns:
#   Customer  Sales
# 0        A    191
# 1        B    727
# 2        A    782
# 3        B    561
# 4        A    969
We can see that by passing in the list of strings representing the columns, we were able to parse those columns only.
If we wanted to use Excel changes, we could also specify columns 'B:C'. Let’s see what this looks like below:
# Specifying Columns to Load by Excel Range
import pandas as pd

df = pd.read_excel(
    io='https://github.com/datagy/mediumdata/raw/master/Sales.xlsx',
    usecols='B:C')
print(df.head())

# Returns:
#   Customer  Sales
# 0        A    191
# 1        B    727
# 2        A    782
# 3        B    561
# 4        A    969
Finally, we can also pass in a list of integers that represent the positions of the columns we wanted to load. Because the columns are the second and third columns, we would load a list of integers as shown below:
# Specifying Columns to Load by Their Position
import pandas as pd

df = pd.read_excel(
    io='https://github.com/datagy/mediumdata/raw/master/Sales.xlsx',
    usecols=[1,2])
print(df.head())

# Returns:
#   Customer  Sales
# 0        A    191
# 1        B    727
# 2        A    782
# 3        B    561
# 4        A    969
In the following section, you’ll learn how to specify data types when reading Excel files.
How to Specify Data Types in Pandas read_excel
Pandas makes it easy to specify the data type of different columns when reading an Excel file. This serves three main purposes:
- Preventing data from being read incorrectly
- Speeding up the read operation
- Saving memory
You can pass in a dictionary where the keys are the columns and the values are the data types. This ensures that data are ready correctly. Let’s see how we can specify the data types for our columns.
# Specifying Data Types for Columns When Reading Excel Files
import pandas as pd

df = pd.read_excel(
    io='https://github.com/datagy/mediumdata/raw/master/Sales.xlsx',
    dtype={'date':'datetime64', 'Customer': 'object', 'Sales':'int'})
print(df.head())

# Returns:
#   Customer  Sales
#         Date Customer  Sales
# 0 2022-04-01        A    191
# 1 2022-04-02        B    727
# 2 2022-04-03        A    782
# 3 2022-04-04        B    561
# 4 2022-04-05        A    969
It’s important to note that you don’t need to pass in all the columns for this to work. In the next section, you’ll learn how to skip rows when reading Excel files.
How to Skip Rows When Reading Excel Files in Pandas
In some cases, you’ll encounter files where there are formatted title rows in your Excel file, as shown below:
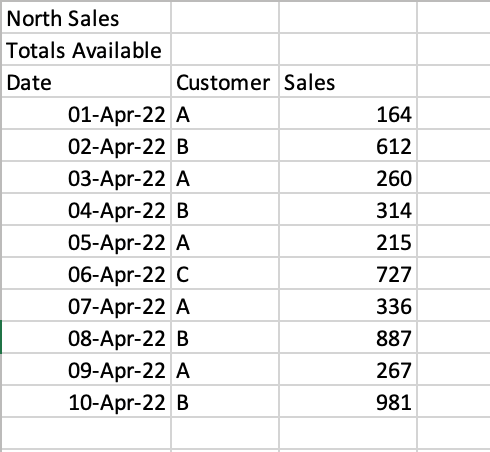
If we were to read the sheet 'North', we would get the following returned:
# Reading a poorly formatted Excel file
import pandas as pd

df = pd.read_excel(
    io='https://github.com/datagy/mediumdata/raw/master/Sales.xlsx',
    sheet_name='North')
print(df.head())

# Returns:
#            North Sales Unnamed: 1 Unnamed: 2
# 0     Totals Available        NaN        NaN
# 1                 Date   Customer      Sales
# 2  2022-04-01 00:00:00          A        164
# 3  2022-04-02 00:00:00          B        612
# 4  2022-04-03 00:00:00          A        260
Pandas makes it easy to skip a certain number of rows when reading an Excel file. This can be done using the skiprows= parameter. We can see that we need to skip two rows, so we can simply pass in the value 2, as shown below:
# Reading a Poorly Formatted File Correctly
import pandas as pd

df = pd.read_excel(
    io='https://github.com/datagy/mediumdata/raw/master/Sales.xlsx',
    sheet_name='North',
    skiprows=2)
print(df.head())

# Returns:
#         Date Customer  Sales
# 0 2022-04-01        A    164
# 1 2022-04-02        B    612
# 2 2022-04-03        A    260
# 3 2022-04-04        B    314
# 4 2022-04-05        A    215
This read the file much more accurately! It can be a lifesaver when working with poorly formatted files. In the next section, you’ll learn how to read multiple sheets in an Excel file in Pandas.
How to Read Multiple Sheets in an Excel File in Pandas
Pandas makes it very easy to read multiple sheets at the same time. This can be done using the sheet_name= parameter. In our earlier examples, we passed in only a single string to read a single sheet. However, you can also pass in a list of sheets to read multiple sheets at once.
Let’s see how we can read our first two sheets:
# Reading Multiple Excel Sheets at Once in Pandas
import pandas as pd

dfs = pd.read_excel(
    io='https://github.com/datagy/mediumdata/raw/master/Sales.xlsx',
    sheet_name=['East', 'West'])

print(type(dfs))

# Returns: <class 'dict'>
In the example above, we passed in a list of sheets to read. When we used the type() function to check the type of the returned value, we saw that a dictionary was returned.
Each of the sheets is a key of the dictionary with the DataFrame being the corresponding key’s value. Let’s see how we can access the 'West' DataFrame:
# Reading Multiple Excel Sheets in Pandas
import pandas as pd

dfs = pd.read_excel(
    io='https://github.com/datagy/mediumdata/raw/master/Sales.xlsx',
    sheet_name=['East', 'West'])

print(dfs.get('West').head())

# Returns:
#         Date Customer  Sales
# 0 2022-04-01        A    504
# 1 2022-04-02        B    361
# 2 2022-04-03        A    694
# 3 2022-04-04        B    702
# 4 2022-04-05        A    255
You can also read all of the sheets at once by specifying None for the value of sheet_name=. Similarly, this returns a dictionary of all sheets:
# Reading Multiple Excel Sheets in Pandas
import pandas as pd

dfs = pd.read_excel(
    io='https://github.com/datagy/mediumdata/raw/master/Sales.xlsx',
    sheet_name=None)
In the next section, you’ll learn how to read multiple Excel files in Pandas.
How to Read Only n Lines When Reading Excel Files in Pandas
When working with very large Excel files, it can be helpful to only sample a small subset of the data first. This allows you to quickly load the file to better be able to explore the different columns and data types.
This can be done using the nrows= parameter, which accepts an integer value of the number of rows you want to read into your DataFrame. Let’s see how we can read the first five rows of the Excel sheet:
# Reading n Number of Rows of an Excel Sheet
import pandas as pd

df = pd.read_excel(
    io='https://github.com/datagy/mediumdata/raw/master/Sales.xlsx',
    nrows=5)
print(df)

# Returns:
#         Date Customer  Sales
# 0 2022-04-01        A    191
# 1 2022-04-02        B    727
# 2 2022-04-03        A    782
# 3 2022-04-04        B    561
# 4 2022-04-05        A    969
Conclusion
In this tutorial, you learned how to use Python and Pandas to read Excel files into a DataFrame using the .read_excel() function. You learned how to use the function to read an Excel, specify sheet names, read only particular columns, and specify data types. You then learned how skip rows, read only a set number of rows, and read multiple sheets.
Additional Resources
To learn more about related topics, check out the tutorials below:
- Pandas Dataframe to CSV File – Export Using .to_csv()
- Combine Data in Pandas with merge, join, and concat
- Introduction to Pandas for Data Science
- Summarizing and Analyzing a Pandas DataFrame
Хотя многие Data Scientist’ы больше привыкли работать с CSV-файлами, на практике очень часто приходится сталкиваться с обычными Excel-таблицами. Поэтому сегодня мы расскажем, как читать Excel-файлы в Pandas, а также рассмотрим основные возможности Python-библиотеки OpenPyXL для чтения метаданных ячеек.
Дополнительные зависимости для возможности чтения Excel таблиц
Для чтения таблиц Excel в Pandas требуются дополнительные зависимости:
- xlrd поддерживает старые и новые форматы MS Excel [1];
- OpenPyXL поддерживает новые форматы MS Excel (.xlsx) [2];
- ODFpy поддерживает свободные форматы OpenDocument (.odf, .ods и .odt) [3];
- pyxlsb поддерживает бинарные MS Excel файлы (формат .xlsb) [4].
Мы рекомендуем установить только OpenPyXL, поскольку он нам пригодится в дальнейшем. Для этого в командной строке прописывается следующая операция:
pip install openpyxl
Затем в Pandas нужно указать путь к Excel-файлу и одну из установленных зависимостей. Python-код выглядит следующим образом:
import pandas as pd
pd.read_excel(io='temp1.xlsx', engine='openpyxl')
#
     Name  Age  Weight
0    Alex   35      87
1   Lesha   57      72
2  Nastya   21      64
Читаем несколько листов
Excel-файл может содержать несколько листов. В Pandas, чтобы прочитать конкретный лист, в аргументе нужно указать sheet_name. Можно указать список названий листов, тогда Pandas вернет словарь (dict) с объектами DataFrame:
dfs = pd.read_excel(io='temp1.xlsx',
                    engine='openpyxl',
                    sheet_name=['Sheet1', 'Sheet2'])
dfs
#
{'Sheet1':      Name  Age  Weight
 0    Alex   35      87
 1   Lesha   57      72
 2  Nastya   21      64,
 'Sheet2':     Name  Age  Weight
 0  Gosha   43      95
 1   Anna   24      65
 2   Lena   22      78}
Если таблицы в словаре имеют одинаковые атрибуты, то их можно объединить в один DataFrame. В Python это выглядит так:
pd.concat(dfs).reset_index(drop=True)
     Name  Age  Weight
0    Alex   35      87
1   Lesha   57      72
2  Nastya   21      64
3   Gosha   43      95
4    Anna   24      65
5    Lena   22      78
Указание диапазонов
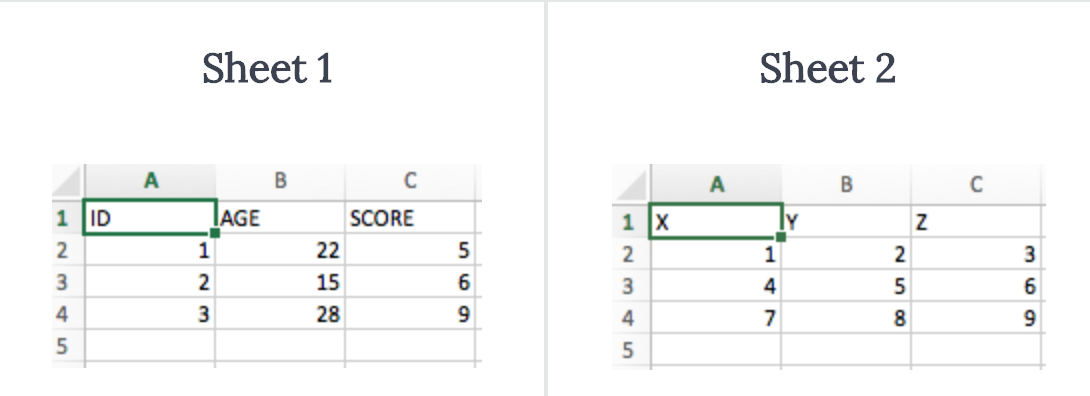
Таблицы могут размещаться не в самом начале, а как, например, на рисунке ниже. Как видим, таблица располагается в диапазоне A:F.
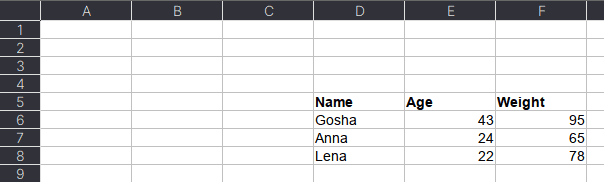
Чтобы прочитать такую таблицу, нужно указать диапазон в аргументе usecols. Также дополнительно можно добавить header — номер заголовка таблицы, а также nrows — количество строк, которые нужно прочитать. В аргументе header всегда передается номер строки на единицу меньше, чем в Excel-файле, поскольку в Python индексация начинается с 0 (на рисунке это номер 5, тогда указываем 4):
pd.read_excel(io='temp1.xlsx',
              engine='openpyxl',
              usecols='D:F',
              header=4, # в excel это №5
              nrows=3)
#
    Name  Age  Weight
0  Gosha   43      95
1   Anna   24      65
2   Lena   22      78
Читаем таблицы в OpenPyXL
Pandas прочитывает только содержимое таблицы, но игнорирует метаданные: цвет заливки ячеек, примечания, стили таблицы и т.д. В таком случае пригодится библиотека OpenPyXL. Загрузка файлов осуществляется через функцию load_workbook, а к листам обращаться можно через квадратные скобки:
from openpyxl import load_workbook
wb = load_workbook('temp2.xlsx')
ws = wb['Лист1']
type(ws)
# openpyxl.worksheet.worksheet.Worksheet
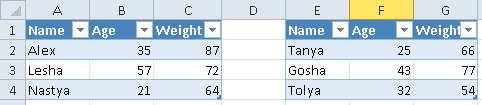
Допустим, имеется Excel-файл с несколькими таблицами на листе (см. рисунок выше). Если бы мы использовали Pandas, то он бы выдал следующий результат:
pd.read_excel(io='temp2.xlsx',
              engine='openpyxl')
#
     Name  Age  Weight  Unnamed: 3 Name.1  Age.1  Weight.1
0    Alex   35      87         NaN  Tanya     25        66
1   Lesha   57      72         NaN  Gosha     43        77
2  Nastya   21      64         NaN  Tolya     32        54
Можно, конечно, заняться обработкой и привести таблицы в нормальный вид, а можно воспользоваться OpenPyXL, который хранит таблицу и его диапазон в словаре. Чтобы посмотреть этот словарь, нужно вызвать ws.tables.items. Вот так выглядит Python-код:
ws.tables.items()
wb = load_workbook('temp2.xlsx')
ws = wb['Лист1']
ws.tables.items()
#
[('Таблица1', 'A1:C4'), ('Таблица13', 'E1:G4')]
Обращаясь к каждому диапазону, можно проходить по каждой строке или столбцу, а внутри них – по каждой ячейке. Например, следующий код на Python таблицы объединяет строки в список, где первая строка уходит на заголовок, а затем преобразует их в DataFrame:
dfs = []
for table_name, value in ws.tables.items():
    table = ws[value]
    header, *body = [[cell.value for cell in row]
                      for row in table]
    df = pd.DataFrame(body, columns=header)
    dfs.append(df)
Если таблицы имеют одинаковые атрибуты, то их можно соединить в одну:
pd.concat(dfs)
#
     Name  Age  Weight
0    Alex   35      87
1   Lesha   57      72
2  Nastya   21      64
0   Tanya   25      66
1   Gosha   43      77
2   Tolya   32      54
Сохраняем метаданные таблицы
Как указано в коде выше, у ячейки OpenPyXL есть атрибут value, который хранит ее значение. Помимо value, можно получить тип ячейки (data_type), цвет заливки (fill), примечание (comment) и др.
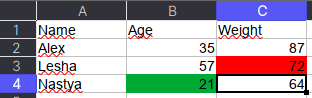
Например, требуется сохранить данные о цвете ячеек. Для этого мы каждую ячейку с числами перезапишем в виде <значение,RGB>, где RGB — значение цвета в формате RGB (red, green, blue). Python-код выглядит следующим образом:
# _TYPES = {int:'n', float:'n', str:'s', bool:'b'}
data = []
for row in ws.rows:
    row_cells = []
    for cell in row:
        cell_value = cell.value
        if cell.data_type == 'n':
            cell_value = f"{cell_value},{cell.fill.fgColor.rgb}"
        row_cells.append(cell_value)
    data.append(row_cells)
Первым элементом списка является строка-заголовок, а все остальное уже значения таблицы:
pd.DataFrame(data[1:], columns=data[0])
#
     Name          Age       Weight
0    Alex  35,00000000  87,00000000
1   Lesha  57,00000000  72,FFFF0000
2  Nastya  21,FF00A933  64,00000000
Теперь представим атрибуты в виде индексов с помощью метода stack, а после разобьём все записи на значение и цвет методом str.split:
(pd.DataFrame(data[1:], columns=data[0])
 .set_index('Name')
 .stack()
 .str.split(',', expand=True)
)
#
                0         1
Name
Alex   Age     35  00000000
       Weight  87  00000000
Lesha  Age     57  00000000
       Weight  72  FFFF0000
Nastya Age     21  FF00A933
       Weight  64  0000000
Осталось только переименовать 0 и 1 на Value и Color, а также добавить атрибут Variable, который обозначит Вес и Возраст. Полный код на Python выглядит следующим образом:
(pd.DataFrame(data[1:], columns=data[0])
 .set_index('Name')
 .stack()
 .str.split(',', expand=True)
 .set_axis(['Value', 'Color'], axis=1)
 .rename_axis(index=['Name', 'Variable'])
 .reset_index()
)
#
     Name Variable Value     Color
0    Alex      Age    35  00000000
1    Alex   Weight    87  00000000
2   Lesha      Age    57  00000000
3   Lesha   Weight    72  FFFF0000
4  Nastya      Age    21  FF00A933
5  Nastya   Weight    64  00000000
Ещё больше подробностей о работе с таблицами в Pandas, а также их обработке на реальных примерах Data Science задач, вы узнаете на наших курсах по Python в лицензированном учебном центре обучения и повышения квалификации IT-специалистов в Москве.
Источники
- https://xlrd.readthedocs.io/en/latest/
- https://openpyxl.readthedocs.io/en/latest/
- https://github.com/eea/odfpy
- https://github.com/willtrnr/pyxlsb
Improve Article
Save Article
Like Article
Improve Article
Save Article
Like Article
It is not always possible to get the dataset in CSV format. So, Pandas provides us the functions to convert datasets in other formats to the Data frame. An excel file has a ‘.xlsx’ format.
Before we get started, we need to install a few libraries.
pip install pandas
pip install xlrd
For importing an Excel file into Python using Pandas we have to use pandas.read_excel() function.
Syntax: pandas.read_excel(io, sheet_name=0, header=0, names=None,….)
Return: DataFrame or dict of DataFrames.
Let’s suppose the Excel file looks like this:
Now, we can dive into the code.
Example 1: Read an Excel file.
Python3
import pandas as pd
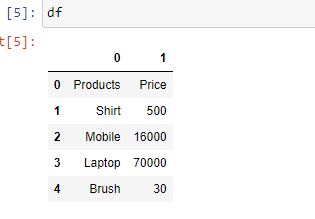
df = pd.read_excel("sample.xlsx")
print(df)
Output:
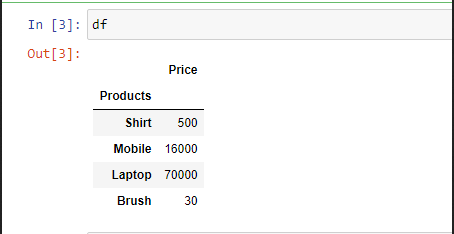
Example 2: To select a particular column, we can pass a parameter “index_col“.
Python3
import pandas as pd
df = pd.read_excel("sample.xlsx",
index_col = 0)
print(df)
Output:
Example 3: In case you don’t prefer the initial heading of the columns, you can change it to indexes using the parameter “header”.
Python3
import pandas as pd
df = pd.read_excel('sample.xlsx',
header = None)
print(df)
Output:
Example 4: If you want to change the data type of a particular column you can do it using the parameter “dtype“.
Python3
import pandas as pd
df = pd.read_excel('sample.xlsx',
dtype = {"Products": str,
"Price":float})
print(df)
Output:
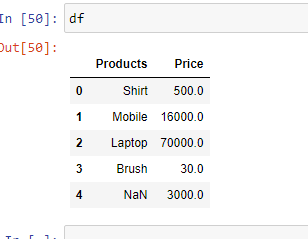
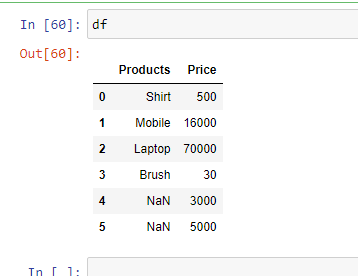
Example 5: In case you have unknown values, then you can handle it using the parameter “na_values“. It will convert the mentioned unknown values into “NaN”
Python3
import pandas as pd
df = pd.read_excel('sample.xlsx',
na_values =['item1',
'item2'])
print(df)
Output:
Like Article
Save Article
Узнайте, как читать и импортировать файлы Excel в Python, как записывать данные в эти таблицы и какие библиотеки лучше всего подходят для этого.
Известный вам инструмент для организации, анализа и хранения ваших данных в таблицах — Excel — применяется и в data science. В какой-то момент вам придется иметь дело с этими таблицами, но работать именно с ними вы будете не всегда. Вот почему разработчики Python реализовали способы чтения, записи и управления не только этими файлами, но и многими другими типами файлов.
Из этого учебника узнаете, как можете работать с Excel и Python. Внутри найдете обзор библиотек, которые вы можете использовать для загрузки и записи этих таблиц в файлы с помощью Python. Вы узнаете, как работать с такими библиотеками, как pandas, openpyxl, xlrd, xlutils и pyexcel.
Данные как ваша отправная точка
Когда вы начинаете проект по data science, вам придется работать с данными, которые вы собрали по всему интернету, и с наборами данных, которые вы загрузили из других мест — Kaggle, Quandl и тд
Но чаще всего вы также найдете данные в Google или в репозиториях, которые используются другими пользователями. Эти данные могут быть в файле Excel или сохранены в файл с расширением .csv … Возможности могут иногда казаться бесконечными, но когда у вас есть данные, в первую очередь вы должны убедиться, что они качественные.
В случае с электронной таблицей вы можете не только проверить, могут ли эти данные ответить на вопрос исследования, который вы имеете в виду, но также и можете ли вы доверять данным, которые хранятся в электронной таблице.
Проверяем качество таблицы
- Представляет ли электронная таблица статические данные?
- Смешивает ли она данные, расчеты и отчетность?
- Являются ли данные в вашей электронной таблице полными и последовательными?
- Имеет ли ваша таблица систематизированную структуру рабочего листа?
- Проверяли ли вы действительные формулы в электронной таблице?
Этот список вопросов поможет убедиться, что ваша таблица не грешит против лучших практик, принятых в отрасли. Конечно, этот список не исчерпывающий, но позволит провести базовую проверку таблицы.
Лучшие практики для данных электронных таблиц
Прежде чем приступить к чтению вашей электронной таблицы на Python, вы также должны подумать о том, чтобы настроить свой файл в соответствии с некоторыми основными принципами, такими как:
- Первая строка таблицы обычно зарезервирована для заголовка, а первый столбец используется для идентификации единицы выборки;
- Избегайте имен, значений или полей с пробелами. В противном случае каждое слово будет интерпретироваться как отдельная переменная, что приведет к ошибкам, связанным с количеством элементов на строку в вашем наборе данных. По возможности, используйте:
- подчеркивания,
- тире,
- горбатый регистр, где первая буква каждого слова пишется с большой буквы
- объединяющие слова
- Короткие имена предпочтительнее длинных имен;
- старайтесь не использовать имена, которые содержат символы ?, $,%, ^, &, *, (,), -, #,? ,,, <,>, /, |, , [,], {, и };
- Удалите все комментарии, которые вы сделали в вашем файле, чтобы избежать добавления в ваш файл лишних столбцов или NA;
- Убедитесь, что все пропущенные значения в вашем наборе данных обозначены как NA.
Затем, после того, как вы внесли необходимые изменения или тщательно изучили свои данные, убедитесь, что вы сохранили внесенные изменения. Сделав это, вы можете вернуться к данным позже, чтобы отредактировать их, добавить дополнительные данные или изменить их, сохранив формулы, которые вы, возможно, использовали для расчета данных и т.д.
Если вы работаете с Microsoft Excel, вы можете сохранить файл в разных форматах: помимо расширения по умолчанию .xls или .xlsx, вы можете перейти на вкладку «Файл», нажать «Сохранить как» и выбрать одно из расширений, которые указаны в качестве параметров «Сохранить как тип». Наиболее часто используемые расширения для сохранения наборов данных в data science — это .csv и .txt (в виде текстового файла с разделителями табуляции). В зависимости от выбранного варианта сохранения поля вашего набора данных разделяются вкладками или запятыми, которые образуют символы-разделители полей вашего набора данных.
Теперь, когда вы проверили и сохранили ваши данные, вы можете начать с подготовки вашего рабочего окружения.
Готовим рабочее окружение
Как убедиться, что вы все делаете хорошо? Проверить рабочее окружение!
Когда вы работаете в терминале, вы можете сначала перейти в каталог, в котором находится ваш файл, а затем запустить Python. Убедитесь, что файл лежит именно в том каталоге, к которому вы обратились.
Возможно, вы уже начали сеанс Python и у вас нет подсказок о каталоге, в котором вы работаете. Тогда можно выполнить следующие команды:
# Import `os`
import os

# Retrieve current working directory (`cwd`)
cwd = os.getcwd()
cwd

# Change directory
os.chdir("/path/to/your/folder")

# List all files and directories in current directory
os.listdir('.')
Круто, да?
Вы увидите, что эти команды очень важны не только для загрузки ваших данных, но и для дальнейшего анализа. А пока давайте продолжим: вы прошли все проверки, вы сохранили свои данные и подготовили рабочее окружение.
Можете ли вы начать с чтения данных в Python?
Установите библиотеки для чтения и записи файлов Excel
Даже если вы еще не знаете, какие библиотеки вам понадобятся для импорта ваших данных, вы должны убедиться, что у вас есть все, что нужно для установки этих библиотек, когда придет время.
Подготовка к дополнительной рабочей области: pip
Вот почему вам нужно установить pip и setuptools. Если у вас установлен Python2 ⩾ 2.7.9 или Python3 ⩾ 3.4, то можно не беспокоиться — просто убедитесь, что вы обновились до последней версии.
Для этого выполните следующую команду в своем терминале:
# Для Linux/OS X
pip install -U pip setuptools

# Для Windows
python -m pip install -U pip setuptools
Если вы еще не установили pip, запустите скрипт python get-pip.py, который вы можете найти здесь. Следуйте инструкциям по установке.
Установка Anaconda
Другой вариант для работы в data science — установить дистрибутив Anaconda Python. Сделав это, вы получите простой и быстрый способ начать заниматься data science, потому что вам не нужно беспокоиться об установке отдельных библиотек, необходимых для работы.
Это особенно удобно, если вы новичок, но даже для более опытных разработчиков это способ быстро протестировать некоторые вещи без необходимости устанавливать каждую библиотеку отдельно.
Anaconda включает в себя 100 самых популярных библиотек Python, R и Scala для науки о данных и несколько сред разработки с открытым исходным кодом, таких как Jupyter и Spyder.
Установить Anaconda можно здесь. Следуйте инструкциям по установке, и вы готовы начать!
Загрузить файлы Excel в виде фреймов Pandas
Все, среда настроена, вы готовы начать импорт ваших файлов.
Один из способов, который вы часто используете для импорта ваших файлов для обработки данных, — с помощью библиотеки Pandas. Она основана на NumPy и предоставляет простые в использовании структуры данных и инструменты анализа данных Python.
Эта мощная и гибкая библиотека очень часто используется дата-инженерами для передачи своих данных в структуры данных, очень выразительных для их анализа.
Если у вас уже есть Pandas, доступные через Anaconda, вы можете просто загрузить свои файлы в Pandas DataFrames с помощью pd.Excelfile():
# импорт библиотеки pandas
import pandas as pd

# Загружаем ваш файл в переменную `file` / вместо 'example' укажите название свого файла из текущей директории
file = 'example.xlsx'

# Загружаем spreadsheet в объект pandas
xl = pd.ExcelFile(file)

# Печатаем название листов в данном файле
print(xl.sheet_names)

# Загрузить лист в DataFrame по его имени: df1
df1 = xl.parse('Sheet1')
Если вы не установили Anaconda, просто выполните pip install pandas, чтобы установить библиотеку Pandas в вашей среде, а затем выполните команды, которые включены в фрагмент кода выше.
Проще простого, да?
Для чтения в файлах .csv у вас есть аналогичная функция для загрузки данных в DataFrame: read_csv(). Вот пример того, как вы можете использовать эту функцию:
# Импорт библиотеки pandas
import pandas as pd

# Загрузить csv файл
df = pd.read_csv("example.csv")
Разделитель, который будет учитывать эта функция, по умолчанию является запятой, но вы можете указать альтернативный разделитель, если хотите. Перейдите к документации, чтобы узнать, какие другие аргументы вы можете указать для успешного импорта!
Обратите внимание, что есть также функции read_table() и read_fwf() для чтения файлов и таблиц с фиксированной шириной в формате DataFrames с общим разделителем. Для первой функции разделителем по умолчанию является вкладка, но вы можете снова переопределить это, а также указать альтернативный символ-разделитель. Более того, есть и другие функции, которые вы можете использовать для получения данных в DataFrames: вы можете найти их здесь.
Как записать Pandas DataFrames в файлы Excel
Допустим, что после анализа данных вы хотите записать данные обратно в новый файл. Есть также способ записать ваши Pandas DataFrames обратно в файлы с помощью функции to_excel().
Но, прежде чем использовать эту функцию, убедитесь, что у вас установлен XlsxWriter, если вы хотите записать свои данные в несколько листов в файле .xlsx:
# Установим `XlsxWriter`
pip install XlsxWriter

# Указать writer библиотеки
writer = pd.ExcelWriter('example.xlsx', engine='xlsxwriter')

# Записать ваш DataFrame в файл
yourData.to_excel(writer, 'Sheet1')

# Сохраним результат
writer.save()
Обратите внимание, что в приведенном выше фрагменте кода вы используете объект ExcelWriter для вывода DataFrame.
Иными словами, вы передаете переменную Writer в функцию to_excel() и также указываете имя листа. Таким образом, вы добавляете лист с данными в существующую рабочую книгу: вы можете использовать ExcelWriter для сохранения нескольких (немного) разных DataFrames в одной рабочей книге.
Все это означает, что если вы просто хотите сохранить один DataFrame в файл, вы также можете обойтись без установки пакета XlsxWriter. Затем вы просто не указываете аргумент движка, который вы передаете в функцию pd.ExcelWriter(). Остальные шаги остаются прежними.
Аналогично функциям, которые вы использовали для чтения в файлах .csv, у вас также есть функция to_csv() для записи результатов обратно в файл, разделенный запятыми. Он снова работает так же, как когда вы использовали его для чтения в файле:
# Запишите DataFrame в csv
df.to_csv("example.csv")
Если вы хотите иметь файл, разделенный табуляцией, вы также можете передать t аргументу sep. Обратите внимание, что есть другие функции, которые вы можете использовать для вывода ваших файлов. Вы можете найти их все здесь.
Пакеты для разбора файлов Excel и обратной записи с помощью Python
Помимо библиотеки Pandas, который вы будете использовать очень часто для загрузки своих данных, вы также можете использовать другие библиотеки для получения ваших данных в Python. Наш обзор основан на этой странице со списком доступных библиотек, которые вы можете использовать для работы с файлами Excel в Python.
Далее вы увидите, как использовать эти библиотеки с помощью некоторых реальных, но упрощенных примеров.
Использование виртуальных сред
Общий совет для установки — делать это в Python virtualenv без системных пакетов. Вы можете использовать virtualenv для создания изолированных сред Python: он создает папку, содержащую все необходимые исполняемые файлы для использования пакетов, которые потребуются проекту Python.
Чтобы начать работать с virtualenv, вам сначала нужно установить его. Затем перейдите в каталог, в который вы хотите поместить свой проект. Создайте virtualenv в этой папке и загрузите в определенную версию Python, если вам это нужно. Затем вы активируете виртуальную среду. После этого вы можете начать загрузку в другие библиотеки, начать работать с ними и т. д.
Совет: не забудьте деактивировать среду, когда закончите!
# Install virtualenv
$ pip install virtualenv

# Go to the folder of your project
$ cd my_folder

# Create a virtual environment `venv`
$ virtualenv venv

# Indicate the Python interpreter to use for `venv`
$ virtualenv -p /usr/bin/python2.7 venv

# Activate `venv`
$ source venv/bin/activate

# Deactivate `venv`
$ deactivate
Обратите внимание, что виртуальная среда может показаться немного проблемной на первый взгляд, когда вы только начинаете работать с данными с Python. И, особенно если у вас есть только один проект, вы можете не понять, зачем вам вообще нужна виртуальная среда.
С ней будет гораздо легче, когда у вас одновременно запущено несколько проектов, и вы не хотите, чтобы они использовали одну и ту же установку Python. Или когда ваши проекты имеют противоречащие друг другу требования, виртуальная среда пригодится!
Теперь вы можете, наконец, начать установку и импорт библиотек, о которых вы читали, и загрузить их в таблицу.
Как читать и записывать файлы Excel с openpyxl
Этот пакет обычно рекомендуется, если вы хотите читать и записывать файлы .xlsx, xlsm, xltx и xltm.
Установите openpyxl с помощью pip: вы видели, как это сделать в предыдущем разделе.
Общий совет для установки этой библиотеки — делать это в виртуальной среде Python без системных библиотек. Вы можете использовать виртуальную среду для создания изолированных сред Python: она создает папку, которая содержит все необходимые исполняемые файлы для использования библиотек, которые потребуются проекту Python.
Перейдите в каталог, в котором находится ваш проект, и повторно активируйте виртуальную среду venv. Затем продолжите установку openpyxl с pip, чтобы убедиться, что вы можете читать и записывать файлы с ним:
# Активируйте virtualenv
$ source activate venv

# Установим `openpyxl` в `venv`
$ pip install openpyxl
Теперь, когда вы установили openpyxl, вы можете загружать данные. Но что это за данные?
Доспутим Excel с данными, которые вы пытаетесь загрузить в Python, содержит следующие листы:
Функция load_workbook() принимает имя файла в качестве аргумента и возвращает объект рабочей книги, который представляет файл. Вы можете проверить это, запустив type (wb). Убедитесь, что вы находитесь в том каталоге, где находится ваша таблица, иначе вы получите error при импорте.
# Import `load_workbook` module from `openpyxl`
from openpyxl import load_workbook

# Load in the workbook
wb = load_workbook('./test.xlsx')

# Get sheet names
print(wb.get_sheet_names())
Помните, что вы можете изменить рабочий каталог с помощью os.chdir().
Вы видите, что фрагмент кода выше возвращает имена листов книги, загруженной в Python.Можете использовать эту информацию, чтобы также получить отдельные листы рабочей книги.
Вы также можете проверить, какой лист в настоящее время активен с wb.active. Как видно из кода ниже, вы можете использовать его для загрузки другого листа из вашей книги:
# Get a sheet by name
sheet = wb.get_sheet_by_name('Sheet3')

# Print the sheet title
sheet.title

# Get currently active sheet
anotherSheet = wb.active

# Check `anotherSheet`
anotherSheet
На первый взгляд, с этими объектами рабочего листа вы не сможете многое сделать.. Однако вы можете извлечь значения из определенных ячеек на листе вашей книги, используя квадратные скобки [], в которые вы передаете точную ячейку, из которой вы хотите получить значение.
Обратите внимание, что это похоже на выбор, получение и индексирование массивов NumPy и Pandas DataFrames, но это не все, что вам нужно сделать, чтобы получить значение. Вам нужно добавить атрибут value:
# Retrieve the value of a certain cell
sheet['A1'].value

# Select element 'B2' of your sheet
c = sheet['B2']

# Retrieve the row number of your element
c.row

# Retrieve the column letter of your element
c.column

# Retrieve the coordinates of the cell
c.coordinate
Как вы можете видеть, помимо значения, есть и другие атрибуты, которые вы можете использовать для проверки вашей ячейки, а именно: row, column и coordinate.
Атрибут row вернет 2;
Добавление атрибута column к c даст вам ‘B’
coordinate вернет ‘B2’.
Вы также можете получить значения ячеек с помощью функции cell(). Передайте row и column, добавьте к этим аргументам значения, соответствующие значениям ячейки, которую вы хотите получить, и, конечно же, не забудьте добавить атрибут value:
# Retrieve cell value
sheet.cell(row=1, column=2).value

# Print out values in column 2
for i in range(1, 4):
     print(i, sheet.cell(row=i, column=2).value)
Обратите внимание, что если вы не укажете атрибут value, вы получите <Cell Sheet3.B1>, который ничего не говорит о значении, которое содержится в этой конкретной ячейке.
Вы видите, что вы используете цикл for с помощью функции range(), чтобы помочь вам распечатать значения строк, имеющих значения в столбце 2. Если эти конкретные ячейки пусты, вы просто вернете None. Если вы хотите узнать больше о циклах for, пройдите наш курс Intermediate Python для Data Science.
Есть специальные функции, которые вы можете вызывать для получения некоторых других значений, например, get_column_letter() и column_index_from_string.
Две функции указывают примерно то, что вы можете получить, используя их, но лучше сделать их четче: хотя вы можете извлечь букву столбца с предшествующего, вы можете сделать обратное или получить адрес столбца, когда вы задаёте букву последнему. Вы можете увидеть, как это работает ниже:
# Импорт необходимых модулей из  `openpyxl.utils`
from openpyxl.utils import get_column_letter, column_index_from_string

# Вывод 'A'
get_column_letter(1)

# Return '1'
column_index_from_string('A')
Вы уже получили значения для строк, которые имеют значения в определенном столбце, но что вам нужно сделать, если вы хотите распечатать строки вашего файла, не сосредотачиваясь только на одном столбце? Использовать другой цикл, конечно!
Например, вы говорите, что хотите сфокусироваться на области между «А1» и «С3», где первая указывает на левый верхний угол, а вторая — на правый нижний угол области, на которой вы хотите сфокусироваться. ,
Эта область будет так называемым cellObj, который вы видите в первой строке кода ниже. Затем вы говорите, что для каждой ячейки, которая находится в этой области, вы печатаете координату и значение, которое содержится в этой ячейке. После конца каждой строки вы печатаете сообщение, которое указывает, что строка этой области cellObj напечатана.
# Напечатать строчку за строчкой
for cellObj in sheet['A1':'C3']:
      for cell in cellObj:
              print(cells.coordinate, cells.value)
      print('--- END ---')
Еще раз обратите внимание, что выбор области очень похож на выбор, получение и индексирование списка и элементов массива NumPy, где вы также используете [] и : для указания области, значения которой вы хотите получить. Кроме того, вышеприведенный цикл также хорошо использует атрибуты ячейки!
Чтобы сделать вышеприведенное объяснение и код наглядным, вы можете проверить результат, который вы получите после завершения цикла:
('A1', u'M')
('B1', u'N')
('C1', u'O')
--- END ---
('A2', 10L)
('B2', 11L)
('C2', 12L)
--- END ---
('A3', 14L)
('B3', 15L)
('C3', 16L)
--- END ---
Наконец, есть некоторые атрибуты, которые вы можете использовать для проверки результата вашего импорта, а именно max_row и max_column. Эти атрибуты, конечно, и так — общие способы проверки правильности загрузки данных, но они все равно полезны.
# Вывести максимальное количество строк
sheet.max_row

# Вывести максимальное количество колонок
sheet.max_column
Наверное, вы думаете, что такой способ работы с этими файлами сложноват, особенно если вы еще хотите манипулировать данными.
Должно быть что-то попроще, верно? Так и есть!
openpyxl поддерживает Pandas DataFrames! Вы можете использовать функцию DataFrame() из библиотеки Pandas, чтобы поместить значения листа в DataFrame:
# Import `pandas`
import pandas as pd

# конвертировать Лист в DataFrame
df = pd.DataFrame(sheet.values)
Если вы хотите указать заголовки и индексы, вам нужно добавить немного больше кода:
# Put the sheet values in `data`
data = sheet.values

# Indicate the columns in the sheet values
cols = next(data)[1:]

# Convert your data to a list
data = list(data)

# Read in the data at index 0 for the indices
idx = [r[0] for r in data]

# Slice the data at index 1
data = (islice(r, 1, None) for r in data)

# Make your DataFrame
df = pd.DataFrame(data, index=idx, columns=cols)
Затем вы можете начать манипулировать данными со всеми функциями, которые предлагает библиотека Pandas. Но помните, что вы находитесь в виртуальной среде, поэтому, если библиотека еще не представлена, вам нужно будет установить ее снова через pip.
Чтобы записать ваши Pandas DataFrames обратно в файл Excel, вы можете легко использовать функцию dataframe_to_rows() из модуля utils:
# Import `dataframe_to_rows`
from openpyxl.utils.dataframe import dataframe_to_rows

# Initialize a workbook
wb = Workbook()

# Get the worksheet in the active workbook
ws = wb.active

# Append the rows of the DataFrame to your worksheet
for r in dataframe_to_rows(df, index=True, header=True):
    ws.append(r)
Но это точно не все! Библиотека openpyxl предлагает вам высокую гибкость при записи ваших данных обратно в файлы Excel, изменении стилей ячеек или использовании режима write-only. Эту библиотеку обязательно нужно знать, когда вы часто работаете с электронными таблицами ,
Совет: читайте больше о том, как вы можете изменить стили ячеек, перейти в режим write-only или как библиотека работает с NumPy здесь.
Теперь давайте также рассмотрим некоторые другие библиотеки, которые вы можете использовать для получения данных вашей электронной таблицы в Python.
Прежде чем закрыть этот раздел, не забудьте отключить виртуальную среду, когда закончите!
Чтение и форматирование Excel-файлов: xlrd
Эта библиотека идеально подходит для чтения и форматирования данных из Excel с расширением xls или xlsx.
# Import `xlrd`
import xlrd

# Open a workbook
workbook = xlrd.open_workbook('example.xls')

# Loads only current sheets to memory
workbook = xlrd.open_workbook('example.xls', on_demand = True)
Когда вам не нужны данные из всей Excel-книги, вы можете использовать функции sheet_by_name() или sheet_by_index() для получения листов, которые вы хотите получить в своём анализе
# Load a specific sheet by name
worksheet = workbook.sheet_by_name('Sheet1')

# Load a specific sheet by index
worksheet = workbook.sheet_by_index(0)

# Retrieve the value from cell at indices (0,0)
sheet.cell(0, 0).value
Также можно получить значение в определённых ячейках с вашего листа.
Перейдите к xlwt и xlutils, чтобы узнать больше о том, как они относятся к библиотеке xlrd.
Запись данных в Excel-файлы с xlwt
Если вы хотите создать таблицу со своими данными, вы можете использовать не только библиотеку XlsWriter, но и xlwt. xlwt идеально подходит для записи данных и форматирования информации в файлах с расширением .xls
Когда вы вручную создаёте файл:
# Import `xlwt`
import xlwt

# Initialize a workbook
book = xlwt.Workbook(encoding="utf-8")

# Add a sheet to the workbook
sheet1 = book.add_sheet("Python Sheet 1")

# Write to the sheet of the workbook
sheet1.write(0, 0, "This is the First Cell of the First Sheet")

# Save the workbook
book.save("spreadsheet.xls")
Если вы хотите записать данные в файл, но не хотите делать все самостоятельно, вы всегда можете прибегнуть к циклу for, чтобы автоматизировать весь процесс. Составьте сценарий, в котором вы создаёте книгу и в которую добавляете лист. Укажите список со столбцами и один со значениями, которые будут заполнены на листе.
Далее у вас есть цикл for, который гарантирует, что все значения попадают в файл: вы говорите, что для каждого элемента в диапазоне от 0 до 4 (5 не включительно) вы собираетесь что-то делать. Вы будете заполнять значения построчно. Для этого вы указываете элемент строки, который появляется в каждом цикле. Далее у вас есть еще один цикл for, который будет проходить по столбцам вашего листа. Вы говорите, что для каждой строки на листе, вы будете смотреть на столбцы, которые идут с ним, и вы будете заполнять значение для каждого столбца в строке. Заполнив все столбцы строки значениями, вы перейдете к следующей строке, пока не останется строк.
# Initialize a workbook
book = xlwt.Workbook()

# Add a sheet to the workbook
sheet1 = book.add_sheet("Sheet1")

# The data
cols = ["A", "B", "C", "D", "E"]
txt = [0,1,2,3,4]

# Loop over the rows and columns and fill in the values
for num in range(5):
      row = sheet1.row(num)
      for index, col in enumerate(cols):
          value = txt[index] + num
          row.write(index, value)

# Save the result
book.save("test.xls")
На скриншоте ниже представлен результат выполнения этого кода:
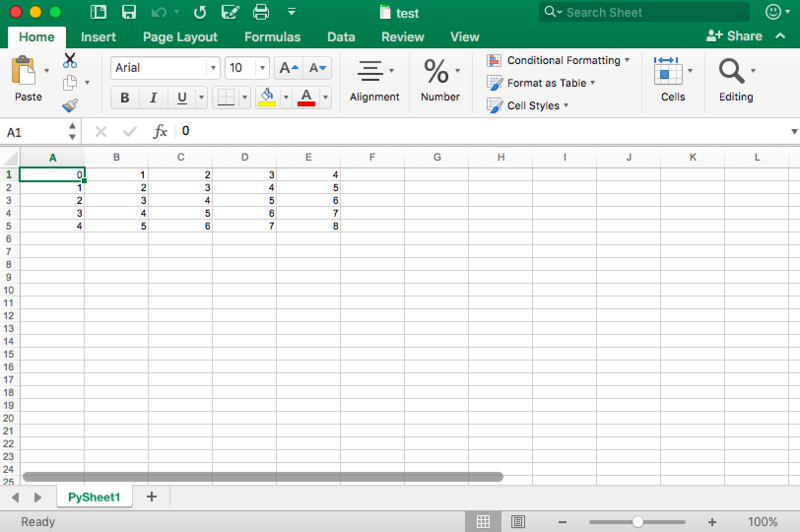
Теперь, когда вы увидели, как xlrd и xlwt работают друг с другом, пришло время взглянуть на библиотеку, которая тесно связана с этими двумя: xlutils.
Сборник утилит: xlutils
Эта библиотека — сборник утилит, для которого требуются и xlrd и xlwt, и которая может копировать, изменять и фильтровать существующие данные. О том, как пользоваться этими командами рассказано в разделе по openpyxl.
Вернитесь в раздел openpyxl, чтобы получить больше информации о том, как использовать этот пакет для получения данных в Python.
Использование pyexcel для чтения .xls или .xlsx файлов
Еще одна библиотека, которую можно использовать для чтения данных электронных таблиц в Python — это pyexcel; Python Wrapper, который предоставляет один API для чтения, записи и работы с данными в файлах .csv, .ods, .xls, .xlsx и .xlsm. Конечно, для этого урока вы просто сосредоточитесь на файлах .xls и .xls.
Чтобы получить ваши данные в массиве, вы можете использовать функцию get_array(), которая содержится в пакете pyexcel:
# Import `pyexcel`
import pyexcel

# Get an array from the data
my_array = pyexcel.get_array(file_name="test.xls")
Вы также можете получить свои данные в упорядоченном словаре списков. Вы можете использовать функцию get_dict():
# Import `OrderedDict` module
from pyexcel._compact import OrderedDict

# Get your data in an ordered dictionary of lists
my_dict = pyexcel.get_dict(file_name="test.xls", name_columns_by_row=0)

# Get your data in a dictionary of 2D arrays
book_dict = pyexcel.get_book_dict(file_name="test.xls")
Здесь видно, что если вы хотите получить словарь двумерных массивов или получить все листы рабочей книги в одном словаре, вы можете прибегнуть к get_book_dict().
Помните, что эти две структуры данных, которые были упомянуты выше, массивы и словари вашей таблицы, позволяют вам создавать DataFrames ваших данных с помощью pd.DataFrame(). Это облегчит обработку данных.
Кроме того, вы можете просто получить записи из таблицы с помощью pyexcel благодаря функции get_records(). Просто передайте аргумент file_name в функцию, и вы получите список словарей:
# Retrieve the records of the file
records = pyexcel.get_records(file_name="test.xls")
Чтобы узнать, как управлять списками Python, ознакомьтесь с примерами из документации о списках Python.
Запись в файл с pyexcel
С помощью этой библиотеки можно не только загружать данные в массивы, вы также можете экспортировать свои массивы обратно в таблицу. Используйте функцию save_as() и передайте массив и имя файла назначения в аргумент dest_file_name:
# Get the data
data = [[1, 2, 3], [4, 5, 6], [7, 8, 9]]

# Save the array to a file
pyexcel.save_as(array=data, dest_file_name="array_data.xls")
Обратите внимание, что если вы хотите указать разделитель, вы можете добавить аргумент dest_delimiter и передать символ, который вы хотите использовать в качестве разделителя между «».
Однако если у вас есть словарь, вам нужно использовать функцию save_book_as(). Передайте двумерный словарь в bookdict и укажите имя файла:
# The data
2d_array_dictionary = {'Sheet 1': [
                                   ['ID', 'AGE', 'SCORE']
                                   [1, 22, 5],
                                   [2, 15, 6],
                                   [3, 28, 9]
                                  ],
                       'Sheet 2': [
                                    ['X', 'Y', 'Z'],
                                    [1, 2, 3],
                                    [4, 5, 6]
                                    [7, 8, 9]
                                  ],
                       'Sheet 3': [
                                    ['M', 'N', 'O', 'P'],
                                    [10, 11, 12, 13],
                                    [14, 15, 16, 17]
                                    [18, 19, 20, 21]
                                   ]}

# Save the data to a file
pyexcel.save_book_as(bookdict=2d_array_dictionary, dest_file_name="2d_array_data.xls")
При использовании кода, напечатанного в приведенном выше примере, важно помнить, что порядок ваших данных в словаре не будет сохранен. Если вы не хотите этого, вам нужно сделать небольшой обход. Вы можете прочитать все об этом здесь.
Чтение и запись .csv файлов
Если вы все еще ищете библиотеки, которые позволяют загружать и записывать данные в файлы .csv, кроме Pandas, лучше всего использовать пакет csv:
# import `csv`
import csv

# Read in csv file
for row in csv.reader(open('data.csv'), delimiter=','):
      print(row)

# Write csv file
data = [[1, 2, 3], [4, 5, 6], [7, 8, 9]]
outfile = open('data.csv', 'w')
writer = csv.writer(outfile, delimiter=';', quotechar='"')
writer.writerows(data)
outfile.close()
Обратите внимание, что в пакете NumPy есть функция genfromtxt(), которая позволяет загружать данные, содержащиеся в файлах .csv, в массивы, которые затем можно поместить в DataFrames.
Финальная проверка данных
Когда у вас есть данные, не забудьте последний шаг: проверить, правильно ли загружены данные. Если вы поместили свои данные в DataFrame, вы можете легко и быстро проверить, был ли импорт успешным, выполнив следующие команды:
# Check the first entries of the DataFrame
df1.head()

# Check the last entries of the DataFrame
df1.tail()
Если у вас есть данные в массиве, вы можете проверить их, используя следующие атрибуты массива: shape, ndim, dtype и т.д .:
# Inspect the shape
data.shape

# Inspect the number of dimensions
data.ndim

# Inspect the data type
data.dtype
Что дальше?
Поздравляем! Вы успешно прошли наш урок и научились читать файлы Excel на Python.
Если вы хотите продолжить работу над этой темой, попробуйте воспользоваться PyXll, который позволяет писать функции в Python и вызывать их в Excel.
You can easily import an Excel file into Python using Pandas. In order to accomplish this goal, you’ll need to use read_excel:
import pandas as pd

df = pd.read_excel(r'Path where the Excel file is storedFile name.xlsx')
print(df)
Note that for an earlier version of Excel, you may need to use the file extension of ‘xls’
And if you have a specific Excel sheet that you’d like to import, you may then apply:
import pandas as pd

df = pd.read_excel(r'Path of Excel fileFile name.xlsx', sheet_name='your Excel sheet name')
print(df)
Let’s now review an example that includes the data to be imported into Python.
The Data to be Imported into Python
Suppose that you have the following table stored in Excel (where the Excel file name is ‘products‘):
| product_name | price |
| computer | 700 |
| tablet | 250 |
| printer | 120 |
| laptop | 1200 |
| keyboard | 100 |
You may then follow the steps below to import the Excel file into Python.
Step 1: Capture the file path
First, capture the full path where the Excel file is stored on your computer.
For example, let’s suppose that an Excel file is stored under the following path:
C:UsersRonDesktopproducts.xlsx
In the Python code below, you’ll need to modify the path name to reflect the location where the Excel file is stored on your computer.
Don’t forget to include the file name (in our example, it’s ‘products‘ as highlighted in blue). You’ll also need to include the Excel file extension (in our case, it’s ‘.xlsx‘ as highlighted in green).
Step 2: Apply the Python code
Here is the Python code for our example:
import pandas as pd

df = pd.read_excel(r'C:UsersRonDesktopproducts.xlsx')
print(df)
Note that you should place “r” before the path string to address special characters, such as ‘’. In addition, don’t forget to put the file name at the end of the path + ‘.xlsx’
Step 3: Run the Python code to import the Excel file
Run the Python code (adjusted to your path), and you’ll get the following dataset:
  product_name  price
0     computer    700
1       tablet    250
2      printer    120
3       laptop   1200
4     keyboard    100
Notice that you got the same results as those that were stored in the Excel file.
Note: you’ll have to install an additional package if you get the following error when running the code:
ImportError: Missing optional dependency ‘xlrd’
You may then use the PIP install approach to install openpyxl for .xlsx files:
pip install openpyxl
Optional Step: Selecting subset of columns
Now what if you want to select a specific column or columns from the Excel file?
For example, what if you want to select only the product_name column? If that’s the case, you can specify this column name as captured below:
import pandas as pd

data = pd.read_excel(r'C:UsersRonDesktopproducts.xlsx')
df = pd.DataFrame(data, columns=['product_name'])
print(df)
Run the code (after adjusting the file path), and you’ll get only the product_name column:
  product_name
0     computer
1       tablet
2      printer
3       laptop
4     keyboard
You can specify additional columns by separating their names using a comma, so if you want to include both the product_name and price columns, you can use this syntax:
import pandas as pd

data = pd.read_excel(r'C:UsersRonDesktopproducts.xlsx')
df = pd.DataFrame(data, columns=['product_name', 'price'])
print(df)
You’ll need to make sure that the column names specified in the code exactly match with the column names within the Excel file. Otherwise, you’ll get NaN values.
Conclusion
You just saw how to import an Excel file into Python using Pandas.
At times, you may need to import a CSV file into Python. If that’s the case, you may want to check the following tutorial that explains how to import a CSV file into Python using Pandas.
You may also check the Pandas Documentation to find out more about the different options that you may apply in regards to read_excel.