
Узнайте, как читать и импортировать файлы Excel в Python, как записывать данные в эти таблицы и какие библиотеки лучше всего подходят для этого.
Известный вам инструмент для организации, анализа и хранения ваших данных в таблицах — Excel — применяется и в data science. В какой-то момент вам придется иметь дело с этими таблицами, но работать именно с ними вы будете не всегда. Вот почему разработчики Python реализовали способы чтения, записи и управления не только этими файлами, но и многими другими типами файлов.
Из этого учебника узнаете, как можете работать с Excel и Python. Внутри найдете обзор библиотек, которые вы можете использовать для загрузки и записи этих таблиц в файлы с помощью Python. Вы узнаете, как работать с такими библиотеками, как pandas, openpyxl, xlrd, xlutils и pyexcel.
Данные как ваша отправная точка
Когда вы начинаете проект по data science, вам придется работать с данными, которые вы собрали по всему интернету, и с наборами данных, которые вы загрузили из других мест — Kaggle, Quandl и тд
Но чаще всего вы также найдете данные в Google или в репозиториях, которые используются другими пользователями. Эти данные могут быть в файле Excel или сохранены в файл с расширением .csv … Возможности могут иногда казаться бесконечными, но когда у вас есть данные, в первую очередь вы должны убедиться, что они качественные.
В случае с электронной таблицей вы можете не только проверить, могут ли эти данные ответить на вопрос исследования, который вы имеете в виду, но также и можете ли вы доверять данным, которые хранятся в электронной таблице.
Проверяем качество таблицы
- Представляет ли электронная таблица статические данные?
- Смешивает ли она данные, расчеты и отчетность?
- Являются ли данные в вашей электронной таблице полными и последовательными?
- Имеет ли ваша таблица систематизированную структуру рабочего листа?
- Проверяли ли вы действительные формулы в электронной таблице?
Этот список вопросов поможет убедиться, что ваша таблица не грешит против лучших практик, принятых в отрасли. Конечно, этот список не исчерпывающий, но позволит провести базовую проверку таблицы.
Лучшие практики для данных электронных таблиц
Прежде чем приступить к чтению вашей электронной таблицы на Python, вы также должны подумать о том, чтобы настроить свой файл в соответствии с некоторыми основными принципами, такими как:
- Первая строка таблицы обычно зарезервирована для заголовка, а первый столбец используется для идентификации единицы выборки;
- Избегайте имен, значений или полей с пробелами. В противном случае каждое слово будет интерпретироваться как отдельная переменная, что приведет к ошибкам, связанным с количеством элементов на строку в вашем наборе данных. По возможности, используйте:
- подчеркивания,
- тире,
- горбатый регистр, где первая буква каждого слова пишется с большой буквы
- объединяющие слова
- Короткие имена предпочтительнее длинных имен;
- старайтесь не использовать имена, которые содержат символы ?, $,%, ^, &, *, (,), -, #,? ,,, <,>, /, |, , [,], {, и };
- Удалите все комментарии, которые вы сделали в вашем файле, чтобы избежать добавления в ваш файл лишних столбцов или NA;
- Убедитесь, что все пропущенные значения в вашем наборе данных обозначены как NA.
Затем, после того, как вы внесли необходимые изменения или тщательно изучили свои данные, убедитесь, что вы сохранили внесенные изменения. Сделав это, вы можете вернуться к данным позже, чтобы отредактировать их, добавить дополнительные данные или изменить их, сохранив формулы, которые вы, возможно, использовали для расчета данных и т.д.
Если вы работаете с Microsoft Excel, вы можете сохранить файл в разных форматах: помимо расширения по умолчанию .xls или .xlsx, вы можете перейти на вкладку «Файл», нажать «Сохранить как» и выбрать одно из расширений, которые указаны в качестве параметров «Сохранить как тип». Наиболее часто используемые расширения для сохранения наборов данных в data science — это .csv и .txt (в виде текстового файла с разделителями табуляции). В зависимости от выбранного варианта сохранения поля вашего набора данных разделяются вкладками или запятыми, которые образуют символы-разделители полей вашего набора данных.
Теперь, когда вы проверили и сохранили ваши данные, вы можете начать с подготовки вашего рабочего окружения.
Готовим рабочее окружение
Как убедиться, что вы все делаете хорошо? Проверить рабочее окружение!
Когда вы работаете в терминале, вы можете сначала перейти в каталог, в котором находится ваш файл, а затем запустить Python. Убедитесь, что файл лежит именно в том каталоге, к которому вы обратились.
Возможно, вы уже начали сеанс Python и у вас нет подсказок о каталоге, в котором вы работаете. Тогда можно выполнить следующие команды:
# Import `os`
import os

# Retrieve current working directory (`cwd`)
cwd = os.getcwd()
cwd

# Change directory
os.chdir("/path/to/your/folder")

# List all files and directories in current directory
os.listdir('.')
Круто, да?
Вы увидите, что эти команды очень важны не только для загрузки ваших данных, но и для дальнейшего анализа. А пока давайте продолжим: вы прошли все проверки, вы сохранили свои данные и подготовили рабочее окружение.
Можете ли вы начать с чтения данных в Python?
Установите библиотеки для чтения и записи файлов Excel
Даже если вы еще не знаете, какие библиотеки вам понадобятся для импорта ваших данных, вы должны убедиться, что у вас есть все, что нужно для установки этих библиотек, когда придет время.
Подготовка к дополнительной рабочей области: pip
Вот почему вам нужно установить pip и setuptools. Если у вас установлен Python2 ⩾ 2.7.9 или Python3 ⩾ 3.4, то можно не беспокоиться — просто убедитесь, что вы обновились до последней версии.
Для этого выполните следующую команду в своем терминале:
# Для Linux/OS X
pip install -U pip setuptools

# Для Windows
python -m pip install -U pip setuptools
Если вы еще не установили pip, запустите скрипт python get-pip.py, который вы можете найти здесь. Следуйте инструкциям по установке.
Установка Anaconda
Другой вариант для работы в data science — установить дистрибутив Anaconda Python. Сделав это, вы получите простой и быстрый способ начать заниматься data science, потому что вам не нужно беспокоиться об установке отдельных библиотек, необходимых для работы.
Это особенно удобно, если вы новичок, но даже для более опытных разработчиков это способ быстро протестировать некоторые вещи без необходимости устанавливать каждую библиотеку отдельно.
Anaconda включает в себя 100 самых популярных библиотек Python, R и Scala для науки о данных и несколько сред разработки с открытым исходным кодом, таких как Jupyter и Spyder.
Установить Anaconda можно здесь. Следуйте инструкциям по установке, и вы готовы начать!
Загрузить файлы Excel в виде фреймов Pandas
Все, среда настроена, вы готовы начать импорт ваших файлов.
Один из способов, который вы часто используете для импорта ваших файлов для обработки данных, — с помощью библиотеки Pandas. Она основана на NumPy и предоставляет простые в использовании структуры данных и инструменты анализа данных Python.
Эта мощная и гибкая библиотека очень часто используется дата-инженерами для передачи своих данных в структуры данных, очень выразительных для их анализа.
Если у вас уже есть Pandas, доступные через Anaconda, вы можете просто загрузить свои файлы в Pandas DataFrames с помощью pd.Excelfile():
# импорт библиотеки pandas
import pandas as pd

# Загружаем ваш файл в переменную `file` / вместо 'example' укажите название свого файла из текущей директории
file = 'example.xlsx'

# Загружаем spreadsheet в объект pandas
xl = pd.ExcelFile(file)

# Печатаем название листов в данном файле
print(xl.sheet_names)

# Загрузить лист в DataFrame по его имени: df1
df1 = xl.parse('Sheet1')
Если вы не установили Anaconda, просто выполните pip install pandas, чтобы установить библиотеку Pandas в вашей среде, а затем выполните команды, которые включены в фрагмент кода выше.
Проще простого, да?
Для чтения в файлах .csv у вас есть аналогичная функция для загрузки данных в DataFrame: read_csv(). Вот пример того, как вы можете использовать эту функцию:
# Импорт библиотеки pandas
import pandas as pd

# Загрузить csv файл
df = pd.read_csv("example.csv")
Разделитель, который будет учитывать эта функция, по умолчанию является запятой, но вы можете указать альтернативный разделитель, если хотите. Перейдите к документации, чтобы узнать, какие другие аргументы вы можете указать для успешного импорта!
Обратите внимание, что есть также функции read_table() и read_fwf() для чтения файлов и таблиц с фиксированной шириной в формате DataFrames с общим разделителем. Для первой функции разделителем по умолчанию является вкладка, но вы можете снова переопределить это, а также указать альтернативный символ-разделитель. Более того, есть и другие функции, которые вы можете использовать для получения данных в DataFrames: вы можете найти их здесь.
Как записать Pandas DataFrames в файлы Excel
Допустим, что после анализа данных вы хотите записать данные обратно в новый файл. Есть также способ записать ваши Pandas DataFrames обратно в файлы с помощью функции to_excel().
Но, прежде чем использовать эту функцию, убедитесь, что у вас установлен XlsxWriter, если вы хотите записать свои данные в несколько листов в файле .xlsx:
# Установим `XlsxWriter`
pip install XlsxWriter

# Указать writer библиотеки
writer = pd.ExcelWriter('example.xlsx', engine='xlsxwriter')

# Записать ваш DataFrame в файл
yourData.to_excel(writer, 'Sheet1')

# Сохраним результат
writer.save()
Обратите внимание, что в приведенном выше фрагменте кода вы используете объект ExcelWriter для вывода DataFrame.
Иными словами, вы передаете переменную Writer в функцию to_excel() и также указываете имя листа. Таким образом, вы добавляете лист с данными в существующую рабочую книгу: вы можете использовать ExcelWriter для сохранения нескольких (немного) разных DataFrames в одной рабочей книге.
Все это означает, что если вы просто хотите сохранить один DataFrame в файл, вы также можете обойтись без установки пакета XlsxWriter. Затем вы просто не указываете аргумент движка, который вы передаете в функцию pd.ExcelWriter(). Остальные шаги остаются прежними.
Аналогично функциям, которые вы использовали для чтения в файлах .csv, у вас также есть функция to_csv() для записи результатов обратно в файл, разделенный запятыми. Он снова работает так же, как когда вы использовали его для чтения в файле:
# Запишите DataFrame в csv
df.to_csv("example.csv")
Если вы хотите иметь файл, разделенный табуляцией, вы также можете передать t аргументу sep. Обратите внимание, что есть другие функции, которые вы можете использовать для вывода ваших файлов. Вы можете найти их все здесь.
Пакеты для разбора файлов Excel и обратной записи с помощью Python
Помимо библиотеки Pandas, который вы будете использовать очень часто для загрузки своих данных, вы также можете использовать другие библиотеки для получения ваших данных в Python. Наш обзор основан на этой странице со списком доступных библиотек, которые вы можете использовать для работы с файлами Excel в Python.
Далее вы увидите, как использовать эти библиотеки с помощью некоторых реальных, но упрощенных примеров.
Использование виртуальных сред
Общий совет для установки — делать это в Python virtualenv без системных пакетов. Вы можете использовать virtualenv для создания изолированных сред Python: он создает папку, содержащую все необходимые исполняемые файлы для использования пакетов, которые потребуются проекту Python.
Чтобы начать работать с virtualenv, вам сначала нужно установить его. Затем перейдите в каталог, в который вы хотите поместить свой проект. Создайте virtualenv в этой папке и загрузите в определенную версию Python, если вам это нужно. Затем вы активируете виртуальную среду. После этого вы можете начать загрузку в другие библиотеки, начать работать с ними и т. д.
Совет: не забудьте деактивировать среду, когда закончите!
# Install virtualenv
$ pip install virtualenv

# Go to the folder of your project
$ cd my_folder

# Create a virtual environment `venv`
$ virtualenv venv

# Indicate the Python interpreter to use for `venv`
$ virtualenv -p /usr/bin/python2.7 venv

# Activate `venv`
$ source venv/bin/activate

# Deactivate `venv`
$ deactivate
Обратите внимание, что виртуальная среда может показаться немного проблемной на первый взгляд, когда вы только начинаете работать с данными с Python. И, особенно если у вас есть только один проект, вы можете не понять, зачем вам вообще нужна виртуальная среда.
С ней будет гораздо легче, когда у вас одновременно запущено несколько проектов, и вы не хотите, чтобы они использовали одну и ту же установку Python. Или когда ваши проекты имеют противоречащие друг другу требования, виртуальная среда пригодится!
Теперь вы можете, наконец, начать установку и импорт библиотек, о которых вы читали, и загрузить их в таблицу.
Как читать и записывать файлы Excel с openpyxl
Этот пакет обычно рекомендуется, если вы хотите читать и записывать файлы .xlsx, xlsm, xltx и xltm.
Установите openpyxl с помощью pip: вы видели, как это сделать в предыдущем разделе.
Общий совет для установки этой библиотеки — делать это в виртуальной среде Python без системных библиотек. Вы можете использовать виртуальную среду для создания изолированных сред Python: она создает папку, которая содержит все необходимые исполняемые файлы для использования библиотек, которые потребуются проекту Python.
Перейдите в каталог, в котором находится ваш проект, и повторно активируйте виртуальную среду venv. Затем продолжите установку openpyxl с pip, чтобы убедиться, что вы можете читать и записывать файлы с ним:
# Активируйте virtualenv
$ source activate venv

# Установим `openpyxl` в `venv`
$ pip install openpyxl
Теперь, когда вы установили openpyxl, вы можете загружать данные. Но что это за данные?
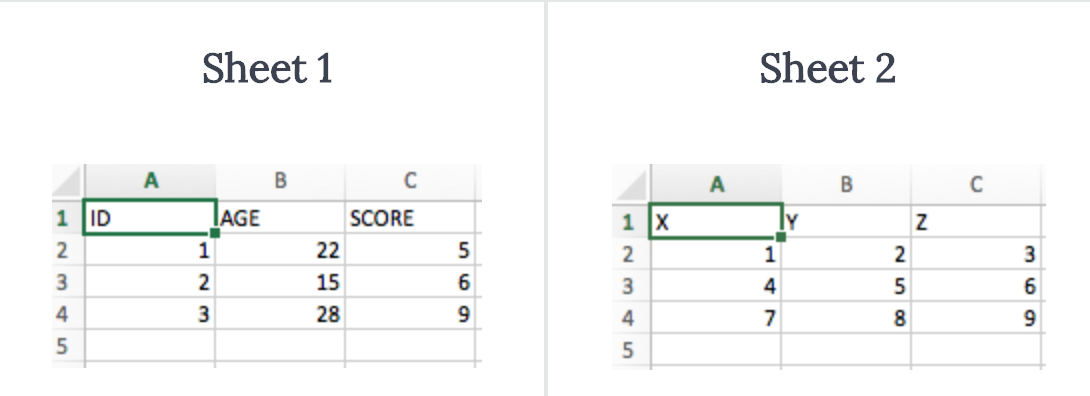
Доспутим Excel с данными, которые вы пытаетесь загрузить в Python, содержит следующие листы:
Функция load_workbook() принимает имя файла в качестве аргумента и возвращает объект рабочей книги, который представляет файл. Вы можете проверить это, запустив type (wb). Убедитесь, что вы находитесь в том каталоге, где находится ваша таблица, иначе вы получите error при импорте.
# Import `load_workbook` module from `openpyxl`
from openpyxl import load_workbook

# Load in the workbook
wb = load_workbook('./test.xlsx')

# Get sheet names
print(wb.get_sheet_names())
Помните, что вы можете изменить рабочий каталог с помощью os.chdir().
Вы видите, что фрагмент кода выше возвращает имена листов книги, загруженной в Python.Можете использовать эту информацию, чтобы также получить отдельные листы рабочей книги.
Вы также можете проверить, какой лист в настоящее время активен с wb.active. Как видно из кода ниже, вы можете использовать его для загрузки другого листа из вашей книги:
# Get a sheet by name
sheet = wb.get_sheet_by_name('Sheet3')

# Print the sheet title
sheet.title

# Get currently active sheet
anotherSheet = wb.active

# Check `anotherSheet`
anotherSheet
На первый взгляд, с этими объектами рабочего листа вы не сможете многое сделать.. Однако вы можете извлечь значения из определенных ячеек на листе вашей книги, используя квадратные скобки [], в которые вы передаете точную ячейку, из которой вы хотите получить значение.
Обратите внимание, что это похоже на выбор, получение и индексирование массивов NumPy и Pandas DataFrames, но это не все, что вам нужно сделать, чтобы получить значение. Вам нужно добавить атрибут value:
# Retrieve the value of a certain cell
sheet['A1'].value

# Select element 'B2' of your sheet
c = sheet['B2']

# Retrieve the row number of your element
c.row

# Retrieve the column letter of your element
c.column

# Retrieve the coordinates of the cell
c.coordinate
Как вы можете видеть, помимо значения, есть и другие атрибуты, которые вы можете использовать для проверки вашей ячейки, а именно: row, column и coordinate.
Атрибут row вернет 2;
Добавление атрибута column к c даст вам ‘B’
coordinate вернет ‘B2’.
Вы также можете получить значения ячеек с помощью функции cell(). Передайте row и column, добавьте к этим аргументам значения, соответствующие значениям ячейки, которую вы хотите получить, и, конечно же, не забудьте добавить атрибут value:
# Retrieve cell value
sheet.cell(row=1, column=2).value

# Print out values in column 2
for i in range(1, 4):
     print(i, sheet.cell(row=i, column=2).value)
Обратите внимание, что если вы не укажете атрибут value, вы получите <Cell Sheet3.B1>, который ничего не говорит о значении, которое содержится в этой конкретной ячейке.
Вы видите, что вы используете цикл for с помощью функции range(), чтобы помочь вам распечатать значения строк, имеющих значения в столбце 2. Если эти конкретные ячейки пусты, вы просто вернете None. Если вы хотите узнать больше о циклах for, пройдите наш курс Intermediate Python для Data Science.
Есть специальные функции, которые вы можете вызывать для получения некоторых других значений, например, get_column_letter() и column_index_from_string.
Две функции указывают примерно то, что вы можете получить, используя их, но лучше сделать их четче: хотя вы можете извлечь букву столбца с предшествующего, вы можете сделать обратное или получить адрес столбца, когда вы задаёте букву последнему. Вы можете увидеть, как это работает ниже:
# Импорт необходимых модулей из  `openpyxl.utils`
from openpyxl.utils import get_column_letter, column_index_from_string

# Вывод 'A'
get_column_letter(1)

# Return '1'
column_index_from_string('A')
Вы уже получили значения для строк, которые имеют значения в определенном столбце, но что вам нужно сделать, если вы хотите распечатать строки вашего файла, не сосредотачиваясь только на одном столбце? Использовать другой цикл, конечно!
Например, вы говорите, что хотите сфокусироваться на области между «А1» и «С3», где первая указывает на левый верхний угол, а вторая — на правый нижний угол области, на которой вы хотите сфокусироваться. ,
Эта область будет так называемым cellObj, который вы видите в первой строке кода ниже. Затем вы говорите, что для каждой ячейки, которая находится в этой области, вы печатаете координату и значение, которое содержится в этой ячейке. После конца каждой строки вы печатаете сообщение, которое указывает, что строка этой области cellObj напечатана.
# Напечатать строчку за строчкой
for cellObj in sheet['A1':'C3']:
      for cell in cellObj:
              print(cells.coordinate, cells.value)
      print('--- END ---')
Еще раз обратите внимание, что выбор области очень похож на выбор, получение и индексирование списка и элементов массива NumPy, где вы также используете [] и : для указания области, значения которой вы хотите получить. Кроме того, вышеприведенный цикл также хорошо использует атрибуты ячейки!
Чтобы сделать вышеприведенное объяснение и код наглядным, вы можете проверить результат, который вы получите после завершения цикла:
('A1', u'M')
('B1', u'N')
('C1', u'O')
--- END ---
('A2', 10L)
('B2', 11L)
('C2', 12L)
--- END ---
('A3', 14L)
('B3', 15L)
('C3', 16L)
--- END ---
Наконец, есть некоторые атрибуты, которые вы можете использовать для проверки результата вашего импорта, а именно max_row и max_column. Эти атрибуты, конечно, и так — общие способы проверки правильности загрузки данных, но они все равно полезны.
# Вывести максимальное количество строк
sheet.max_row

# Вывести максимальное количество колонок
sheet.max_column
Наверное, вы думаете, что такой способ работы с этими файлами сложноват, особенно если вы еще хотите манипулировать данными.
Должно быть что-то попроще, верно? Так и есть!
openpyxl поддерживает Pandas DataFrames! Вы можете использовать функцию DataFrame() из библиотеки Pandas, чтобы поместить значения листа в DataFrame:
# Import `pandas`
import pandas as pd

# конвертировать Лист в DataFrame
df = pd.DataFrame(sheet.values)
Если вы хотите указать заголовки и индексы, вам нужно добавить немного больше кода:
# Put the sheet values in `data`
data = sheet.values

# Indicate the columns in the sheet values
cols = next(data)[1:]

# Convert your data to a list
data = list(data)

# Read in the data at index 0 for the indices
idx = [r[0] for r in data]

# Slice the data at index 1
data = (islice(r, 1, None) for r in data)

# Make your DataFrame
df = pd.DataFrame(data, index=idx, columns=cols)
Затем вы можете начать манипулировать данными со всеми функциями, которые предлагает библиотека Pandas. Но помните, что вы находитесь в виртуальной среде, поэтому, если библиотека еще не представлена, вам нужно будет установить ее снова через pip.
Чтобы записать ваши Pandas DataFrames обратно в файл Excel, вы можете легко использовать функцию dataframe_to_rows() из модуля utils:
# Import `dataframe_to_rows`
from openpyxl.utils.dataframe import dataframe_to_rows

# Initialize a workbook
wb = Workbook()

# Get the worksheet in the active workbook
ws = wb.active

# Append the rows of the DataFrame to your worksheet
for r in dataframe_to_rows(df, index=True, header=True):
    ws.append(r)
Но это точно не все! Библиотека openpyxl предлагает вам высокую гибкость при записи ваших данных обратно в файлы Excel, изменении стилей ячеек или использовании режима write-only. Эту библиотеку обязательно нужно знать, когда вы часто работаете с электронными таблицами ,
Совет: читайте больше о том, как вы можете изменить стили ячеек, перейти в режим write-only или как библиотека работает с NumPy здесь.
Теперь давайте также рассмотрим некоторые другие библиотеки, которые вы можете использовать для получения данных вашей электронной таблицы в Python.
Прежде чем закрыть этот раздел, не забудьте отключить виртуальную среду, когда закончите!
Чтение и форматирование Excel-файлов: xlrd
Эта библиотека идеально подходит для чтения и форматирования данных из Excel с расширением xls или xlsx.
# Import `xlrd`
import xlrd

# Open a workbook
workbook = xlrd.open_workbook('example.xls')

# Loads only current sheets to memory
workbook = xlrd.open_workbook('example.xls', on_demand = True)
Когда вам не нужны данные из всей Excel-книги, вы можете использовать функции sheet_by_name() или sheet_by_index() для получения листов, которые вы хотите получить в своём анализе
# Load a specific sheet by name
worksheet = workbook.sheet_by_name('Sheet1')

# Load a specific sheet by index
worksheet = workbook.sheet_by_index(0)

# Retrieve the value from cell at indices (0,0)
sheet.cell(0, 0).value
Также можно получить значение в определённых ячейках с вашего листа.
Перейдите к xlwt и xlutils, чтобы узнать больше о том, как они относятся к библиотеке xlrd.
Запись данных в Excel-файлы с xlwt
Если вы хотите создать таблицу со своими данными, вы можете использовать не только библиотеку XlsWriter, но и xlwt. xlwt идеально подходит для записи данных и форматирования информации в файлах с расширением .xls
Когда вы вручную создаёте файл:
# Import `xlwt`
import xlwt

# Initialize a workbook
book = xlwt.Workbook(encoding="utf-8")

# Add a sheet to the workbook
sheet1 = book.add_sheet("Python Sheet 1")

# Write to the sheet of the workbook
sheet1.write(0, 0, "This is the First Cell of the First Sheet")

# Save the workbook
book.save("spreadsheet.xls")
Если вы хотите записать данные в файл, но не хотите делать все самостоятельно, вы всегда можете прибегнуть к циклу for, чтобы автоматизировать весь процесс. Составьте сценарий, в котором вы создаёте книгу и в которую добавляете лист. Укажите список со столбцами и один со значениями, которые будут заполнены на листе.
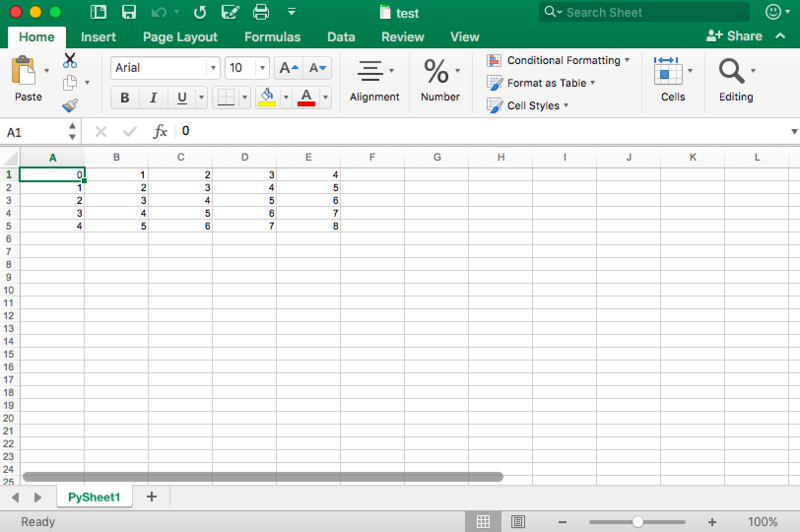
Далее у вас есть цикл for, который гарантирует, что все значения попадают в файл: вы говорите, что для каждого элемента в диапазоне от 0 до 4 (5 не включительно) вы собираетесь что-то делать. Вы будете заполнять значения построчно. Для этого вы указываете элемент строки, который появляется в каждом цикле. Далее у вас есть еще один цикл for, который будет проходить по столбцам вашего листа. Вы говорите, что для каждой строки на листе, вы будете смотреть на столбцы, которые идут с ним, и вы будете заполнять значение для каждого столбца в строке. Заполнив все столбцы строки значениями, вы перейдете к следующей строке, пока не останется строк.
# Initialize a workbook
book = xlwt.Workbook()

# Add a sheet to the workbook
sheet1 = book.add_sheet("Sheet1")

# The data
cols = ["A", "B", "C", "D", "E"]
txt = [0,1,2,3,4]

# Loop over the rows and columns and fill in the values
for num in range(5):
      row = sheet1.row(num)
      for index, col in enumerate(cols):
          value = txt[index] + num
          row.write(index, value)

# Save the result
book.save("test.xls")
На скриншоте ниже представлен результат выполнения этого кода:
Теперь, когда вы увидели, как xlrd и xlwt работают друг с другом, пришло время взглянуть на библиотеку, которая тесно связана с этими двумя: xlutils.
Сборник утилит: xlutils
Эта библиотека — сборник утилит, для которого требуются и xlrd и xlwt, и которая может копировать, изменять и фильтровать существующие данные. О том, как пользоваться этими командами рассказано в разделе по openpyxl.
Вернитесь в раздел openpyxl, чтобы получить больше информации о том, как использовать этот пакет для получения данных в Python.
Использование pyexcel для чтения .xls или .xlsx файлов
Еще одна библиотека, которую можно использовать для чтения данных электронных таблиц в Python — это pyexcel; Python Wrapper, который предоставляет один API для чтения, записи и работы с данными в файлах .csv, .ods, .xls, .xlsx и .xlsm. Конечно, для этого урока вы просто сосредоточитесь на файлах .xls и .xls.
Чтобы получить ваши данные в массиве, вы можете использовать функцию get_array(), которая содержится в пакете pyexcel:
# Import `pyexcel`
import pyexcel

# Get an array from the data
my_array = pyexcel.get_array(file_name="test.xls")
Вы также можете получить свои данные в упорядоченном словаре списков. Вы можете использовать функцию get_dict():
# Import `OrderedDict` module
from pyexcel._compact import OrderedDict

# Get your data in an ordered dictionary of lists
my_dict = pyexcel.get_dict(file_name="test.xls", name_columns_by_row=0)

# Get your data in a dictionary of 2D arrays
book_dict = pyexcel.get_book_dict(file_name="test.xls")
Здесь видно, что если вы хотите получить словарь двумерных массивов или получить все листы рабочей книги в одном словаре, вы можете прибегнуть к get_book_dict().
Помните, что эти две структуры данных, которые были упомянуты выше, массивы и словари вашей таблицы, позволяют вам создавать DataFrames ваших данных с помощью pd.DataFrame(). Это облегчит обработку данных.
Кроме того, вы можете просто получить записи из таблицы с помощью pyexcel благодаря функции get_records(). Просто передайте аргумент file_name в функцию, и вы получите список словарей:
# Retrieve the records of the file
records = pyexcel.get_records(file_name="test.xls")
Чтобы узнать, как управлять списками Python, ознакомьтесь с примерами из документации о списках Python.
Запись в файл с pyexcel
С помощью этой библиотеки можно не только загружать данные в массивы, вы также можете экспортировать свои массивы обратно в таблицу. Используйте функцию save_as() и передайте массив и имя файла назначения в аргумент dest_file_name:
# Get the data
data = [[1, 2, 3], [4, 5, 6], [7, 8, 9]]

# Save the array to a file
pyexcel.save_as(array=data, dest_file_name="array_data.xls")
Обратите внимание, что если вы хотите указать разделитель, вы можете добавить аргумент dest_delimiter и передать символ, который вы хотите использовать в качестве разделителя между «».
Однако если у вас есть словарь, вам нужно использовать функцию save_book_as(). Передайте двумерный словарь в bookdict и укажите имя файла:
# The data
2d_array_dictionary = {'Sheet 1': [
                                   ['ID', 'AGE', 'SCORE']
                                   [1, 22, 5],
                                   [2, 15, 6],
                                   [3, 28, 9]
                                  ],
                       'Sheet 2': [
                                    ['X', 'Y', 'Z'],
                                    [1, 2, 3],
                                    [4, 5, 6]
                                    [7, 8, 9]
                                  ],
                       'Sheet 3': [
                                    ['M', 'N', 'O', 'P'],
                                    [10, 11, 12, 13],
                                    [14, 15, 16, 17]
                                    [18, 19, 20, 21]
                                   ]}

# Save the data to a file
pyexcel.save_book_as(bookdict=2d_array_dictionary, dest_file_name="2d_array_data.xls")
При использовании кода, напечатанного в приведенном выше примере, важно помнить, что порядок ваших данных в словаре не будет сохранен. Если вы не хотите этого, вам нужно сделать небольшой обход. Вы можете прочитать все об этом здесь.
Чтение и запись .csv файлов
Если вы все еще ищете библиотеки, которые позволяют загружать и записывать данные в файлы .csv, кроме Pandas, лучше всего использовать пакет csv:
# import `csv`
import csv

# Read in csv file
for row in csv.reader(open('data.csv'), delimiter=','):
      print(row)

# Write csv file
data = [[1, 2, 3], [4, 5, 6], [7, 8, 9]]
outfile = open('data.csv', 'w')
writer = csv.writer(outfile, delimiter=';', quotechar='"')
writer.writerows(data)
outfile.close()
Обратите внимание, что в пакете NumPy есть функция genfromtxt(), которая позволяет загружать данные, содержащиеся в файлах .csv, в массивы, которые затем можно поместить в DataFrames.
Финальная проверка данных
Когда у вас есть данные, не забудьте последний шаг: проверить, правильно ли загружены данные. Если вы поместили свои данные в DataFrame, вы можете легко и быстро проверить, был ли импорт успешным, выполнив следующие команды:
# Check the first entries of the DataFrame
df1.head()

# Check the last entries of the DataFrame
df1.tail()
Если у вас есть данные в массиве, вы можете проверить их, используя следующие атрибуты массива: shape, ndim, dtype и т.д .:
# Inspect the shape
data.shape

# Inspect the number of dimensions
data.ndim

# Inspect the data type
data.dtype
Что дальше?
Поздравляем! Вы успешно прошли наш урок и научились читать файлы Excel на Python.
Если вы хотите продолжить работу над этой темой, попробуйте воспользоваться PyXll, который позволяет писать функции в Python и вызывать их в Excel.
You can easily import an Excel file into Python using Pandas. In order to accomplish this goal, you’ll need to use read_excel:
import pandas as pd

df = pd.read_excel(r'Path where the Excel file is storedFile name.xlsx')
print(df)
Note that for an earlier version of Excel, you may need to use the file extension of ‘xls’
And if you have a specific Excel sheet that you’d like to import, you may then apply:
import pandas as pd

df = pd.read_excel(r'Path of Excel fileFile name.xlsx', sheet_name='your Excel sheet name')
print(df)
Let’s now review an example that includes the data to be imported into Python.
The Data to be Imported into Python
Suppose that you have the following table stored in Excel (where the Excel file name is ‘products‘):
| product_name | price |
| computer | 700 |
| tablet | 250 |
| printer | 120 |
| laptop | 1200 |
| keyboard | 100 |
You may then follow the steps below to import the Excel file into Python.
Step 1: Capture the file path
First, capture the full path where the Excel file is stored on your computer.
For example, let’s suppose that an Excel file is stored under the following path:
C:UsersRonDesktopproducts.xlsx
In the Python code below, you’ll need to modify the path name to reflect the location where the Excel file is stored on your computer.
Don’t forget to include the file name (in our example, it’s ‘products‘ as highlighted in blue). You’ll also need to include the Excel file extension (in our case, it’s ‘.xlsx‘ as highlighted in green).
Step 2: Apply the Python code
Here is the Python code for our example:
import pandas as pd

df = pd.read_excel(r'C:UsersRonDesktopproducts.xlsx')
print(df)
Note that you should place “r” before the path string to address special characters, such as ‘’. In addition, don’t forget to put the file name at the end of the path + ‘.xlsx’
Step 3: Run the Python code to import the Excel file
Run the Python code (adjusted to your path), and you’ll get the following dataset:
  product_name  price
0     computer    700
1       tablet    250
2      printer    120
3       laptop   1200
4     keyboard    100
Notice that you got the same results as those that were stored in the Excel file.
Note: you’ll have to install an additional package if you get the following error when running the code:
ImportError: Missing optional dependency ‘xlrd’
You may then use the PIP install approach to install openpyxl for .xlsx files:
pip install openpyxl
Optional Step: Selecting subset of columns
Now what if you want to select a specific column or columns from the Excel file?
For example, what if you want to select only the product_name column? If that’s the case, you can specify this column name as captured below:
import pandas as pd

data = pd.read_excel(r'C:UsersRonDesktopproducts.xlsx')
df = pd.DataFrame(data, columns=['product_name'])
print(df)
Run the code (after adjusting the file path), and you’ll get only the product_name column:
  product_name
0     computer
1       tablet
2      printer
3       laptop
4     keyboard
You can specify additional columns by separating their names using a comma, so if you want to include both the product_name and price columns, you can use this syntax:
import pandas as pd

data = pd.read_excel(r'C:UsersRonDesktopproducts.xlsx')
df = pd.DataFrame(data, columns=['product_name', 'price'])
print(df)
You’ll need to make sure that the column names specified in the code exactly match with the column names within the Excel file. Otherwise, you’ll get NaN values.
Conclusion
You just saw how to import an Excel file into Python using Pandas.
At times, you may need to import a CSV file into Python. If that’s the case, you may want to check the following tutorial that explains how to import a CSV file into Python using Pandas.
You may also check the Pandas Documentation to find out more about the different options that you may apply in regards to read_excel.
Improve Article
Save Article
Like Article
Improve Article
Save Article
Like Article
It is not always possible to get the dataset in CSV format. So, Pandas provides us the functions to convert datasets in other formats to the Data frame. An excel file has a ‘.xlsx’ format.
Before we get started, we need to install a few libraries.
pip install pandas
pip install xlrd
For importing an Excel file into Python using Pandas we have to use pandas.read_excel() function.
Syntax: pandas.read_excel(io, sheet_name=0, header=0, names=None,….)
Return: DataFrame or dict of DataFrames.
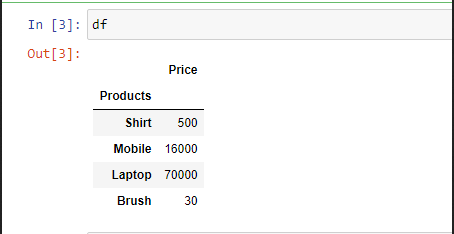
Let’s suppose the Excel file looks like this:
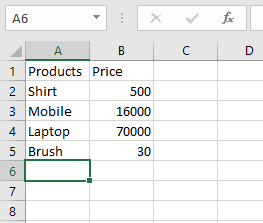
Now, we can dive into the code.
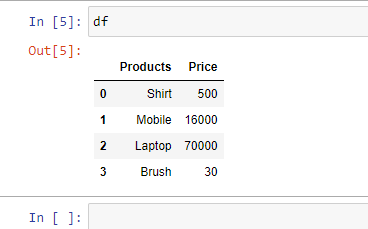
Example 1: Read an Excel file.
Python3
import pandas as pd
df = pd.read_excel("sample.xlsx")
print(df)
Output:
Example 2: To select a particular column, we can pass a parameter “index_col“.
Python3
import pandas as pd
df = pd.read_excel("sample.xlsx",
index_col = 0)
print(df)
Output:
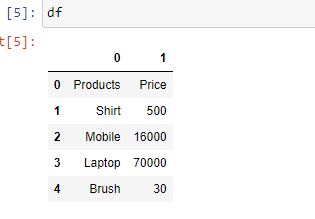
Example 3: In case you don’t prefer the initial heading of the columns, you can change it to indexes using the parameter “header”.
Python3
import pandas as pd
df = pd.read_excel('sample.xlsx',
header = None)
print(df)
Output:
Example 4: If you want to change the data type of a particular column you can do it using the parameter “dtype“.
Python3
import pandas as pd
df = pd.read_excel('sample.xlsx',
dtype = {"Products": str,
"Price":float})
print(df)
Output:
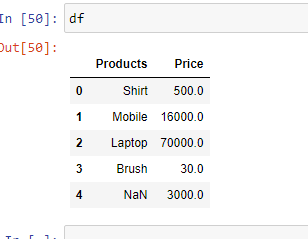
Example 5: In case you have unknown values, then you can handle it using the parameter “na_values“. It will convert the mentioned unknown values into “NaN”
Python3
import pandas as pd
df = pd.read_excel('sample.xlsx',
na_values =['item1',
'item2'])
print(df)
Output:
Like Article
Save Article
Why learn to work with Excel with Python? Excel is one of the most popular and widely-used data tools; it’s hard to find an organization that doesn’t work with it in some way. From analysts, to sales VPs, to CEOs, various professionals use Excel for both quick stats and serious data crunching.
With Excel being so pervasive, data professionals must be familiar with it. Working with data in Python or R offers serious advantages over Excel’s UI, so finding a way to work with Excel using code is critical. Thankfully, there’s a great tool already out there for using Excel with Python called pandas.
Pandas has excellent methods for reading all kinds of data from Excel files. You can also export your results from pandas back to Excel, if that’s preferred by your intended audience. Pandas is great for other routine data analysis tasks, such as:
- quick Exploratory Data Analysis (EDA)
- drawing attractive plots
- feeding data into machine learning tools like scikit-learn
- building machine learning models on your data
- taking cleaned and processed data to any number of data tools
Pandas is better at automating data processing tasks than Excel, including processing Excel files.
In this tutorial, we are going to show you how to work with Excel files in pandas. We will cover the following concepts.
- setting up your computer with the necessary software
- reading in data from Excel files into pandas
- data exploration in pandas
- visualizing data in pandas using the matplotlib visualization library
- manipulating and reshaping data in pandas
- moving data from pandas into Excel
Note that this tutorial does not provide a deep dive into pandas. To explore pandas more, check out our course.
System Prerequisites
We will use Python 3 and Jupyter Notebook to demonstrate the code in this tutorial.In addition to Python and Jupyter Notebook, you will need the following Python modules:
- matplotlib — data visualization
- NumPy — numerical data functionality
- OpenPyXL — read/write Excel 2010 xlsx/xlsm files
- pandas — data import, clean-up, exploration, and analysis
- xlrd — read Excel data
- xlwt — write to Excel
- XlsxWriter — write to Excel (xlsx) files
There are multiple ways to get set up with all the modules. We cover three of the most common scenarios below.
- If you have Python installed via Anaconda package manager, you can install the required modules using the command
conda install. For example, to install pandas, you would execute the command —conda install pandas. - If you already have a regular, non-Anaconda Python installed on the computer, you can install the required modules using
pip. Open your command line program and execute commandpip install <module name>to install a module. You should replace<module name>with the actual name of the module you are trying to install. For example, to install pandas, you would execute command —pip install pandas. - If you don’t have Python already installed, you should get it through the Anaconda package manager. Anaconda provides installers for Windows, Mac, and Linux Computers. If you choose the full installer, you will get all the modules you need, along with Python and pandas within a single package. This is the easiest and fastest way to get started.
The Data Set
In this tutorial, we will use a multi-sheet Excel file we created from Kaggle’s IMDB Scores data. You can download the file here.
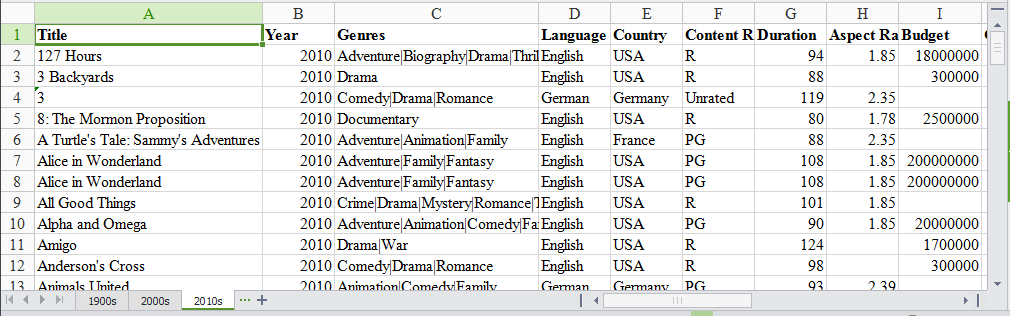
Our Excel file has three sheets: ‘1900s,’ ‘2000s,’ and ‘2010s.’ Each sheet has data for movies from those years.
We will use this data set to find the ratings distribution for the movies, visualize movies with highest ratings and net earnings and calculate statistical information about the movies. We will be analyzing and exploring this data using Python and pandas, thus demonstrating pandas capabilities for working with Excel data in Python.
Read data from the Excel file
We need to first import the data from the Excel file into pandas. To do that, we start by importing the pandas module.
import pandas as pdWe then use the pandas’ read_excel method to read in data from the Excel file. The easiest way to call this method is to pass the file name. If no sheet name is specified then it will read the first sheet in the index (as shown below).
excel_file = 'movies.xls'
movies = pd.read_excel(excel_file)
Here, the read_excel method read the data from the Excel file into a pandas DataFrame object. Pandas defaults to storing data in DataFrames. We then stored this DataFrame into a variable called movies.
Pandas has a built-in DataFrame.head() method that we can use to easily display the first few rows of our DataFrame. If no argument is passed, it will display first five rows. If a number is passed, it will display the equal number of rows from the top.
movies.head()| Title | Year | Genres | Language | Country | Content Rating | Duration | Aspect Ratio | Budget | Gross Earnings | … | Facebook Likes — Actor 1 | Facebook Likes — Actor 2 | Facebook Likes — Actor 3 | Facebook Likes — cast Total | Facebook likes — Movie | Facenumber in posters | User Votes | Reviews by Users | Reviews by Crtiics | IMDB Score | |
|---|---|---|---|---|---|---|---|---|---|---|---|---|---|---|---|---|---|---|---|---|---|
| 0 | Intolerance: Love’s Struggle Throughout the Ages | 1916 | Drama|History|War | NaN | USA | Not Rated | 123 | 1.33 | 385907.0 | NaN | … | 436 | 22 | 9.0 | 481 | 691 | 1 | 10718 | 88 | 69.0 | 8.0 |
| 1 | Over the Hill to the Poorhouse | 1920 | Crime|Drama | NaN | USA | NaN | 110 | 1.33 | 100000.0 | 3000000.0 | … | 2 | 2 | 0.0 | 4 | 0 | 1 | 5 | 1 | 1.0 | 4.8 |
| 2 | The Big Parade | 1925 | Drama|Romance|War | NaN | USA | Not Rated | 151 | 1.33 | 245000.0 | NaN | … | 81 | 12 | 6.0 | 108 | 226 | 0 | 4849 | 45 | 48.0 | 8.3 |
| 3 | Metropolis | 1927 | Drama|Sci-Fi | German | Germany | Not Rated | 145 | 1.33 | 6000000.0 | 26435.0 | … | 136 | 23 | 18.0 | 203 | 12000 | 1 | 111841 | 413 | 260.0 | 8.3 |
| 4 | Pandora’s Box | 1929 | Crime|Drama|Romance | German | Germany | Not Rated | 110 | 1.33 | NaN | 9950.0 | … | 426 | 20 | 3.0 | 455 | 926 | 1 | 7431 | 84 | 71.0 | 8.0 |
5 rows × 25 columns
Excel files quite often have multiple sheets and the ability to read a specific sheet or all of them is very important. To make this easy, the pandas read_excel method takes an argument called sheetname that tells pandas which sheet to read in the data from. For this, you can either use the sheet name or the sheet number. Sheet numbers start with zero. If the sheetname argument is not given, it defaults to zero and pandas will import the first sheet.
By default, pandas will automatically assign a numeric index or row label starting with zero. You may want to leave the default index as such if your data doesn’t have a column with unique values that can serve as a better index. In case there is a column that you feel would serve as a better index, you can override the default behavior by setting index_col property to a column. It takes a numeric value for setting a single column as index or a list of numeric values for creating a multi-index.
In the below code, we are choosing the first column, ‘Title’, as index (index=0) by passing zero to the index_col argument.
movies_sheet1 = pd.read_excel(excel_file, sheetname=0, index_col=0)
movies_sheet1.head()| Year | Genres | Language | Country | Content Rating | Duration | Aspect Ratio | Budget | Gross Earnings | Director | … | Facebook Likes — Actor 1 | Facebook Likes — Actor 2 | Facebook Likes — Actor 3 | Facebook Likes — cast Total | Facebook likes — Movie | Facenumber in posters | User Votes | Reviews by Users | Reviews by Crtiics | IMDB Score | |
|---|---|---|---|---|---|---|---|---|---|---|---|---|---|---|---|---|---|---|---|---|---|
| Title | |||||||||||||||||||||
| Intolerance: Love’s Struggle Throughout the Ages | 1916 | Drama|History|War | NaN | USA | Not Rated | 123 | 1.33 | 385907.0 | NaN | D.W. Griffith | … | 436 | 22 | 9.0 | 481 | 691 | 1 | 10718 | 88 | 69.0 | 8.0 |
| Over the Hill to the Poorhouse | 1920 | Crime|Drama | NaN | USA | NaN | 110 | 1.33 | 100000.0 | 3000000.0 | Harry F. Millarde | … | 2 | 2 | 0.0 | 4 | 0 | 1 | 5 | 1 | 1.0 | 4.8 |
| The Big Parade | 1925 | Drama|Romance|War | NaN | USA | Not Rated | 151 | 1.33 | 245000.0 | NaN | King Vidor | … | 81 | 12 | 6.0 | 108 | 226 | 0 | 4849 | 45 | 48.0 | 8.3 |
| Metropolis | 1927 | Drama|Sci-Fi | German | Germany | Not Rated | 145 | 1.33 | 6000000.0 | 26435.0 | Fritz Lang | … | 136 | 23 | 18.0 | 203 | 12000 | 1 | 111841 | 413 | 260.0 | 8.3 |
| Pandora’s Box | 1929 | Crime|Drama|Romance | German | Germany | Not Rated | 110 | 1.33 | NaN | 9950.0 | Georg Wilhelm Pabst | … | 426 | 20 | 3.0 | 455 | 926 | 1 | 7431 | 84 | 71.0 | 8.0 |
5 rows × 24 columns
As you noticed above, our Excel data file has three sheets. We already read the first sheet in a DataFrame above. Now, using the same syntax, we will read in rest of the two sheets too.
movies_sheet2 = pd.read_excel(excel_file, sheetname=1, index_col=0)
movies_sheet2.head()| Year | Genres | Language | Country | Content Rating | Duration | Aspect Ratio | Budget | Gross Earnings | Director | … | Facebook Likes — Actor 1 | Facebook Likes — Actor 2 | Facebook Likes — Actor 3 | Facebook Likes — cast Total | Facebook likes — Movie | Facenumber in posters | User Votes | Reviews by Users | Reviews by Crtiics | IMDB Score | |
|---|---|---|---|---|---|---|---|---|---|---|---|---|---|---|---|---|---|---|---|---|---|
| Title | |||||||||||||||||||||
| 102 Dalmatians | 2000 | Adventure|Comedy|Family | English | USA | G | 100.0 | 1.85 | 85000000.0 | 66941559.0 | Kevin Lima | … | 2000.0 | 795.0 | 439.0 | 4182 | 372 | 1 | 26413 | 77.0 | 84.0 | 4.8 |
| 28 Days | 2000 | Comedy|Drama | English | USA | PG-13 | 103.0 | 1.37 | 43000000.0 | 37035515.0 | Betty Thomas | … | 12000.0 | 10000.0 | 664.0 | 23864 | 0 | 1 | 34597 | 194.0 | 116.0 | 6.0 |
| 3 Strikes | 2000 | Comedy | English | USA | R | 82.0 | 1.85 | 6000000.0 | 9821335.0 | DJ Pooh | … | 939.0 | 706.0 | 585.0 | 3354 | 118 | 1 | 1415 | 10.0 | 22.0 | 4.0 |
| Aberdeen | 2000 | Drama | English | UK | NaN | 106.0 | 1.85 | 6500000.0 | 64148.0 | Hans Petter Moland | … | 844.0 | 2.0 | 0.0 | 846 | 260 | 0 | 2601 | 35.0 | 28.0 | 7.3 |
| All the Pretty Horses | 2000 | Drama|Romance|Western | English | USA | PG-13 | 220.0 | 2.35 | 57000000.0 | 15527125.0 | Billy Bob Thornton | … | 13000.0 | 861.0 | 820.0 | 15006 | 652 | 2 | 11388 | 183.0 | 85.0 | 5.8 |
5 rows × 24 columns
movies_sheet3 = pd.read_excel(excel_file, sheetname=2, index_col=0)
movies_sheet3.head()| Year | Genres | Language | Country | Content Rating | Duration | Aspect Ratio | Budget | Gross Earnings | Director | … | Facebook Likes — Actor 1 | Facebook Likes — Actor 2 | Facebook Likes — Actor 3 | Facebook Likes — cast Total | Facebook likes — Movie | Facenumber in posters | User Votes | Reviews by Users | Reviews by Crtiics | IMDB Score | |
|---|---|---|---|---|---|---|---|---|---|---|---|---|---|---|---|---|---|---|---|---|---|
| Title | |||||||||||||||||||||
| 127 Hours | 2010.0 | Adventure|Biography|Drama|Thriller | English | USA | R | 94.0 | 1.85 | 18000000.0 | 18329466.0 | Danny Boyle | … | 11000.0 | 642.0 | 223.0 | 11984 | 63000 | 0.0 | 279179 | 440.0 | 450.0 | 7.6 |
| 3 Backyards | 2010.0 | Drama | English | USA | R | 88.0 | NaN | 300000.0 | NaN | Eric Mendelsohn | … | 795.0 | 659.0 | 301.0 | 1884 | 92 | 0.0 | 554 | 23.0 | 20.0 | 5.2 |
| 3 | 2010.0 | Comedy|Drama|Romance | German | Germany | Unrated | 119.0 | 2.35 | NaN | 59774.0 | Tom Tykwer | … | 24.0 | 20.0 | 9.0 | 69 | 2000 | 0.0 | 4212 | 18.0 | 76.0 | 6.8 |
| 8: The Mormon Proposition | 2010.0 | Documentary | English | USA | R | 80.0 | 1.78 | 2500000.0 | 99851.0 | Reed Cowan | … | 191.0 | 12.0 | 5.0 | 210 | 0 | 0.0 | 1138 | 30.0 | 28.0 | 7.1 |
| A Turtle’s Tale: Sammy’s Adventures | 2010.0 | Adventure|Animation|Family | English | France | PG | 88.0 | 2.35 | NaN | NaN | Ben Stassen | … | 783.0 | 749.0 | 602.0 | 3874 | 0 | 2.0 | 5385 | 22.0 | 56.0 | 6.1 |
5 rows × 24 columns
Since all the three sheets have similar data but for different recordsmovies, we will create a single DataFrame from all the three DataFrames we created above. We will use the pandas concat method for this and pass in the names of the three DataFrames we just created and assign the results to a new DataFrame object, movies. By keeping the DataFrame name same as before, we are over-writing the previously created DataFrame.
movies = pd.concat([movies_sheet1, movies_sheet2, movies_sheet3])We can check if this concatenation by checking the number of rows in the combined DataFrame by calling the method shape on it that will give us the number of rows and columns.
movies.shape(5042, 24)Using the ExcelFile class to read multiple sheets
We can also use the ExcelFile class to work with multiple sheets from the same Excel file. We first wrap the Excel file using ExcelFile and then pass it to read_excel method.
xlsx = pd.ExcelFile(excel_file)
movies_sheets = []
for sheet in xlsx.sheet_names:
   movies_sheets.append(xlsx.parse(sheet))
movies = pd.concat(movies_sheets)
If you are reading an Excel file with a lot of sheets and are creating a lot of DataFrames, ExcelFile is more convenient and efficient in comparison to read_excel. With ExcelFile, you only need to pass the Excel file once, and then you can use it to get the DataFrames. When using read_excel, you pass the Excel file every time and hence the file is loaded again for every sheet. This can be a huge performance drag if the Excel file has many sheets with a large number of rows.
Exploring the data
Now that we have read in the movies data set from our Excel file, we can start exploring it using pandas. A pandas DataFrame stores the data in a tabular format, just like the way Excel displays the data in a sheet. Pandas has a lot of built-in methods to explore the DataFrame we created from the Excel file we just read in.
We already introduced the method head in the previous section that displays few rows from the top from the DataFrame. Let’s look at few more methods that come in handy while exploring the data set.
We can use the shape method to find out the number of rows and columns for the DataFrame.
movies.shape(5042, 25)This tells us our Excel file has 5042 records and 25 columns or observations. This can be useful in reporting the number of records and columns and comparing that with the source data set.
We can use the tail method to view the bottom rows. If no parameter is passed, only the bottom five rows are returned.
movies.tail()| Title | Year | Genres | Language | Country | Content Rating | Duration | Aspect Ratio | Budget | Gross Earnings | … | Facebook Likes — Actor 1 | Facebook Likes — Actor 2 | Facebook Likes — Actor 3 | Facebook Likes — cast Total | Facebook likes — Movie | Facenumber in posters | User Votes | Reviews by Users | Reviews by Crtiics | IMDB Score | |
|---|---|---|---|---|---|---|---|---|---|---|---|---|---|---|---|---|---|---|---|---|---|
| 1599 | War & Peace | NaN | Drama|History|Romance|War | English | UK | TV-14 | NaN | 16.00 | NaN | NaN | … | 1000.0 | 888.0 | 502.0 | 4528 | 11000 | 1.0 | 9277 | 44.0 | 10.0 | 8.2 |
| 1600 | Wings | NaN | Comedy|Drama | English | USA | NaN | 30.0 | 1.33 | NaN | NaN | … | 685.0 | 511.0 | 424.0 | 1884 | 1000 | 5.0 | 7646 | 56.0 | 19.0 | 7.3 |
| 1601 | Wolf Creek | NaN | Drama|Horror|Thriller | English | Australia | NaN | NaN | 2.00 | NaN | NaN | … | 511.0 | 457.0 | 206.0 | 1617 | 954 | 0.0 | 726 | 6.0 | 2.0 | 7.1 |
| 1602 | Wuthering Heights | NaN | Drama|Romance | English | UK | NaN | 142.0 | NaN | NaN | NaN | … | 27000.0 | 698.0 | 427.0 | 29196 | 0 | 2.0 | 6053 | 33.0 | 9.0 | 7.7 |
| 1603 | Yu-Gi-Oh! Duel Monsters | NaN | Action|Adventure|Animation|Family|Fantasy | Japanese | Japan | NaN | 24.0 | NaN | NaN | NaN | … | 0.0 | NaN | NaN | 0 | 124 | 0.0 | 12417 | 51.0 | 6.0 | 7.0 |
5 rows × 25 columns
In Excel, you’re able to sort a sheet based on the values in one or more columns. In pandas, you can do the same thing with the sort_values method. For example, let’s sort our movies DataFrame based on the Gross Earnings column.
sorted_by_gross = movies.sort_values(['Gross Earnings'], ascending=False)Since we have the data sorted by values in a column, we can do few interesting things with it. For example, we can display the top 10 movies by Gross Earnings.
sorted_by_gross["Gross Earnings"].head(10)1867 760505847.0
1027 658672302.0
1263 652177271.0
610 623279547.0
611 623279547.0
1774 533316061.0
1281 474544677.0
226 460935665.0
1183 458991599.0
618 448130642.0
Name: Gross Earnings, dtype: float64We can also create a plot for the top 10 movies by Gross Earnings. Pandas makes it easy to visualize your data with plots and charts through matplotlib, a popular data visualization library. With a couple lines of code, you can start plotting. Moreover, matplotlib plots work well inside Jupyter Notebooks since you can displace the plots right under the code.
First, we import the matplotlib module and set matplotlib to display the plots right in the Jupyter Notebook.
import matplotlib.pyplot as plt%matplotlib inlineWe will draw a bar plot where each bar will represent one of the top 10 movies. We can do this by calling the plot method and setting the argument kind to barh. This tells matplotlib to draw a horizontal bar plot.
sorted_by_gross['Gross Earnings'].head(10).plot(kind="barh")
plt.show()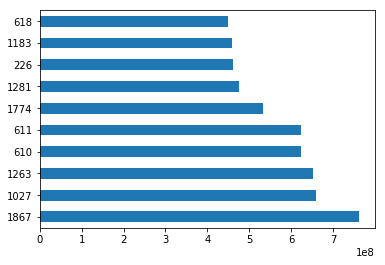
Let’s create a histogram of IMDB Scores to check the distribution of IMDB Scores across all movies. Histograms are a good way to visualize the distribution of a data set. We use the plot method on the IMDB Scores series from our movies DataFrame and pass it the argument.
movies['IMDB Score'].plot(kind="hist")
plt.show()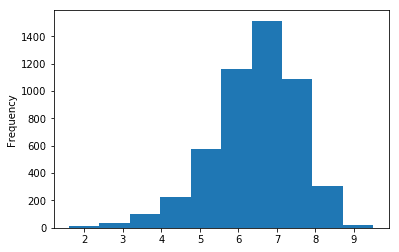
This data visualization suggests that most of the IMDB Scores fall between six and eight.
Getting statistical information about the data
Pandas has some very handy methods to look at the statistical data about our data set. For example, we can use the describe method to get a statistical summary of the data set.
movies.describe()| Year | Duration | Aspect Ratio | Budget | Gross Earnings | Facebook Likes — Director | Facebook Likes — Actor 1 | Facebook Likes — Actor 2 | Facebook Likes — Actor 3 | Facebook Likes — cast Total | Facebook likes — Movie | Facenumber in posters | User Votes | Reviews by Users | Reviews by Crtiics | IMDB Score | |
|---|---|---|---|---|---|---|---|---|---|---|---|---|---|---|---|---|
| count | 4935.000000 | 5028.000000 | 4714.000000 | 4.551000e+03 | 4.159000e+03 | 4938.000000 | 5035.000000 | 5029.000000 | 5020.000000 | 5042.000000 | 5042.000000 | 5029.000000 | 5.042000e+03 | 5022.000000 | 4993.000000 | 5042.000000 |
| mean | 2002.470517 | 107.201074 | 2.220403 | 3.975262e+07 | 4.846841e+07 | 686.621709 | 6561.323932 | 1652.080533 | 645.009761 | 9700.959143 | 7527.457160 | 1.371446 | 8.368475e+04 | 272.770808 | 140.194272 | 6.442007 |
| std | 12.474599 | 25.197441 | 1.385113 | 2.061149e+08 | 6.845299e+07 | 2813.602405 | 15021.977635 | 4042.774685 | 1665.041728 | 18165.101925 | 19322.070537 | 2.013683 | 1.384940e+05 | 377.982886 | 121.601675 | 1.125189 |
| min | 1916.000000 | 7.000000 | 1.180000 | 2.180000e+02 | 1.620000e+02 | 0.000000 | 0.000000 | 0.000000 | 0.000000 | 0.000000 | 0.000000 | 0.000000 | 5.000000e+00 | 1.000000 | 1.000000 | 1.600000 |
| 25% | 1999.000000 | 93.000000 | 1.850000 | 6.000000e+06 | 5.340988e+06 | 7.000000 | 614.500000 | 281.000000 | 133.000000 | 1411.250000 | 0.000000 | 0.000000 | 8.599250e+03 | 65.000000 | 50.000000 | 5.800000 |
| 50% | 2005.000000 | 103.000000 | 2.350000 | 2.000000e+07 | 2.551750e+07 | 49.000000 | 988.000000 | 595.000000 | 371.500000 | 3091.000000 | 166.000000 | 1.000000 | 3.437100e+04 | 156.000000 | 110.000000 | 6.600000 |
| 75% | 2011.000000 | 118.000000 | 2.350000 | 4.500000e+07 | 6.230944e+07 | 194.750000 | 11000.000000 | 918.000000 | 636.000000 | 13758.750000 | 3000.000000 | 2.000000 | 9.634700e+04 | 326.000000 | 195.000000 | 7.200000 |
| max | 2016.000000 | 511.000000 | 16.000000 | 1.221550e+10 | 7.605058e+08 | 23000.000000 | 640000.000000 | 137000.000000 | 23000.000000 | 656730.000000 | 349000.000000 | 43.000000 | 1.689764e+06 | 5060.000000 | 813.000000 | 9.500000 |
The describe method displays below information for each of the columns.
- the count or number of values
- mean
- standard deviation
- minimum, maximum
- 25%, 50%, and 75% quantile
Please note that this information will be calculated only for the numeric values.
We can also use the corresponding method to access this information one at a time. For example, to get the mean of a particular column, you can use the mean method on that column.
movies["Gross Earnings"].mean()48468407.526809327Just like mean, there are methods available for each of the statistical information we want to access. You can read about these methods in our free pandas cheat sheet.
Reading files with no header and skipping records
Earlier in this tutorial, we saw some ways to read a particular kind of Excel file that had headers and no rows that needed skipping. Sometimes, the Excel sheet doesn’t have any header row. For such instances, you can tell pandas not to consider the first row as header or columns names. And If the Excel sheet’s first few rows contain data that should not be read in, you can ask the read_excel method to skip a certain number of rows, starting from the top.
For example, look at the top few rows of this Excel file.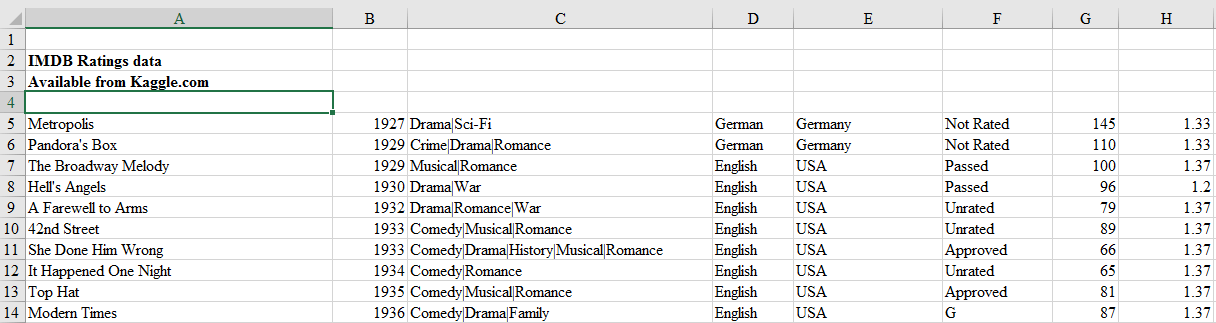
This file obviously has no header and first four rows are not actual records and hence should not be read in. We can tell read_excel there is no header by setting argument header to None and we can skip first four rows by setting argument skiprows to four.
movies_skip_rows = pd.read_excel("movies-no-header-skip-rows.xls", header=None, skiprows=4)
movies_skip_rows.head(5)| 0 | 1 | 2 | 3 | 4 | 5 | 6 | 7 | 8 | 9 | … | 15 | 16 | 17 | 18 | 19 | 20 | 21 | 22 | 23 | 24 | |
|---|---|---|---|---|---|---|---|---|---|---|---|---|---|---|---|---|---|---|---|---|---|
| 0 | Metropolis | 1927 | Drama|Sci-Fi | German | Germany | Not Rated | 145 | 1.33 | 6000000.0 | 26435.0 | … | 136 | 23 | 18.0 | 203 | 12000 | 1 | 111841 | 413 | 260.0 | 8.3 |
| 1 | Pandora’s Box | 1929 | Crime|Drama|Romance | German | Germany | Not Rated | 110 | 1.33 | NaN | 9950.0 | … | 426 | 20 | 3.0 | 455 | 926 | 1 | 7431 | 84 | 71.0 | 8.0 |
| 2 | The Broadway Melody | 1929 | Musical|Romance | English | USA | Passed | 100 | 1.37 | 379000.0 | 2808000.0 | … | 77 | 28 | 4.0 | 109 | 167 | 8 | 4546 | 71 | 36.0 | 6.3 |
| 3 | Hell’s Angels | 1930 | Drama|War | English | USA | Passed | 96 | 1.20 | 3950000.0 | NaN | … | 431 | 12 | 4.0 | 457 | 279 | 1 | 3753 | 53 | 35.0 | 7.8 |
| 4 | A Farewell to Arms | 1932 | Drama|Romance|War | English | USA | Unrated | 79 | 1.37 | 800000.0 | NaN | … | 998 | 164 | 99.0 | 1284 | 213 | 1 | 3519 | 46 | 42.0 | 6.6 |
5 rows × 25 columns
We skipped four rows from the sheet and used none of the rows as the header. Also, notice that one can combine different options in a single read statement. To skip rows at the bottom of the sheet, you can use option skip_footer, which works just like skiprows, the only difference being the rows are counted from the bottom upwards.
The column names in the previous DataFrame are numeric and were allotted as default by the pandas. We can rename the column names to descriptive ones by calling the method columns on the DataFrame and passing the column names as a list.
movies_skip_rows.columns = ['Title', 'Year', 'Genres', 'Language', 'Country', 'Content Rating', 'Duration', 'Aspect Ratio', 'Budget', 'Gross Earnings', 'Director', 'Actor 1', 'Actor 2', 'Actor 3', 'Facebook Likes - Director', 'Facebook Likes - Actor 1', 'Facebook Likes - Actor 2', 'Facebook Likes - Actor 3', 'Facebook Likes - cast Total', 'Facebook likes - Movie', 'Facenumber in posters', 'User Votes', 'Reviews by Users', 'Reviews by Crtiics', 'IMDB Score']
movies_skip_rows.head()| Title | Year | Genres | Language | Country | Content Rating | Duration | Aspect Ratio | Budget | Gross Earnings | … | Facebook Likes — Actor 1 | Facebook Likes — Actor 2 | Facebook Likes — Actor 3 | Facebook Likes — cast Total | Facebook likes — Movie | Facenumber in posters | User Votes | Reviews by Users | Reviews by Crtiics | IMDB Score | |
|---|---|---|---|---|---|---|---|---|---|---|---|---|---|---|---|---|---|---|---|---|---|
| 0 | Metropolis | 1927 | Drama|Sci-Fi | German | Germany | Not Rated | 145 | 1.33 | 6000000.0 | 26435.0 | … | 136 | 23 | 18.0 | 203 | 12000 | 1 | 111841 | 413 | 260.0 | 8.3 |
| 1 | Pandora’s Box | 1929 | Crime|Drama|Romance | German | Germany | Not Rated | 110 | 1.33 | NaN | 9950.0 | … | 426 | 20 | 3.0 | 455 | 926 | 1 | 7431 | 84 | 71.0 | 8.0 |
| 2 | The Broadway Melody | 1929 | Musical|Romance | English | USA | Passed | 100 | 1.37 | 379000.0 | 2808000.0 | … | 77 | 28 | 4.0 | 109 | 167 | 8 | 4546 | 71 | 36.0 | 6.3 |
| 3 | Hell’s Angels | 1930 | Drama|War | English | USA | Passed | 96 | 1.20 | 3950000.0 | NaN | … | 431 | 12 | 4.0 | 457 | 279 | 1 | 3753 | 53 | 35.0 | 7.8 |
| 4 | A Farewell to Arms | 1932 | Drama|Romance|War | English | USA | Unrated | 79 | 1.37 | 800000.0 | NaN | … | 998 | 164 | 99.0 | 1284 | 213 | 1 | 3519 | 46 | 42.0 | 6.6 |
5 rows × 25 columns
Now that we have seen how to read a subset of rows from the Excel file, we can learn how to read a subset of columns.
Reading a subset of columns
Although read_excel defaults to reading and importing all columns, you can choose to import only certain columns. By passing parse_cols=6, we are telling the read_excel method to read only the first columns till index six or first seven columns (the first column being indexed zero).
movies_subset_columns = pd.read_excel(excel_file, parse_cols=6)
movies_subset_columns.head()| Title | Year | Genres | Language | Country | Content Rating | Duration | |
|---|---|---|---|---|---|---|---|
| 0 | Intolerance: Love’s Struggle Throughout the Ages | 1916 | Drama|History|War | NaN | USA | Not Rated | 123 |
| 1 | Over the Hill to the Poorhouse | 1920 | Crime|Drama | NaN | USA | NaN | 110 |
| 2 | The Big Parade | 1925 | Drama|Romance|War | NaN | USA | Not Rated | 151 |
| 3 | Metropolis | 1927 | Drama|Sci-Fi | German | Germany | Not Rated | 145 |
| 4 | Pandora’s Box | 1929 | Crime|Drama|Romance | German | Germany | Not Rated | 110 |
Alternatively, you can pass in a list of numbers, which will let you import columns at particular indexes.
Applying formulas on the columns
One of the much-used features of Excel is to apply formulas to create new columns from existing column values. In our Excel file, we have Gross Earnings and Budget columns. We can get Net earnings by subtracting Budget from Gross earnings. We could then apply this formula in the Excel file to all the rows. We can do this in pandas also as shown below.
movies["Net Earnings"] = movies["Gross Earnings"] - movies["Budget"]Above, we used pandas to create a new column called Net Earnings, and populated it with the difference of Gross Earnings and Budget. It’s worth noting the difference here in how formulas are treated in Excel versus pandas. In Excel, a formula lives in the cell and updates when the data changes — with Python, the calculations happen and the values are stored — if Gross Earnings for one movie was manually changed, Net Earnings won’t be updated.
Let’s use the sort_values method to sort the data by the new column we created and visualize the top 10 movies by Net Earnings.
sorted_movies = movies[['Net Earnings']].sort_values(['Net Earnings'], ascending=[False])sorted_movies.head(10)['Net Earnings'].plot.barh()
plt.show()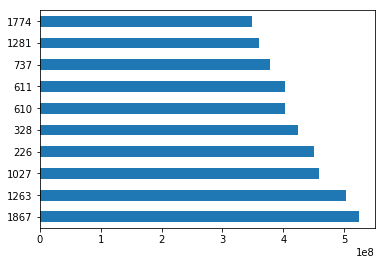
Pivot Table in pandas
Advanced Excel users also often use pivot tables. A pivot table summarizes the data of another table by grouping the data on an index and applying operations such as sorting, summing, or averaging. You can use this feature in pandas too.
We need to first identify the column or columns that will serve as the index, and the column(s) on which the summarizing formula will be applied. Let’s start small, by choosing Year as the index column and Gross Earnings as the summarization column and creating a separate DataFrame from this data.
movies_subset = movies[['Year', 'Gross Earnings']]
movies_subset.head()| Year | Gross Earnings | |
|---|---|---|
| 0 | 1916.0 | NaN |
| 1 | 1920.0 | 3000000.0 |
| 2 | 1925.0 | NaN |
| 3 | 1927.0 | 26435.0 |
| 4 | 1929.0 | 9950.0 |
We now call pivot_table on this subset of data. The method pivot_table takes a parameter index. As mentioned, we want to use Year as the index.
earnings_by_year = movies_subset.pivot_table(index=['Year'])
earnings_by_year.head()| Gross Earnings | |
|---|---|
| Year | |
| 1916.0 | NaN |
| 1920.0 | 3000000.0 |
| 1925.0 | NaN |
| 1927.0 | 26435.0 |
| 1929.0 | 1408975.0 |
This gave us a pivot table with grouping on Year and summarization on the sum of Gross Earnings. Notice, we didn’t need to specify Gross Earnings column explicitly as pandas automatically identified it the values on which summarization should be applied.
We can use this pivot table to create some data visualizations. We can call the plot method on the DataFrame to create a line plot and call the show method to display the plot in the notebook.
earnings_by_year.plot()
plt.show()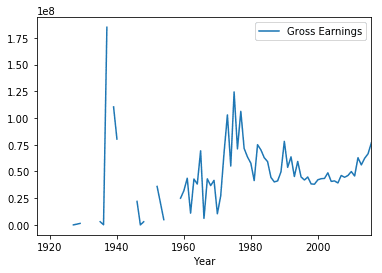
We saw how to pivot with a single column as the index. Things will get more interesting if we can use multiple columns. Let’s create another DataFrame subset but this time we will choose the columns, Country, Language and Gross Earnings.
movies_subset = movies[['Country', 'Language', 'Gross Earnings']]
movies_subset.head()| Country | Language | Gross Earnings | |
|---|---|---|---|
| 0 | USA | NaN | NaN |
| 1 | USA | NaN | 3000000.0 |
| 2 | USA | NaN | NaN |
| 3 | Germany | German | 26435.0 |
| 4 | Germany | German | 9950.0 |
We will use columns Country and Language as the index for the pivot table. We will use Gross Earnings as summarization table, however, we do not need to specify this explicitly as we saw earlier.
earnings_by_co_lang = movies_subset.pivot_table(index=['Country', 'Language'])
earnings_by_co_lang.head()| Gross Earnings | ||
|---|---|---|
| Country | Language | |
| Afghanistan | Dari | 1.127331e+06 |
| Argentina | Spanish | 7.230936e+06 |
| Aruba | English | 1.007614e+07 |
| Australia | Aboriginal | 6.165429e+06 |
| Dzongkha | 5.052950e+05 |
Let’s visualize this pivot table with a bar plot. Since there are still few hundred records in this pivot table, we will plot just a few of them.
earnings_by_co_lang.head(20).plot(kind='bar', figsize=(20,8))
plt.show()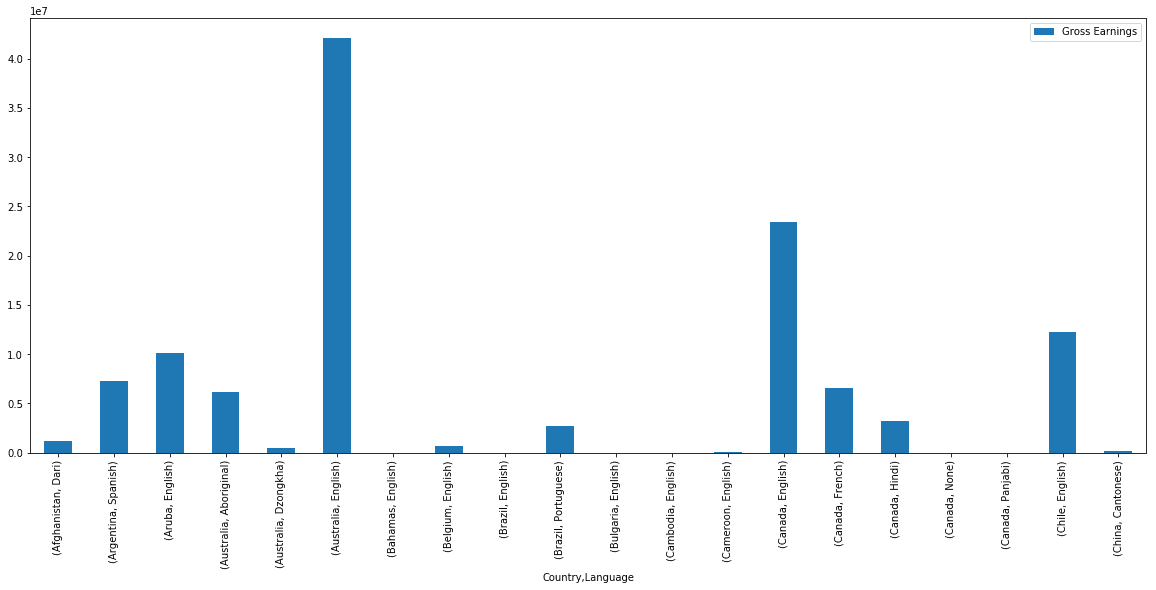
Exporting the results to Excel
If you’re going to be working with colleagues who use Excel, saving Excel files out of pandas is important. You can export or write a pandas DataFrame to an Excel file using pandas to_excel method. Pandas uses the xlwt Python module internally for writing to Excel files. The to_excel method is called on the DataFrame we want to export.We also need to pass a filename to which this DataFrame will be written.
movies.to_excel('output.xlsx')By default, the index is also saved to the output file. However, sometimes the index doesn’t provide any useful information. For example, the movies DataFrame has a numeric auto-increment index, that was not part of the original Excel data.
movies.head()| Title | Year | Genres | Language | Country | Content Rating | Duration | Aspect Ratio | Budget | Gross Earnings | … | Facebook Likes — Actor 2 | Facebook Likes — Actor 3 | Facebook Likes — cast Total | Facebook likes — Movie | Facenumber in posters | User Votes | Reviews by Users | Reviews by Crtiics | IMDB Score | Net Earnings | |
|---|---|---|---|---|---|---|---|---|---|---|---|---|---|---|---|---|---|---|---|---|---|
| 0 | Intolerance: Love’s Struggle Throughout the Ages | 1916.0 | Drama|History|War | NaN | USA | Not Rated | 123.0 | 1.33 | 385907.0 | NaN | … | 22.0 | 9.0 | 481 | 691 | 1.0 | 10718 | 88.0 | 69.0 | 8.0 | NaN |
| 1 | Over the Hill to the Poorhouse | 1920.0 | Crime|Drama | NaN | USA | NaN | 110.0 | 1.33 | 100000.0 | 3000000.0 | … | 2.0 | 0.0 | 4 | 0 | 1.0 | 5 | 1.0 | 1.0 | 4.8 | 2900000.0 |
| 2 | The Big Parade | 1925.0 | Drama|Romance|War | NaN | USA | Not Rated | 151.0 | 1.33 | 245000.0 | NaN | … | 12.0 | 6.0 | 108 | 226 | 0.0 | 4849 | 45.0 | 48.0 | 8.3 | NaN |
| 3 | Metropolis | 1927.0 | Drama|Sci-Fi | German | Germany | Not Rated | 145.0 | 1.33 | 6000000.0 | 26435.0 | … | 23.0 | 18.0 | 203 | 12000 | 1.0 | 111841 | 413.0 | 260.0 | 8.3 | -5973565.0 |
| 4 | Pandora’s Box | 1929.0 | Crime|Drama|Romance | German | Germany | Not Rated | 110.0 | 1.33 | NaN | 9950.0 | … | 20.0 | 3.0 | 455 | 926 | 1.0 | 7431 | 84.0 | 71.0 | 8.0 | NaN |
5 rows × 26 columns
You can choose to skip the index by passing along index-False.
movies.to_excel('output.xlsx', index=False)We need to be able to make our output files look nice before we can send it out to our co-workers. We can use pandas ExcelWriter class along with the XlsxWriter Python module to apply the formatting.
We can do use these advanced output options by creating a ExcelWriter object and use this object to write to the EXcel file.
writer = pd.ExcelWriter('output.xlsx', engine='xlsxwriter')
movies.to_excel(writer, index=False, sheet_name='report')
workbook = writer.bookworksheet = writer.sheets['report']
We can apply customizations by calling add_format on the workbook we are writing to. Here we are setting header format as bold.
header_fmt = workbook.add_format({'bold': True})
worksheet.set_row(0, None, header_fmt)
Finally, we save the output file by calling the method save on the writer object.
writer.save()As an example, we saved the data with column headers set as bold. And the saved file looks like the image below.
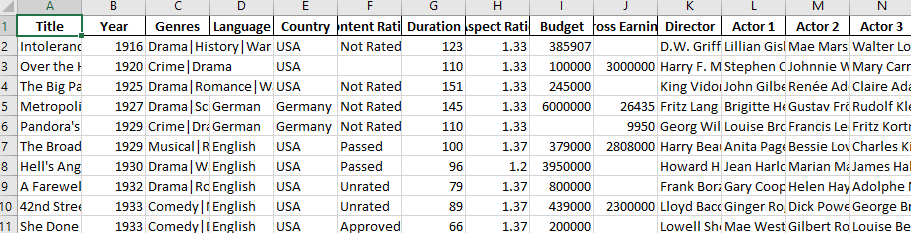
Like this, one can use XlsxWriter to apply various formatting to the output Excel file.
Conclusion
Pandas is not a replacement for Excel. Both tools have their place in the data analysis workflow and can be very great companion tools. As we demonstrated, pandas can do a lot of complex data analysis and manipulations, which depending on your need and expertise, can go beyond what you can achieve if you are just using Excel. One of the major benefits of using Python and pandas over Excel is that it helps you automate Excel file processing by writing scripts and integrating with your automated data workflow. Pandas also has excellent methods for reading all kinds of data from Excel files. You can export your results from pandas back to Excel too if that’s preferred by your intended audience.
On the other hand, Excel is a such a widely used data tool, it’s not a wise to ignore it. Acquiring expertise in both pandas and Excel and making them work together gives you skills that can help you stand out in your organization.
If you’d like to learn more about this topic, check out Dataquest’s interactive Pandas and NumPy Fundamentals course, and our Data Analyst in Python, and Data Scientist in Python paths that will help you become job-ready in around 6 months.
I have a basic question about importing xlsx files to Python. I have checked many responses about the same topic, however I still cannot import my files to Python whatever I try. Here’s my code and the error I receive:
import pandas as pd

import xlrd

file_location = 'C:UserscagdakDesktoppython_self_learningCourserasample_data.xlsx'
workbook = xlrd.open_workbook(file_location)
Error:
IOError: [Errno 2] No such file or directory: 'C:\Users\cagdak\Desktop\python_self_learning\Coursera\sample_data.xlsx'
![]()
salmanwahed
9,3507 gold badges32 silver badges55 bronze badges
asked May 14, 2017 at 13:37
![]()
3
With pandas it is possible to get directly a column of an Excel file. Here is the code.
import pandas
df = pandas.read_excel('sample.xls')

#print the column names
print df.columns

#get the values for a given column
values = df['column_name'].values

#get a data frame with selected columns
FORMAT = ['Col_1', 'Col_2', 'Col_3']
df_selected = df[FORMAT]
![]()
marc_s
726k174 gold badges1326 silver badges1449 bronze badges
answered May 14, 2017 at 13:49
![]()
orbitorbit
1,1982 gold badges11 silver badges23 bronze badges
2
You should use raw strings or escape your backslash instead, for example:
file_location = r'C:UserscagdakDesktoppython_self_learningCourserasample_data.xlsx'
or
file_location = 'C:\Users\cagdak\Desktoppython_self_learning\Coursera\sample_data.xlsx'
answered May 14, 2017 at 13:57
![]()
andyandy
591 silver badge5 bronze badges
3
go ahead and try this:
file_location = 'C:/Users/cagdak/Desktop/python_self_learning/Coursera/sample_data.xlsx'
![]()
slfan
8,910115 gold badges67 silver badges78 bronze badges
answered Mar 6, 2018 at 18:14
![]()
StefStef
5251 gold badge8 silver badges13 bronze badges
0
As pointed out above Pandas supports reading of Excel spreadsheets using its read_excel() method. However, it is dependent upon a number of external libraries depending on which version Excel/odf is being accessed. It defaults to selecting one automatically, though one can be specified using the engine parameter. Here’s an excerpt from the docs:
"xlrd" supports old-style Excel files (.xls).
"openpyxl" supports newer Excel file formats.
"odf" supports OpenDocument file formats (.odf, .ods, .odt).
"pyxlsb" supports Binary Excel files.
If the required library is not already installed you’ll see an error message suggesting library you need to install.
answered Oct 20, 2022 at 13:39
![]()
PierzPierz
6,66847 silver badges59 bronze badges