
Introduction
The IBM definition of Planning Analytics for Excel (shortly called PAX) is:
IBM Planning Analytics for Microsoft Excel is a Microsoft Excel-based add-in that professional report authors use to build reports using data sources from IBM Cognos TM1.
Use the interactive drag-and-drop environment in IBM Planning Analytics for Microsoft Excel to explore and analyze data to find answers to business questions.
You can perform the following tasks:
- Find and focus on items that are important to your business;
- Understand trends and anomalies;
- Compare data, such as details to summaries, or actual results to budgeted
Results;
- Assess performance by focusing on the best or worst results;
- Share your findings with others;
You can use IBM Planning Analytics for Microsoft Excel for multi-dimensional analysis and exploration of large data sources within the familiar Excel environment.
Very nice… But… Within the Planning Analytics family there is another excel add-in that is called TM1 Perspectives and basically is serving the same objective. TM1 Perspectives has been on the market for quite some time, accompanying TM1 users. The main question to be answered is:
What makes switching to IBM Planning Analytics for excel worthwhile, and will it cover for the functionality already available through TM1 perspectives?
The object of this insight is to answer that question by describing the (new) functionality of PAX and emphasis the differences with TM1 perspectives.
If you are used to working with TM1 Perspective there are some notable differences with PAX. One important remark before you go and compare both tools for yourself, is that running clients at the same time is not ideal and not best practice. The official statement from IBM is that this may result in some features not working correctly.
In this document, version 10.3 of the IBM TM1 software is used. The former version of the excel add-inn was called IBM Cognos Analysis for Microsoft Excel (shortly called Café). Within Cafe, the data can be sourced both from TM1 as from BI (Business Intelligence). Café however, still misses out on some crucial functionality to allow switching from TM1 Perspectives.
In version 10.3 of the excel add-in, IBM changed the name to Planning Analytics for excel (PAX). With the renaming, IBM’s wants to emphasize the close relationship with IBM Planning Analytics Workspace (PAW). This close relation is most reflected, in the use of a common set editor and cube viewer.
Some new and very relevant functions came available:
- Dynamic reports — Also known as “active forms” in Perspectives;
- Action buttons — For starting TI processes and navigating between sheets;
- Possibility of publishing sheets — Use in TM1 web and Planning Analytics Workspace;
Without these functions, it was simply not realistic to put TM1 perspectives aside and start working with the new excel add-in PAX. Question however remains, is it enough to put TM1 perspectives aside?
Before I answer this question, I would like to explain a little bit more about Planning Analytics and its components, PAX in particular. By doing so, the answer to the above question will become clear by itself.
TM1 Components Planning Analytics
There are quite some TM1 components that can be used within the Planning Analytics family. The below overview lists the most important Planning Analytics components. Hopefully, this gives some more insight towards the many client tools IBM is offering and maybe allows you to make a better decision which of these tools you want to use.
Looking at all these client tools, you can categorize them in a couple of ways:
- By Functionality;
For example, the clients that allow data-entry and/or data analysis. As such, different clients with different functionality.
- By the possible options to approach and connect to the client tool;
Some of the client tools can be approached from the web, as such these zero-footprint tools require no installation on the end-user’s desktop. Other client tools require an installation of software or an add-in to be installed on the client’s desktop.
- By the different role of the people using the client tool;
Some client tools are suitable for developers that create applications, others are more suitable for controllers that need to do an in-depth analysis of the data. A different client tool can be more suitable for (system) administrators.
So… before start using them all, it’s wise to ask yourself some questions:
- What is it we want to do with the tool?
- Who is using to different components within our organization?
- How are we going to work with the tool?
- …
Audience for the Excel add-inn
This document started with the statement from IBM that the audience for the excel add-in are professional report authors. From a license perspective, this may be a rather simple approach to define, but who are these people in practice? If you ask me, the audience for the excel add-in can be split up into two groups:
- TM1 developers;
These are the people that create data entry sheets and standard reports that are published for example in TM1 web or used in the excel interface. These sheets and reports guide people in a structured way through their process, for example a budget and forecast process or a month-end-closure;
- Data analysts;
These are the people that have in-depth knowledge on how the data is dimensionally structured in cubes. These people use the excel add-in for doing ad-hoc analysis and try to find answers to questions that occasionally arise in an organization.
The first group, the TM1 developers, can be somewhat difficult to convince to switch over to a new add-in. These people benefit from the functionality at hand and learned to live with the limitations of the current tool, TM1 perspectives, and have most probably found good work-arounds for the limitations. The functionality, Utility and look-and-feel of the applications they build, is completely dependent on the capability and experience of the developer and not so much on the capability of the tool itself.
For the second group, the Data Analysts, there are some advantages to gain by using the new add-inn. They are a bit more dependent on the (new) capabilities, the way the tool performs and the look-and-feel of the tool.
Working with Planning Analytics for excel
No need for Citrix anymore
Without any doubt, the most valuable difference between TM1 perspectives and PAX is the way PAX is designed to work in a wide area network environment. Working with TM1 perspectives was only realistic, if you were working directly on the server were the model was installed or via a Citrix or similar setup. With PAX there is no need for working with Citrix anymore, a lot of IBM’s effort is put in improvement of all the network performance of data retrieval and data upload functions of TM1.
So… there is no longer the need explaining to people to switch over to “manual recalculation”, for reasons of performance in Excel. PAX works perfectly fine when Excel is in the automatic recalculation mode!
Copy (Crtl-c) Paste (Crtl-v)
Something that needs to be explained time and time again to an end-user of a TM1 perspectives, is that copy and paste does not work for templates that use DBRW functions. In PAX, if you have write access to a range of cells and the cells are editable so you can copy and paste data in these cells. This is a very big advantage against TM1 perspective, were you don’t not have the ability to copy and paste.
The copy and paste functionality however only works in the following modes (These modes are explained later)
- Exploration
- Quick report
- Cube viewer
Copy and paste does not work in the other modes (Dynamic Report and Customer Report). However, trying to do so, PAX keeps the DBRW (Retrieve/Upload function for data from TM1 cube) in the cells you tried to paste in. This is a still a big advantage against TM1 perspectives. In case you do a copy and paste in TM1 perspectives the DBRW formula is deleted and replaced by the value. This behavior can cause a lot of questions and unclarity for the end-user.
SUBNM Function
In an application, the SubNm function is mostly used in the title area of a report. Here it has the function of selecting new elements of a dimension for (re)building up the grid or placing new values in the grid. In the SubNm, you have the possibility to limit the number of elements an end-user sees in the first place. You do this be defining a subset and use this subset in the SubNm. This may come in very handy, as in practice not all the elements of a dimension are relevant for every report or data-entry sheet. However, in TM1 perspectives this works a little bit clumsy. When clicking on the SubNm function you enter the subset editor. If somehow, by accident, you changed or deleted the underlying subset, the subnm gets a different behavior (shows different elements) as the model developer had foreseen in the first place. This can only be solved by reopening the sheet.
The functionality of the SubNm function is truly enhanced in PAX. If a SubNm references to a subset in the dimension a dropdown arrow is displayed when you click the SubNm function. Therefore, the end-users do not come into the subset editor where they need to pick-up new elements, instead they simply pick them up in an excel way of working with a picklist.
Set editor
The set editor, allows to narrow down the list of members that you want to use in your report or your analysis. It offers the possibility to save the set that you have created, whereas in other TM1 client tools you only have the possibility to save a public set (share public) when you are an administrator. If you do not have administrative rights, you can only save this as a private subset.
The left side of the Set Editor lists the members that can be selected. The right side lists the selected members. As in TM1 perspectives you have the possibility to create a static or a dynamic subset. A dynamic subset is a set of elements that is based on a MDX-statement. By default, the following dynamic subset functions exist:
- Insert Member only
- Insert Member with Children
- Insert Member with descendants
- Insert Member with leaf nodes
- Insert member with ancestors
A dynamic subset can be set to a static subset using the convert to static set option in the members bar. The new set editor is completely different from the subset editor that is used in TM1 perspectives. However in the PAX set editor, there is still something missing that is really handy for the developer without MDX-knowledge. TM1 perspectives offers the possibility to record an MDX-expression. This is very handy as the only thing that you need to do is, to perform the actions in your subset and TM1 Perspectives is recording the MDX-statement for all these actions. This functionality is not (yet) available in PAX.
Another functionality which is missing, is the filter options that are available in the menu of TM1 perspectives. In PAX, you only have the possibility to filter on wildcard (text), it misses the standard menu functionality for filtering on:
- Filter by level;
- Filter by Attribute;
- Filter by View Extract;
There is the possibility to do so by writing the corresponding MDX. But this is only realistic for the developers with MDX-knowledge.
Planning Analytics workspace
If you want PAX to work correctly, you need the Planning Analytics Workspace installed. Otherwise some crucial functionalities, for example the set editor and cube viewer won’t work. This is an extra (financial — Non-confirmed statement is that existing customers can use planning Analytics workspace in PAX without having to purchase the PAW Add-on) hurdle to take. Image that an organization decides to use TM1 only for the support of their budget and forecast cycle, in such case, there is no direct business need for Planning Analytics Workspace to be installed. One really only needs a development tool (for example Architect) for developing the model and an excel interface for developing the TM1 application. No real business requirement for installing the Planning Analytics Workspace. However, for PAX to work properly you need to install the Planning Analytics Workspace Add-on.
Comments
In PAX, comments that explain the data more extensively, become a standard functionality. Comments can be added and viewed in TM1 Exploration Views and in Quick Reports. Adding a comment is done by a right-click in any cell, click IBM Planning Analytics > Annotations.
This is new and not standard in TM1 perspectives. To do this is TM1 Perspectives you need to create dedicated comment cubes.
The comments are only visible in the above-mentioned modes. In tm1 Architect a cube “}CellAnnotations_cube Name” is automatically created were all these comments are stored. A real benefit is that also in other interfaces (for example TM1 web) these comments are visible. What still needs to improve, is that the comments are not visible in the other PAX-modes.
Task Pane
The task pane displays the cubes, views, dimensions, levels, sets and other related objects from the TM1 server. The task pane looks similar as the cube tree in TM1 Architect, but the task pane contains somewhat more useful information. For example, it does not only show the names of the views that exist in the TM1 server, but also what dimension(s) and subset(s) are in the rows, columns and in the title area.
The same goes for the subsets. Not only the name of the subset is shown, you can directly drill to the subset elements (How many elements are shown is determined by application setting “Member display count limit” in the IBM Planning Analytics Application setting menu) In the tree of the task pane the subsets are grouped in categories:
- Subsets
- Privat subsets
- By level
- By Member
For the old-school TM1 die-hards, this is a bit strange because the counting of the levels is done the opposite way. The top-level is zero and every level below is adding one up. In TM1 the lowest level (leaf-level) is zero and every level up is getting one up. Instead of Level000, level001 you can tag them with meaningful business names for the consolidated (aggregated) levels. This is done in Architect in the technical cube “}HierarchyProperties”.
The task pane is the starting point for an end-user analysis or the creation of a new report or data-entry template. The above described additional information is a very positive functionality, however not having the application folder is a painful miss. Most end-users of a Planning Analytics application like a structured set-up of the views and subsets in a logical folder structure. In the task pane, you do not have the ability to structure your TM1 objects. You do have this option in the application folder, but this application folder is not visible in the task pane.
Publish
All the different reporting output modes that are available in PAX can be published. Publishing means that the reporting sheets become available in TM1 web and/or in Planning Analytics Workspace. You need to be careful, as publishing a sheet that is created in the exploration mode does not really make sense, because it loses all its links with the underlying data source and as such becomes hardcoded data.
The publish function is very much comparable with the publish function in TM1 perspectives. There is one big downside which is publishing a sheet that has already been published (update). If you do an update of a sheet in PAX, the underlying id of the sheet is changing. This is very annoying when you reference to this sheet for navigating via an action button. You are forced to rebuild this navigation action button again otherwise it won’t work (see also next section action buttons).
Action buttons
Same as in TM1 Perspectives you can use action buttons in PAX to:
- Run a Turbo-Integrator process
- Navigate to another worksheet
- Run a Turbo-Integrator process and then navigate to another worksheet
- Recalculate a worksheet or rebuild a TM1 Dynamic Report in a worksheet
Before you can use an action button you must make sure the option “Trust access to the VBA project object model” in macro-settings is on. This setting is found in Options, Trust Center Settings, Macro Settings. and is used to deliberately lock out or allow programmatic access to the VBA object model from any automation client.
As already stated, you have to be very careful with the navigation to another worksheet. The navigation is done based on an underlying id of the worksheet you are navigating to. If the target sheet (= where you navigate to) is updated the link won’t work anymore. So, if you update a target sheet you have to be sure that the action button that is used for navigation is also updated. This is somewhat cumbersome and works differently compared to TM1 perspectives. In TM1 perspectives updating the action button was not necessary. As such, maintaining the navigation up to date can be a pretty heavy workload, as you need to be aware of all the navigation routes of the model when you are performing a republish of a sheet (update).
Commit data
The Writeback mode in combination with the Sandbox determines how changes to the TM1 server data are managed. Options allow the administrator to mix and match a variety of capabilities so that every installation and every user group can work in the way that is best-fit for them. If you prefer to work directly with the base data without a private workspace, you can choose a direct writeback method. Another option your administrator can offer you, is the ability to name and store data changes in a named sandbox.
The sandbox functionality is also available in TM1 perspectives. However, I do not see a lot of organizations use this sandbox functionality though. The sandbox functionality is in both tools a bit cumbersome to use. The fact that you must commit your changes is something different from TM1 Perspectives, were data is directly put to the underlying TM1 server without having to commit.
Different Modes of working
In Planning Analytics for excel you can work in the following modes:
- Exploration Mode;
- Quick report;
- Dynamic Report;
- Custom Report;
- Cube viewer;
It depends on your role in the organization and what you want to do, which reporting mode is suitable for you.
Exploration Mode
In the older version of the excel add-in (Café) this mode was called the “crosstab mode”. In the exploration mode, you have the possibility to create your own private views that can be used for the creation of other report types or for doing your analysis (exploration).
You have the possibility to determine the behavior (row limit, start row/column, formatting) of the exploration. The exploration mode is new, and was not available in TM1 Perspectives. In TM1 Perspectives, of course, you have the possibility to slice and dice data, but you do this in the cube viewer mode and not really in the excel interface. Slice and dicing in the excel interface of TM1 Perspectives takes some coding and writing formulas (view definition). As such, this exploration mode in PAX is an enhancement from an end-user perspective.
In the exploration mode, there is a distinct difference between an exploration view and an exploration list. A list is an overview were data is specifically placed in columns. In a view data is placed in rows, columns and in a context area. When you drag dimensions, subsets or items in the grid you automatically see data appearing in the grid. Which data is shown for dimensions that are not part of the grid, is determined by the definition of the “defaultMember” in the cube “}HierarchyProperties” in Architect.
The exploration views can be converted to:
- Quick Report;
- Dynamic Report
- Custom Report
If you publish an exploration and you view the exploration in TM1 web or in TM1 perspectives the data is hard-copy data and will be not updated. As such, this mode is only interesting in the excel add-inn and it does not make sense to publish this.
Quick report
In the older version of PAX this was called the “Flex view mode”. In the exploration mode, you had the possibility to easy change dimension to rows, columns and context area which makes that mode clearly suitable for exploring data. In the quick report mode, you can freeze this view and moreover, you can combine this view with other quick reports (views). As a result, in this mode you have the possibility to combine data from different data sources and/or cubes.
&&Quick Report
You even have the possibility to combine data from different TM1 servers. This maybe handy in the excel interface, whereas in TM1 web this doesn’t make sense at all, because you need to make a choice which TM1 server you want to use before you enter TM1 web. References to other servers simply won’t work because you have no connection to that TM1 server.
If you publish a quick report and you view the quick report in TM1 perspectives the data is hard-copied data and will be not updated. This mode is not compatible with TM1 perspectives. In TM1 Web the data will be updated and has a real-time link with the underlying data containers (Cubes).
Dynamic Report
This mode was not available in earlier versions of PAX and is the most valuable mode for a developer. This mode can be compared to what active forms offer in TM1 Perspectives. This mode is a very powerful one, because it offers the developer the possibility to dynamically build up the rows in the report or data entry sheet. As in active forms, columns are static, meaning you cannot expand or collapse consolidated column members in a Dynamic Report.
You have basically 3 modes in which you can do a recalculation of the data:
- Refresh
- Rebuild
- Recreate
The recreate option is comparable with the rebuild button in TM1 perspectives. Because this mode builds up the rows in your sheets from scratch.
If you publish a Dynamic report and you view the Dynamic report in TM1 perspectives the data has a link to the underlying data-source via the DBRW functions. In other words, this means that this mode is compatible with TM1 perspectives. In TM1 Web the data will be updated and has a real-time link with the underlying data container (Cube).
Custom Report
In the older version of PAX this was called the “formulas mode”. You can best compare the custom report with the slice data functionality in TM1 perspectives. A grid is created with DBRW formulas to the underlying cube. Please notice that the created grids (rows and columns) are fixed. So, if by accident, you created an empty grid this will remain empty since both the rows and columns are not dynamically rebuilding when you change the elements in the title area.
If you publish a Custom report and you view the Custom report in TM1 perspectives the data has a link to the underlying data-source via DBRW functions. However, the data is not updated when you recalculate the sheet. The data is only updated when you select the cell and press F2 and press enter, which from an end-user perspective is not workable and makes this mode not compatible with TM1 perspectives. In TM1 Web the data will be updated and has a real-time link with the underlying data container (Cube).
Cube viewer
In the cube viewer you basically are using the Planning Analytics workspace cube view functionality.
You have the same functionality for spreading and hold functions as you have in the other TM1 client tools, as such there is nothing new in that area. What is new however and works nicely, is that you can add the attributes of an element as an additional row or column to the grid. You even have the possibility to sort the rows and columns on these attributes. Sadly, you cannot directly filter on the values of the attributes in the grid.
In the end, the cube view is pretty much the same as the exploration view, with the only difference that you are not really working in an excel sheet but on a physical layer (Planning Analytics workspace) above. When you have finished your analysis, and want to create the view in another report mode you have the possibility to do so.
Conclusion
It takes little effort to convince the data analysts to start working with PAX and put TM1 perspectives aside. The performance, the new look-and-feel as the new functionality should be a valid and strong argument to make the switch instantly. It won’t take long before IBM picks up the small inconveniences described in this document (for example the decreased functionality in the subset editor). Once all these small imperfections are solved, IBM provides the Data Analyst with a real powerful and diversified tool for doing analysis within the context of their day-to-day job.
The second target group, the developers, probably are somewhat more reluctant to make the switch, as this group benefits a little bit less of the improvements that are introduced in the new excel add-in. Performance, for example, is probably not really an issue for them at all, as most of the developers are working directly on the machine on which the model is installed, through using Remote Desktop sessions. With TM1 perspectives installed on the server, the performance is pretty much okay. The fact that you can copy and paste is also not really breaking news, a developer does not need to do data entry and does not gain a lot from this functionality.
What I think would really help the developer is to have an interface in which they can organize the components of the TM1-model. This is something most of the developers are asking for since a long time but has not been put in place yet, neither in PAX nor in TM1 Perspectives. On the other hand, the new interface is pretty quick to learn and simple to use and there are no real show-stoppers anymore for not using to new excel add-in PAX.
Concluding, I would say… Come on boys and girl’s developers… Step into the new world IBM is providing us…
Содержание
- How to Install or Upgrade Planning Analytics for Excel (PAX/PAfE) Add-in v2.0.65+
- What is Planning Analytics for Excel (PAX/PAfE)?
- Planning Analytics for Excel is NOT TM1 Perspectives!
- What is the PAX/PAfE Add-in?
- PAX/PAW/PASS/PA Server Version Sync
- Instructions to Install Planning Analytics for Excel
- Create Connection to TM1 Model
- IBM Planning Analytics for Excel (PAX)
- Introduction
- TM1 Components Planning Analytics
- Audience for the Excel add-inn
- Working with Planning Analytics for excel
- No need for Citrix anymore
- Copy (Crtl-c) Paste (Crtl-v)
- SUBNM Function
- Set editor
- Planning Analytics workspace
- Comments
- Task Pane
- Publish
- Action buttons
- Commit data
- Different Modes of working
- Exploration Mode
- Quick report
- Dynamic Report
- Custom Report
- Cube viewer
- Conclusion
How to Install or Upgrade Planning Analytics for Excel (PAX/PAfE) Add-in v2.0.65+
Updated for PAX v 2.0.65 – Single File Install. Here we are going to detail how to upgrade or install the TM1 Planning Analytics for Excel (PAX – also sometimes known as PAfE) add-ins onto a user’s PC. As of version 2.0.65, the installation fo PAfE has changed so that it is now a single file installation, rather than the installation of a set of Excel add-ins. The PAfE admin provides reporting and analysis of TM1 cubes via Excel.
If you need to install a prior version than 2.0.65, then please follow the steps at on this post.
What is Planning Analytics for Excel (PAX/PAfE)?
PAX is the Excel add-in that provides access to TM1 cubes. With it, you can do ad-hoc exploration, create quick reports, create unlimited length reports and highly customised reports. It replaces the old TM1 Perspectives add-in.
Planning Analytics for Excel is NOT TM1 Perspectives!
Please note that if you are looking for instructions to install the old Perspectives add-in (rather than PAX/PAfE) to Excel, please see this post.
If you are looking for instructions how to install versions of PAX/PAfE prior to 2.0.65, please see this post.
What is the PAX/PAfE Add-in?
PAX/PAfE connects to the Planning Analytics Workspace (PAW) server (not the TM1 server). To do this it uses an Excel Add-in.
There is a separate add-in for both 32- and 64-bit versions of Excel. Don’t worry if you choose the wrong version, it will not let you install the wrong version.
There are new versions of the PAX/PAfE add-in released by IBM every month or so. You should have a recent, say within the last three months, version installed.
PAX/PAW/PASS/PA Server Version Sync
Planning Analytics needs to be kept roughly in sync between the core Planning Analytics (TM1) server, Planning Analytics Workspace (PAW), Planning Analytics for Excel (PAX/PAfE) and Planning Analytics Spreadsheet Services (PASS/TM1Web). IBM releases new version of PAX and PAW about every month and a new version of PA server about every quarter. Just make sure you upgrade all three, not just PAX and leave PA server or PAW, or it will clunk eventually!
If you need more information on PA version management, please see this post.
Instructions to Install Planning Analytics for Excel
With the 2.0.65 and beyond installer, it is a much simpler process and does not require administration rights to install anything. You end up just running the .xll file and it opens PAX inside Excel straight up.
Time needed: 10 minutes.
Here are the detailed, step by step instructions for installation of the Planning Analytics for Excel (PAfE) for version 2.0.65 and beyond.
- Check Supported Environment
First, check that your PC satisfies the supported environment from IBM. This is available here and includes: At least .Net 4.6.1 (if not present, download it from here).
If installing PAX onto an old version of Excel (2007, 2010), then install the Primary Interop Assemblies (PIA) for your version of MS Office Office 2007 here, Office 2010 here. For Office 2013, 2016 or 2019, Microsoft doesn’t publish a PIA as apparently they are not needed).
If you get errors installing please see this post.
Finally, check what version of Excel you are running – is it 32 or 64 bit. This will determine which version of the PAX plugin you need to use (File, Account, About Excel).
Backup PAX Connections
Backup the connections inside Planning Analytics for Excel if you are upgrading. Just copy and paste the connection string out to Notepad.
Quit from Excel
Exit from Excel, if it is still open.
Uninstall Previous PAX (if prior to 2.0.65 installed)
Uninstall any previous version of PAX.
Click Start menu, Programs, IBM Planning Analytics for Microsoft Office, Uninstall IBM Office Addins, Uninstall IBM Office Addins.
This will bring up the Uninstall Wizard and you should follow the steps in it to remove your current version of PAX.
Ensure you select the option to leave your configuration settings in place as you don’t want to lose them!
Removing the prior version is absolutely mandatory, especially if you are upgrading from a version up until 2.0.64.
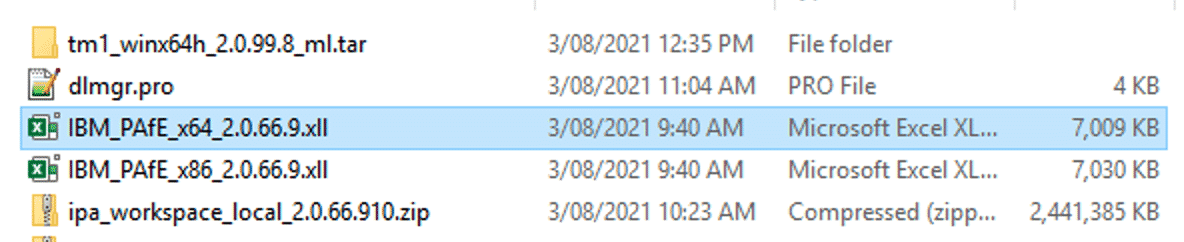
Download and Save .xll File
Create a new folder somewhere that is accessible to you. Say, C:Planning Analytics for Excel, or something similar. Then copy the relevant .xll file (either 32 or 64 bit) to this location. These are the files that need to be directly run to open PAX directly inside Excel.
Open the .xll File
Now with the file in the correct location on your PC, open the correct .xll file.
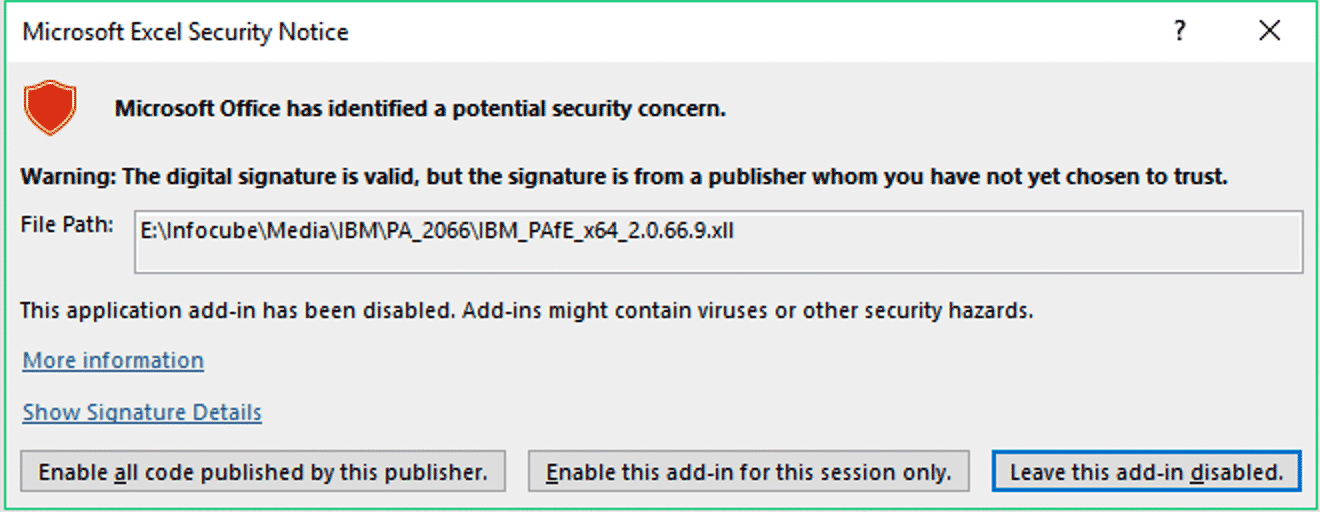
Enable Code from IBM
When you first open PAfE directly from the .xll, Windows will ask you about a potential security threat from the .xll file. You can either select to enable for this session only, or to enable all code from the publisher. Obviously if you don’t want to have to answer this popup every time you open PAX, then you need to choose the first option, to “Enable all code published by this publisher”.
Set Language and Accept IBM Licence
Straight after the security warning from Windows, you will also be asked to select your language and accept the licence from IBM. This only occurs once.

Planning Analytics for Excel will then open in Excel and will not open any document (unlike in the pre 2.0.65 days). You will then need to Connect to Planning Analytics to work with the files stored inside your TM1 server.
Interestingly, from what I can see, there appears to be no visible differences in the interface. I hope though, that it is more stable than the previous versions and that it will set up the tool for more advanced usage.

The .xll file is what is run, but where do you put it? I have moved it to a location I can easily find it.
Then I have renamed the .xll file as just plain old “Planning Analytics for Excel.xll”. I have done this so that when I create the shortcut it is named this AND, more importantly when I upgrade PAX, I will do the same process and Windows will still find the shortcut target.
From there we should create a short cut to it and place it in the Windows Start Menu.
You will see here that I have moved it to a new folder, called E:PAX.
Then I have created a shortcut to it and renamed the shortcut to just be “Planning Analytics for Excel” – because that is how we want it to appear in our Start Menu.

Copy Shortcut to Start Menu
This is a little beyond my Windows pay grade, but if you go to %AppData%MicrosoftWindowsStart MenuPrograms in Windows Explorer and paste the shortcut there, it will now be visible on the Start Menu.


Create Connection to TM1 Model
Now that you have installed the Planning Analytics for Excel add-in, you need to create a connection to a TM1 model. Please see this post for detailed instructions on how to do this.
Источник
IBM Planning Analytics for Excel (PAX)
Introduction
The IBM definition of Planning Analytics for Excel (shortly called PAX) is:
IBM Planning Analytics for Microsoft Excel is a Microsoft Excel-based add-in that professional report authors use to build reports using data sources from IBM Cognos TM1.
Use the interactive drag-and-drop environment in IBM Planning Analytics for Microsoft Excel to explore and analyze data to find answers to business questions.
You can perform the following tasks:
- Find and focus on items that are important to your business;
- Understand trends and anomalies;
- Compare data, such as details to summaries, or actual results to budgeted
- Assess performance by focusing on the best or worst results;
- Share your findings with others;
You can use IBM Planning Analytics for Microsoft Excel for multi-dimensional analysis and exploration of large data sources within the familiar Excel environment.
Very nice… But… Within the Planning Analytics family there is another excel add-in that is called TM1 Perspectives and basically is serving the same objective. TM1 Perspectives has been on the market for quite some time, accompanying TM1 users. The main question to be answered is:
What makes switching to IBM Planning Analytics for excel worthwhile, and will it cover for the functionality already available through TM1 perspectives?
The object of this insight is to answer that question by describing the (new) functionality of PAX and emphasis the differences with TM1 perspectives.
If you are used to working with TM1 Perspective there are some notable differences with PAX. One important remark before you go and compare both tools for yourself, is that running clients at the same time is not ideal and not best practice. The official statement from IBM is that this may result in some features not working correctly.
In this document, version 10.3 of the IBM TM1 software is used. The former version of the excel add-inn was called IBM Cognos Analysis for Microsoft Excel (shortly called Café). Within Cafe, the data can be sourced both from TM1 as from BI (Business Intelligence). Café however, still misses out on some crucial functionality to allow switching from TM1 Perspectives.
In version 10.3 of the excel add-in, IBM changed the name to Planning Analytics for excel (PAX). With the renaming, IBM’s wants to emphasize the close relationship with IBM Planning Analytics Workspace (PAW). This close relation is most reflected, in the use of a common set editor and cube viewer.
Some new and very relevant functions came available:
- Dynamic reports — Also known as “active forms” in Perspectives;
- Action buttons — For starting TI processes and navigating between sheets;
- Possibility of publishing sheets — Use in TM1 web and Planning Analytics Workspace;
Without these functions, it was simply not realistic to put TM1 perspectives aside and start working with the new excel add-in PAX. Question however remains, is it enough to put TM1 perspectives aside?
Before I answer this question, I would like to explain a little bit more about Planning Analytics and its components, PAX in particular. By doing so, the answer to the above question will become clear by itself.
TM1 Components Planning Analytics
There are quite some TM1 components that can be used within the Planning Analytics family. The below overview lists the most important Planning Analytics components. Hopefully, this gives some more insight towards the many client tools IBM is offering and maybe allows you to make a better decision which of these tools you want to use.
Looking at all these client tools, you can categorize them in a couple of ways:
For example, the clients that allow data-entry and/or data analysis. As such, different clients with different functionality.
- By the possible options to approach and connect to the client tool;
Some of the client tools can be approached from the web, as such these zero-footprint tools require no installation on the end-user’s desktop. Other client tools require an installation of software or an add-in to be installed on the client’s desktop.
- By the different role of the people using the client tool;
Some client tools are suitable for developers that create applications, others are more suitable for controllers that need to do an in-depth analysis of the data. A different client tool can be more suitable for (system) administrators.
So… before start using them all, it’s wise to ask yourself some questions:
- What is it we want to do with the tool?
- Who is using to different components within our organization?
- How are we going to work with the tool?
- …
Audience for the Excel add-inn
This document started with the statement from IBM that the audience for the excel add-in are professional report authors. From a license perspective, this may be a rather simple approach to define, but who are these people in practice? If you ask me, the audience for the excel add-in can be split up into two groups:
These are the people that create data entry sheets and standard reports that are published for example in TM1 web or used in the excel interface. These sheets and reports guide people in a structured way through their process, for example a budget and forecast process or a month-end-closure;
These are the people that have in-depth knowledge on how the data is dimensionally structured in cubes. These people use the excel add-in for doing ad-hoc analysis and try to find answers to questions that occasionally arise in an organization.
The first group, the TM1 developers, can be somewhat difficult to convince to switch over to a new add-in. These people benefit from the functionality at hand and learned to live with the limitations of the current tool, TM1 perspectives, and have most probably found good work-arounds for the limitations. The functionality, Utility and look-and-feel of the applications they build, is completely dependent on the capability and experience of the developer and not so much on the capability of the tool itself.
For the second group, the Data Analysts, there are some advantages to gain by using the new add-inn. They are a bit more dependent on the (new) capabilities, the way the tool performs and the look-and-feel of the tool.
Working with Planning Analytics for excel
No need for Citrix anymore
Without any doubt, the most valuable difference between TM1 perspectives and PAX is the way PAX is designed to work in a wide area network environment. Working with TM1 perspectives was only realistic, if you were working directly on the server were the model was installed or via a Citrix or similar setup. With PAX there is no need for working with Citrix anymore, a lot of IBM’s effort is put in improvement of all the network performance of data retrieval and data upload functions of TM1.
So… there is no longer the need explaining to people to switch over to “manual recalculation”, for reasons of performance in Excel. PAX works perfectly fine when Excel is in the automatic recalculation mode!
Copy (Crtl-c) Paste (Crtl-v)
Something that needs to be explained time and time again to an end-user of a TM1 perspectives, is that copy and paste does not work for templates that use DBRW functions. In PAX, if you have write access to a range of cells and the cells are editable so you can copy and paste data in these cells. This is a very big advantage against TM1 perspective, were you don’t not have the ability to copy and paste.
The copy and paste functionality however only works in the following modes (These modes are explained later)
- Exploration
- Quick report
- Cube viewer
Copy and paste does not work in the other modes (Dynamic Report and Customer Report). However, trying to do so, PAX keeps the DBRW (Retrieve/Upload function for data from TM1 cube) in the cells you tried to paste in. This is a still a big advantage against TM1 perspectives. In case you do a copy and paste in TM1 perspectives the DBRW formula is deleted and replaced by the value. This behavior can cause a lot of questions and unclarity for the end-user.
SUBNM Function
In an application, the SubNm function is mostly used in the title area of a report. Here it has the function of selecting new elements of a dimension for (re)building up the grid or placing new values in the grid. In the SubNm, you have the possibility to limit the number of elements an end-user sees in the first place. You do this be defining a subset and use this subset in the SubNm. This may come in very handy, as in practice not all the elements of a dimension are relevant for every report or data-entry sheet. However, in TM1 perspectives this works a little bit clumsy. When clicking on the SubNm function you enter the subset editor. If somehow, by accident, you changed or deleted the underlying subset, the subnm gets a different behavior (shows different elements) as the model developer had foreseen in the first place. This can only be solved by reopening the sheet.
The functionality of the SubNm function is truly enhanced in PAX. If a SubNm references to a subset in the dimension a dropdown arrow is displayed when you click the SubNm function. Therefore, the end-users do not come into the subset editor where they need to pick-up new elements, instead they simply pick them up in an excel way of working with a picklist.
Set editor
The set editor, allows to narrow down the list of members that you want to use in your report or your analysis. It offers the possibility to save the set that you have created, whereas in other TM1 client tools you only have the possibility to save a public set (share public) when you are an administrator. If you do not have administrative rights, you can only save this as a private subset.
The left side of the Set Editor lists the members that can be selected. The right side lists the selected members. As in TM1 perspectives you have the possibility to create a static or a dynamic subset. A dynamic subset is a set of elements that is based on a MDX-statement. By default, the following dynamic subset functions exist:
- Insert Member only
- Insert Member with Children
- Insert Member with descendants
- Insert Member with leaf nodes
- Insert member with ancestors
A dynamic subset can be set to a static subset using the convert to static set option in the members bar. The new set editor is completely different from the subset editor that is used in TM1 perspectives. However in the PAX set editor, there is still something missing that is really handy for the developer without MDX-knowledge. TM1 perspectives offers the possibility to record an MDX-expression. This is very handy as the only thing that you need to do is, to perform the actions in your subset and TM1 Perspectives is recording the MDX-statement for all these actions. This functionality is not (yet) available in PAX.
Another functionality which is missing, is the filter options that are available in the menu of TM1 perspectives. In PAX, you only have the possibility to filter on wildcard (text), it misses the standard menu functionality for filtering on:
- Filter by level;
- Filter by Attribute;
- Filter by View Extract;
There is the possibility to do so by writing the corresponding MDX. But this is only realistic for the developers with MDX-knowledge.
Planning Analytics workspace
If you want PAX to work correctly, you need the Planning Analytics Workspace installed. Otherwise some crucial functionalities, for example the set editor and cube viewer won’t work. This is an extra (financial — Non-confirmed statement is that existing customers can use planning Analytics workspace in PAX without having to purchase the PAW Add-on) hurdle to take. Image that an organization decides to use TM1 only for the support of their budget and forecast cycle, in such case, there is no direct business need for Planning Analytics Workspace to be installed. One really only needs a development tool (for example Architect) for developing the model and an excel interface for developing the TM1 application. No real business requirement for installing the Planning Analytics Workspace. However, for PAX to work properly you need to install the Planning Analytics Workspace Add-on.
In PAX, comments that explain the data more extensively, become a standard functionality. Comments can be added and viewed in TM1 Exploration Views and in Quick Reports. Adding a comment is done by a right-click in any cell, click IBM Planning Analytics > Annotations.
This is new and not standard in TM1 perspectives. To do this is TM1 Perspectives you need to create dedicated comment cubes.
The comments are only visible in the above-mentioned modes. In tm1 Architect a cube “>CellAnnotations_cube Name” is automatically created were all these comments are stored. A real benefit is that also in other interfaces (for example TM1 web) these comments are visible. What still needs to improve, is that the comments are not visible in the other PAX-modes.
Task Pane
The task pane displays the cubes, views, dimensions, levels, sets and other related objects from the TM1 server. The task pane looks similar as the cube tree in TM1 Architect, but the task pane contains somewhat more useful information. For example, it does not only show the names of the views that exist in the TM1 server, but also what dimension(s) and subset(s) are in the rows, columns and in the title area.
The same goes for the subsets. Not only the name of the subset is shown, you can directly drill to the subset elements (How many elements are shown is determined by application setting “Member display count limit” in the IBM Planning Analytics Application setting menu) In the tree of the task pane the subsets are grouped in categories:
- Subsets
- Privat subsets
- By level
- By Member
For the old-school TM1 die-hards, this is a bit strange because the counting of the levels is done the opposite way. The top-level is zero and every level below is adding one up. In TM1 the lowest level (leaf-level) is zero and every level up is getting one up. Instead of Level000, level001 you can tag them with meaningful business names for the consolidated (aggregated) levels. This is done in Architect in the technical cube “>HierarchyProperties”.
The task pane is the starting point for an end-user analysis or the creation of a new report or data-entry template. The above described additional information is a very positive functionality, however not having the application folder is a painful miss. Most end-users of a Planning Analytics application like a structured set-up of the views and subsets in a logical folder structure. In the task pane, you do not have the ability to structure your TM1 objects. You do have this option in the application folder, but this application folder is not visible in the task pane.
Publish
All the different reporting output modes that are available in PAX can be published. Publishing means that the reporting sheets become available in TM1 web and/or in Planning Analytics Workspace. You need to be careful, as publishing a sheet that is created in the exploration mode does not really make sense, because it loses all its links with the underlying data source and as such becomes hardcoded data.
The publish function is very much comparable with the publish function in TM1 perspectives. There is one big downside which is publishing a sheet that has already been published (update). If you do an update of a sheet in PAX, the underlying id of the sheet is changing. This is very annoying when you reference to this sheet for navigating via an action button. You are forced to rebuild this navigation action button again otherwise it won’t work (see also next section action buttons).
Action buttons
Same as in TM1 Perspectives you can use action buttons in PAX to:
- Run a Turbo-Integrator process
- Navigate to another worksheet
- Run a Turbo-Integrator process and then navigate to another worksheet
- Recalculate a worksheet or rebuild a TM1 Dynamic Report in a worksheet
Before you can use an action button you must make sure the option “Trust access to the VBA project object model” in macro-settings is on. This setting is found in Options, Trust Center Settings, Macro Settings. and is used to deliberately lock out or allow programmatic access to the VBA object model from any automation client.
As already stated, you have to be very careful with the navigation to another worksheet. The navigation is done based on an underlying id of the worksheet you are navigating to. If the target sheet (= where you navigate to) is updated the link won’t work anymore. So, if you update a target sheet you have to be sure that the action button that is used for navigation is also updated. This is somewhat cumbersome and works differently compared to TM1 perspectives. In TM1 perspectives updating the action button was not necessary. As such, maintaining the navigation up to date can be a pretty heavy workload, as you need to be aware of all the navigation routes of the model when you are performing a republish of a sheet (update).
Commit data
The Writeback mode in combination with the Sandbox determines how changes to the TM1 server data are managed. Options allow the administrator to mix and match a variety of capabilities so that every installation and every user group can work in the way that is best-fit for them. If you prefer to work directly with the base data without a private workspace, you can choose a direct writeback method. Another option your administrator can offer you, is the ability to name and store data changes in a named sandbox.
The sandbox functionality is also available in TM1 perspectives. However, I do not see a lot of organizations use this sandbox functionality though. The sandbox functionality is in both tools a bit cumbersome to use. The fact that you must commit your changes is something different from TM1 Perspectives, were data is directly put to the underlying TM1 server without having to commit.
Different Modes of working
In Planning Analytics for excel you can work in the following modes:
- Exploration Mode;
- Quick report;
- Dynamic Report;
- Custom Report;
- Cube viewer;
It depends on your role in the organization and what you want to do, which reporting mode is suitable for you.
Exploration Mode
In the older version of the excel add-in (Café) this mode was called the “crosstab mode”. In the exploration mode, you have the possibility to create your own private views that can be used for the creation of other report types or for doing your analysis (exploration).
You have the possibility to determine the behavior (row limit, start row/column, formatting) of the exploration. The exploration mode is new, and was not available in TM1 Perspectives. In TM1 Perspectives, of course, you have the possibility to slice and dice data, but you do this in the cube viewer mode and not really in the excel interface. Slice and dicing in the excel interface of TM1 Perspectives takes some coding and writing formulas (view definition). As such, this exploration mode in PAX is an enhancement from an end-user perspective.
In the exploration mode, there is a distinct difference between an exploration view and an exploration list. A list is an overview were data is specifically placed in columns. In a view data is placed in rows, columns and in a context area. When you drag dimensions, subsets or items in the grid you automatically see data appearing in the grid. Which data is shown for dimensions that are not part of the grid, is determined by the definition of the “defaultMember” in the cube “>HierarchyProperties” in Architect.
The exploration views can be converted to:
- Quick Report;
- Dynamic Report
- Custom Report
If you publish an exploration and you view the exploration in TM1 web or in TM1 perspectives the data is hard-copy data and will be not updated. As such, this mode is only interesting in the excel add-inn and it does not make sense to publish this.
Quick report
In the older version of PAX this was called the “Flex view mode”. In the exploration mode, you had the possibility to easy change dimension to rows, columns and context area which makes that mode clearly suitable for exploring data. In the quick report mode, you can freeze this view and moreover, you can combine this view with other quick reports (views). As a result, in this mode you have the possibility to combine data from different data sources and/or cubes.
You even have the possibility to combine data from different TM1 servers. This maybe handy in the excel interface, whereas in TM1 web this doesn’t make sense at all, because you need to make a choice which TM1 server you want to use before you enter TM1 web. References to other servers simply won’t work because you have no connection to that TM1 server.
If you publish a quick report and you view the quick report in TM1 perspectives the data is hard-copied data and will be not updated. This mode is not compatible with TM1 perspectives. In TM1 Web the data will be updated and has a real-time link with the underlying data containers (Cubes).
Dynamic Report
This mode was not available in earlier versions of PAX and is the most valuable mode for a developer. This mode can be compared to what active forms offer in TM1 Perspectives. This mode is a very powerful one, because it offers the developer the possibility to dynamically build up the rows in the report or data entry sheet. As in active forms, columns are static, meaning you cannot expand or collapse consolidated column members in a Dynamic Report.
You have basically 3 modes in which you can do a recalculation of the data:
The recreate option is comparable with the rebuild button in TM1 perspectives. Because this mode builds up the rows in your sheets from scratch.
If you publish a Dynamic report and you view the Dynamic report in TM1 perspectives the data has a link to the underlying data-source via the DBRW functions. In other words, this means that this mode is compatible with TM1 perspectives. In TM1 Web the data will be updated and has a real-time link with the underlying data container (Cube).
Custom Report
In the older version of PAX this was called the “formulas mode”. You can best compare the custom report with the slice data functionality in TM1 perspectives. A grid is created with DBRW formulas to the underlying cube. Please notice that the created grids (rows and columns) are fixed. So, if by accident, you created an empty grid this will remain empty since both the rows and columns are not dynamically rebuilding when you change the elements in the title area.
If you publish a Custom report and you view the Custom report in TM1 perspectives the data has a link to the underlying data-source via DBRW functions. However, the data is not updated when you recalculate the sheet. The data is only updated when you select the cell and press F2 and press enter, which from an end-user perspective is not workable and makes this mode not compatible with TM1 perspectives. In TM1 Web the data will be updated and has a real-time link with the underlying data container (Cube).
Cube viewer
In the cube viewer you basically are using the Planning Analytics workspace cube view functionality.
You have the same functionality for spreading and hold functions as you have in the other TM1 client tools, as such there is nothing new in that area. What is new however and works nicely, is that you can add the attributes of an element as an additional row or column to the grid. You even have the possibility to sort the rows and columns on these attributes. Sadly, you cannot directly filter on the values of the attributes in the grid.
In the end, the cube view is pretty much the same as the exploration view, with the only difference that you are not really working in an excel sheet but on a physical layer (Planning Analytics workspace) above. When you have finished your analysis, and want to create the view in another report mode you have the possibility to do so.
Conclusion
It takes little effort to convince the data analysts to start working with PAX and put TM1 perspectives aside. The performance, the new look-and-feel as the new functionality should be a valid and strong argument to make the switch instantly. It won’t take long before IBM picks up the small inconveniences described in this document (for example the decreased functionality in the subset editor). Once all these small imperfections are solved, IBM provides the Data Analyst with a real powerful and diversified tool for doing analysis within the context of their day-to-day job.
The second target group, the developers, probably are somewhat more reluctant to make the switch, as this group benefits a little bit less of the improvements that are introduced in the new excel add-in. Performance, for example, is probably not really an issue for them at all, as most of the developers are working directly on the machine on which the model is installed, through using Remote Desktop sessions. With TM1 perspectives installed on the server, the performance is pretty much okay. The fact that you can copy and paste is also not really breaking news, a developer does not need to do data entry and does not gain a lot from this functionality.
What I think would really help the developer is to have an interface in which they can organize the components of the TM1-model. This is something most of the developers are asking for since a long time but has not been put in place yet, neither in PAX nor in TM1 Perspectives. On the other hand, the new interface is pretty quick to learn and simple to use and there are no real show-stoppers anymore for not using to new excel add-in PAX.
Concluding, I would say… Come on boys and girl’s developers… Step into the new world IBM is providing us…
Источник
Skip to content
How to embrace—not replace—your spreadsheets with IBM Planning Analytics for Microsoft Excel

Related Posts