
Possessing Microsoft Excel skills has become one of the most must-have strengths of our lives. Microsoft first launched it in 1985, and initially, it was solely used for business purposes. But, with the advancement of time, it has become so widespread that we use MS Excel almost every aspect of life, whether educational, official, business or even personal purposes.
After Excel, many computer programs have developed. But till today, it doesn’t lose the appeal at all, besides its popularity is bumping up day by day! So, you see, it is crucial to have Excel skills to rise in any professional field. However, follow the blog to vanquish 20 most obvious Excel skills for professionals.
Table of Contents
20 Must-Have Excel Skills for Professionals
You probably think that which excel skills you should acquire first as there are plenty of em. Well, for your ease, I’ve filtered out 20 must-have excel skills for professional purpose.
For entry-level administrative roles, you’ll need the following basic Excel skills. These are the skills that most recruiters want in a candidate. So, acquire the following skills to make the first impression to the recruiters and enter into the job industry with eloquence and confidence.
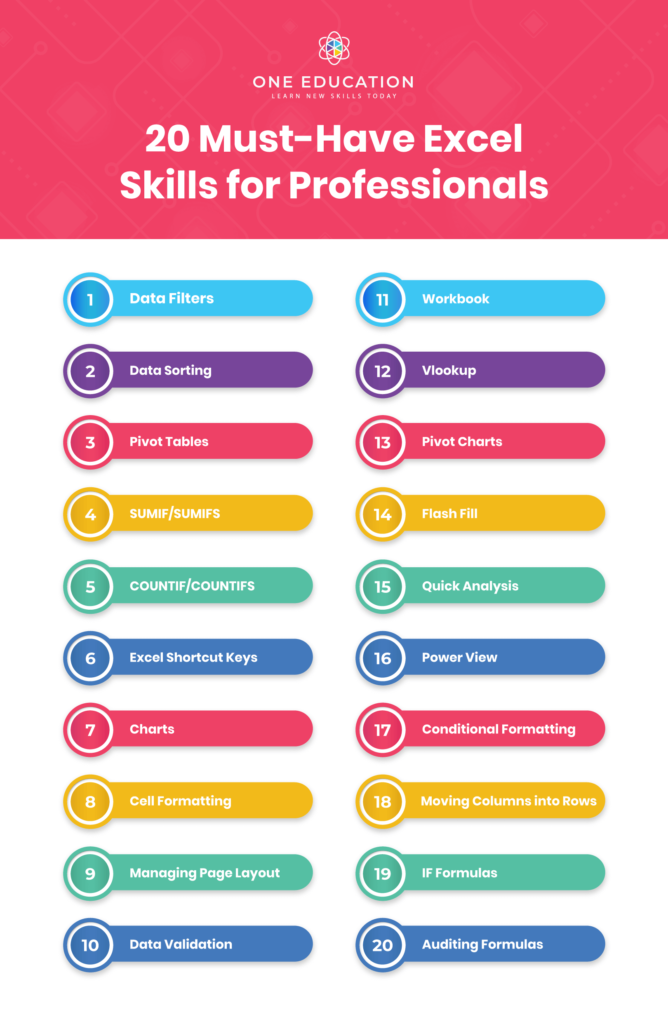
1. Data Filters
This may seem to be a very basic excel skill to some, but if you don’t know how to work with data filters, you’ll need to develop this skill to stand out from the crowd. When you know how to use data filters you can sort, hide and search for crucial bits of information in a spreadsheet anytime you need to.
2. Data Sorting
Excel allows you to sort the data in your spreadsheets into order. For example, alphabetical order or reverse alphabetical order. This is a tricky technique to master because in some situations you can accidentally sort one row or column and not another which will mess up a spreadsheet. These tricky manoeuvres are the reason why it’s necessary to take a proper well-organised Excel Course.
3. Pivot Tables
These are tables which summarise, and allow you to count, sum, and average amongst other calculations according to the data you require. When you know how to do this, it becomes even easier to crunch data and create reports that your business needs.
4. SUMIF/SUMIFS
This handy little Excel skin is a function that sum cells that meet specific but multiple criteria. It is often used when adjacent cells meet criteria based on dates, text and numbers. In other words, it’s a way of sorting through data on a spreadsheet efficiently.
5. COUNTIF/COUNTIFS
The Microsoft Excel COUNTIFS is a function that counts the number of cells in a range, that meets single or multiple criteria. You can use COUNTIFS as a worksheet function where they can be entered as part of a formula in a cell of a worksheet. Some of these Excel skills may seem to be alien to you right now, but they are easily understood when you follow a structured learning path, such as in one of our Excel courses.
6. Excel Shortcut Keys

When you are working with Excel, you’ll get your work done much quicker if you learn how to use the short cut keys. There are a variety of these keys which are used directly from the keyboard rather than using the mouse to navigate.
You may only save a few seconds each time you use this shortcut, but if you are working on spreadsheets all day long, you’ll save yourself a LOT of time by learning the shortcut keys.
7. Charts

Another must-have skill is the ability to create charts which are great ways to present the data you collated using Vlookup. There is such an emphasis on data right now that it makes sense that the ability to create charts is a highly sought after Excel skills.
8. Cell Formatting
Being able to make the data in a cell look correct, so that it doesn’t mess up formulas or formatting is vital. It’s a very basic Excel skill but one that you’ll use daily. When you learn how to format cells in bulk, it will save you plenty of time and helping you to look efficient and on top of your game.


9. Managing Page Layout
For similar reasons to Cell Formatting, being able to manage the page layout is a good Excel skill to have. Page layout ensures that your spreadsheets and any other data look and even print exactly as you need it to. Being able to manage the page layout swiftly makes you look efficient and organised.
10. Data Validation

Data Validation is used to control what can be entered into a cell. For example, there may be a numerical limit to ensure that you don’t enter incorrect numbers, or a date falls within a defined period of time. This is a fun tool with many uses which will help you stay in control of any spreadsheets you create or work with.
11. Workbook
A workbook is a collection of spreadsheets which are contained in a single file. It’s a really handy way to store related spreadsheets all in one place. It’s another very basic Excel skill that is necessary for any entry-level role.
Microsoft Excel Complete Bundle
The course is endorsed by TQUK, an established Ofqual-regulated Awarding Organisation which assures your qualification is professional and recognised.
Microsoft Excel Complete Bundle
The course is endorsed by TQUK, an established Ofqual-regulated Awarding Organisation which assures your qualification is professional and recognised.
12. Vlookup
Vlookup is a valued skill that anybody who uses Excel needs to know. By using Vlookup, you can collate data from multiple sheets and workbooks into a central location which is perfect for creating reports.
This is a vital Excel skill for any analyst, which is a hot career right now, but it’s also useful across the board.
13. Pivot Charts
Pivot Charts are another form of Excel chart. It allows you to simplify complex data so that it’s easy to digest. Pivot Charts are very similar to traditional charts. They have categories and data series, but they are different because they have interactive filters that allow you to gain access to more information quickly.
14. Flash Fill
Flash fill is the ability to fill out information quickly rather than individually. This saves time and frustration. Which may not seem to be a lot, but if you are working full time as an Analyst, for example, you’ll spend a lot of time working with data. This skill will save you a lot of time.
15. Quick Analysis

This essential Excel skill is also a time-saver; it reduces the time required to create charts by helping you create simple data sets. You’ll learn more about this in an Excel training course, but for now, all you need to know is that it saves time!
16. Power View
Power View is a data exploration and visualisation tool on steroids. It pulls and analyses huge quantities of data from external files and is a handy and essential Excel skill to have in 2023. Powerview can build interactive, presentation-ready reports which can even be exported to Powerpoint.
17. Conditional Formatting
Knowing how to use Excel’s conditional formatting functionality allows you to identify data points of interest easily. You’ll discover numerous rules and unlimited applications for this feature, making it crucial if you want to be up there with all of the hot 2023 excel skills.
18. Moving Columns into Rows
It’s a common occurrence when working in excel where you might be working with data in columns, but you need it to be in rows or vice versa. Knowing how to do this little trick is another time saving savvy Excel skill that you need in 2023.
19. IF Formulas
IF and IFERROR are very useful IF formulas in Excel. They let you use conditional formulas to calculate one way when a certain thing is true, and another way when false. For example, you can identify test scores 70 points or higher by making the cell report “Pass” if the score in column C is above 70, and “Fail” if it’s 69 or below.
20. Auditing Formulas
Formula auditing in Excel allows you to graphically display the relationship between formulas and cells, allowing you to audit the formulas and check for errors or edits. This feature makes auditing formula dependents and precedents easily, including object dependencies. It has many uses in the workplace, and while it’s an advanced skill, it’s easy to grasp with the right kind of training.
If you want to explore some of the above-mentioned skills, watch the video below.
Want to advance your employment opportunities? Excel Course is a must!
Microsoft Excel Complete Bundle
24/7 access to the course for 12 months, NO HIDDEN FEES, CPD endorsed certification
Microsoft Excel Complete Bundle
24/7 access to the course for 12 months, NO HIDDEN FEES, CPD endorsed certification
Conclusion
The excel skills featured above are commonly sought after when employers are looking to fill roles as a Personal Assistant, Admin Assistant and other entry-level job roles such as a Bookkeeper or Project Manager. Which means that it makes sense if you want to enhance your opportunities for employment and Excel Course is a must!
Excel is one of the best software programs out there and is a standard requirement in most businesses for that reason. If you are new to Excel or already experience, there will always something new to learn. You’ll never get bored when working with excel but you’ll frequently be delighted Excels power and with what you learn about it.
Read more
- How TikTok Helps Students to Learn?
- The Ultimate Guide to Using ZLibrary and WiseWorksheets to Supercharge Your Learning and Teaching
- How to Promote Your Online Course through Instagram
- Continuous Learning – Is It Really Important?
- What is Duty of Care in Health and Social Care?
- Uncovering Your Untapped Potential: The Impact of IQ Tests on Unleashing Your Inner Brilliance and Finding Personal Satisfaction
- What is BLS Certification for Healthcare Professionals
- Get Ready for School with the Talented and Gifted App
- Which Is Better: A Career In AI Or A Career In Data Science?
- How Technology is Reshaping Education
‘Proficient in Excel’. That’s something we’ve all seen at least once when looking through job adverts.
It doesn’t really matter whether you’re aiming for a position in finance, marketing, or education. It also doesn’t matter if the organization you’re applying for is a multinational corporation or a small NGO.
In fact, being proficient in Microsoft Excel is sometimes listed as a more straightforward alternative to being tech-savvy.
But how can you tell whether you’re really ‘proficient’ in Excel or just average? Does this even matter that much to recruiters?
And most of all – how do you prove your Excel proficiency on your resume? Let’s find out!
What are Excel skills and why are they wanted on your resume
Excel is considered important by recruiters because it allows users to organize data, identify trends, and most importantly – draw priceless conclusions.
It’s not as intuitive as its sibling MS Word, for instance, and requires some time to master. That’s exactly why applicants with strong Excel skills are preferred over others, even if they have less experience.
There are two types of Excel skills — basic and advanced. Basic skills include stuff like being able to add and subtract numbers in different cells, change cell styles, and insert graphs. Advanced Excel skills, on the other hand, include using functions and formulas, creating pivot tables, and knowing how to make your own conditional formatting rules.
And usually, recruiters add ‘Excel skills’ or ‘Proficient Excel user’ to job requirements for two main reasons.
Firstly, to separate strong candidates from weaker candidates. As mentioned above, many recruiters believe Excel to be a complicated software that requires discipline and a strong work ethic to master.
Secondly, to point applicants to the fact that the job will most probably require them to use MS Excel in some form or another.
It’s also worth remembering that an increasing number of recruiters have started using applicant tracking systems (ATS) that screen resumes for certain keywords.
That being said, if knowledge of Excel is mentioned as a job requirement, make sure to list it explicitly in different sections of your resume.
Let’s now look at some examples of specific Excel skills worth adding to your resume!
Examples of excel skills for your resume
Instead of just plainly listing ‘Excel’ or ‘Microsoft Excel’ in your skills section, we advise you to try something less common that will help you stand out. You can list these skills in any part of your resume:
Ms Excel Fundamental Skill Set:
- Task automation using macros and VBA
- Creating dynamic reports with PivotTables
- Building formulas
- Cell formatting
- Managing large datasets with functions: IF, SUM, INDEX, MATCH, VLOOKUP
- Task automation
- Manipulate date, time, text, and arrays
- Building charts and graphs
- Pivot tables and reporting
- Data recording
- VLOOKUP and XLOOKUP
- INDEX MATCH
- Advanced conditional formatting
- Data simulations
- Data validation
- Charts and graphs creation
Pro tip
MS Excel is one of the most asked for skills in business today. Almost any job application that requires computer skills has “MS Excel” listed.
Power phrases for your MS Excel skills on resume
- Used MS Excel to organize company data and budget reports into detailed pivot tables
- Monitored office inventory by tracking stock items with advanced skills in MS Excel
- Automated manual MS Excel tasks using macros which lead to a 12% boost in productivity
You should also aim to give specific examples of situations when your Excel skills have helped you excel in your previous job (pun intended).
Another great option is to mention the courses you’ve taken to strengthen your MS Excel skills. This will show recruiters that you’re inquisitive and passionate about improvement.
How to demonstrate Excel skills on your resume
- List any courses you’ve taken to improve your Excel skills.
- Share more about how you’ve used Excel to optimize different processes.
- Highlight your Excel skills in your resume summary.
- Mention some achievements related to your Excel skills.
- Discuss how having strong Excel skills has helped you do well in your previous job.
Example 1: Show excel skills in the experience section
Date period
-
Built complex Excel models to forecast client growth
-
Identified important trends to suggest working solutions
-
Worked with PM team to create Gantt-charts and optimize internal processes
-
Used Pivot Tables to create quarterly reports
RIGHT
Look at the experience section of this business consultant. They’ve done a great job at illustrating how they use Excel in their daily tasks by mentioning specific tools and functions.
They’ve also implied that they can work both individually and as part of a team, which increases their chance of landing an interview.
Wondering how to describe your work experience? Check out this article!
Example 2: Demonstrate excel skills in the resume summary section
A disciplined yet empathetic Human Resources Manager with 12 years of experience. Able to turn every entry-level candidate into a professional. Proficient in using MS Excel for all stages of the hiring process — assessment, hiring, onboarding, and performance monitoring.
RIGHT
Your resume summary should be no longer than 2-3 sentences and should contain at least some relevant keywords.
In addition to providing insight into what their strengths are, this HR manager has also made it clear that they’re an Excel master.
They have done this by linking MS Excel with specific tasks and responsibilities. This gives context and depth to their whole resume.
Example 3: Show your Excel skills in your achievements sections
Collected and updated old data to optimize future costs using Excel
Used a mix of creativity, design thinking, and Excel to come up with a new and more engaging way of presenting financial data to clients and partners. This increased their satisfaction by 76% on average.
In 2008, I created my first start-up that used Excel to analyze flight prices and suggest what the optimal price for certain destinations was. Later sold this model to Google.
RIGHT
In case there are certain accomplishments you’d like to highlight, you can add an ‘Achievements’ or a ‘Most Proud of’ section to your resume.
Try to mention only things that are linked to your Excel skills or are relevant to the job you’re applying for.
For instance, this Enhancv user has used the achievements section to point out how their Excel skills have helped them succeed throughout the years.
Read this: Why Resume Accomplishments Get You Hired
Example 4: Use a separate skills’ section
Going for a separate technology section increases your chances of landing an interview for one main reason – it’s the perfect place to add keywords and pass ATS.
Here’s one example of using it to emphasize your Excel skills:
Advanced Conditional Formatting
Visual Basic Application (VBA)
RIGHT
Looking for other technical skills worth adding to your resume? Click here!
Should I show or say what level my Excel skills are?
We advise you to not mention the level of your Excel skills explicitly.
Rather, prove your expertise by elaborating on your experience, your accomplishments, and the courses you’ve taken.
This means much more than simply stating ‘Proficient in Excel’. It also gives recruiters an idea of what to expect when working with you.
Last, but not least, different people have different understandings of what ‘proficient’ means. For basic users, it might mean sorting data in a specific way. For experts, it might mean analyzing tens of thousands of numbers and drawing a single conclusion.
Looking for a fun and easy way to build your resume? Check out our free-to-use resume builder!
Should I categorize my excel skills?
Categorizing your Excel skills helps for an organized resume. That’s why we encourage you to have at least some form of category.
This will also help you show you’re well aware of all things Excel could be used for. And isn’t this what you want?
Excel skills: key takeaways for your resume
- Use all sections of your resume: Simply stating ‘Excel’ in your skills section won’t do you any favor
- Link your skills to your achievements: Showing that your knowledge in Excel has helped you smash your goals in the past is always a good idea
- Mention courses and certifications: Use the courses or certifications section to show you’re passionate about strengthening your Excel skills
Looking for more tips on crafting a job-winning resume? Check out this guide!
About this report:
Data reflects analysis made on over 1M resume profiles and examples over the last 2 years from Enhancv.com.
While those skills are most commonly met on resumes, you should only use them as inspiration and customize your resume for the given job.
Содержание
- MS Excel Skills: Example Usage on Resumes, Skill Set & Top Keywords in 2023
- What are Excel skills and why are they wanted on your resume
- Examples of excel skills for your resume
- Ms Excel Fundamental Skill Set:
- Power phrases for your MS Excel skills on resume
- 19 Most Useful Excel Skills That Will Make You Look Like a Spreadsheet Pro (Basic to Advanced)
- Why Excel Skills Are Important in the Job Market
- What Can You Do With Excel Skills?
- Different Types of Excel Skills
- 3 Basic Excel Skills to Start With
- Excel Skill #1: SUM
- Excel Skill #2: COUNT
- Excel Skill #3: AVERAGE
- Top 19 Intermediate Excel Skills to Know
- Excel Skill #4: PivotTables
- Excel Skill #5: Flash Fill
- Excel Skill #6: Filters
- Excel Skill #7: Conditional Formatting
- Excel Skill #8: COUNTIF
- Excel Skill #9: Charts
- Excel Skill #10: SUMIF
- Excel Skill #11: IFERROR
- Excel Skill #12: Slicers
- Excel Skill #13: Power Pivots
- Excel Skill #14: Sparkline
- 5 Advanced Excel Skills to Consider Learning
- Excel Skill #15: INDEX MATCH
- Excel Skill #16: Goal Seek
- Excel Skill #17: Macros in Excel VBA
- Excel Skill #18: INDIRECT
- Excel Skill #19: Get External Data (from Web)
- Where to Learn More About Excel
- 🖥️ Online Excel Courses
- 📚 Excel Books on Amazon
- Frequently Asked Questions About Excel Skills
- 🧠 Is Excel hard to learn?
- ❗ Which Excel skills are most important?
- 📄 How to list Excel skills on a resume?
- 👩💼 What Excel skills are employers looking for?
- 🎓 How to improve/practice your Excel skills?
MS Excel Skills: Example Usage on Resumes, Skill Set & Top Keywords in 2023
‘Proficient in Excel’. That’s something we’ve all seen at least once when looking through job adverts.
It doesn’t really matter whether you’re aiming for a position in finance, marketing, or education. It also doesn’t matter if the organization you’re applying for is a multinational corporation or a small NGO.
In fact, being proficient in Microsoft Excel is sometimes listed as a more straightforward alternative to being tech-savvy.
But how can you tell whether you’re really ‘proficient’ in Excel or just average? Does this even matter that much to recruiters?
And most of all – how do you prove your Excel proficiency on your resume? Let’s find out!
What are Excel skills and why are they wanted on your resume
Excel is considered important by recruiters because it allows users to organize data, identify trends, and most importantly – draw priceless conclusions.
It’s not as intuitive as its sibling MS Word, for instance, and requires some time to master. That’s exactly why applicants with strong Excel skills are preferred over others, even if they have less experience.
There are two types of Excel skills — basic and advanced. Basic skills include stuff like being able to add and subtract numbers in different cells, change cell styles, and insert graphs. Advanced Excel skills, on the other hand, include using functions and formulas, creating pivot tables, and knowing how to make your own conditional formatting rules.
And usually, recruiters add ‘Excel skills’ or ‘Proficient Excel user’ to job requirements for two main reasons.
Firstly, to separate strong candidates from weaker candidates. As mentioned above, many recruiters believe Excel to be a complicated software that requires discipline and a strong work ethic to master.
Secondly, to point applicants to the fact that the job will most probably require them to use MS Excel in some form or another.
It’s also worth remembering that an increasing number of recruiters have started using applicant tracking systems (ATS) that screen resumes for certain keywords.
That being said, if knowledge of Excel is mentioned as a job requirement, make sure to list it explicitly in different sections of your resume.
Let’s now look at some examples of specific Excel skills worth adding to your resume!
Examples of excel skills for your resume
Instead of just plainly listing ‘Excel’ or ‘Microsoft Excel’ in your skills section, we advise you to try something less common that will help you stand out. You can list these skills in any part of your resume:
Ms Excel Fundamental Skill Set:
- Task automation using macros and VBA
- Creating dynamic reports with PivotTables
- Building formulas
- Cell formatting
- Managing large datasets with functions: IF, SUM, INDEX, MATCH, VLOOKUP
- Task automation
- Manipulate date, time, text, and arrays
- Building charts and graphs
- Pivot tables and reporting
- Data recording
- VLOOKUP and XLOOKUP
- INDEX MATCH
- Advanced conditional formatting
- Data simulations
- Data validation
- Charts and graphs creation
Pro tip
MS Excel is one of the most asked for skills in business today. Almost any job application that requires computer skills has “MS Excel” listed.
Power phrases for your MS Excel skills on resume
- Used MS Excel to organize company data and budget reports into detailed pivot tables
- Monitored office inventory by tracking stock items with advanced skills in MS Excel
- Automated manual MS Excel tasks using macros which lead to a 12% boost in productivity
You should also aim to give specific examples of situations when your Excel skills have helped you excel in your previous job (pun intended).
Another great option is to mention the courses you’ve taken to strengthen your MS Excel skills. This will show recruiters that you’re inquisitive and passionate about improvement.
Источник
19 Most Useful Excel Skills That Will Make You Look Like a Spreadsheet Pro (Basic to Advanced)
Updated on June 3rd, 2022 | Sign up for learn to code tips
Table of Contents
Developing Excel skills is a powerful way to start analyzing data like the professionals do. There are so many compelling reasons to learn how to use Excel!
Whether you’re navigating toward a future career as a data analyst, you want a new skill to leverage at work, or you want to turn your household budget into an impressive well-oiled machine, learning how to analyze data in Excel with Excel formulas and tools will definitely ramp up the efficiency of your life.
Here to let us in on his favorite Microsoft Excel skills is Excel professional Adam Lacey, managing director of Excel with Business. In this special guest post, he shares 19 basic, intermediate, and advanced Excel functions and formulas in Excel that you should know—with videos so you can follow along!
If you’re wondering how to become proficient in Excel, these top Excel functions to know will put you on the right path.
Take it away, Adam!
Disclosure: I’m a proud affiliate for some of the resources mentioned in this article. If you buy a product through my links on this page, I may get a small commission for referring you. Thanks!
Why Excel Skills Are Important in the Job Market
Over 30 years after its creation, Microsoft Excel remains the go-to software for the majority of people looking to do some quick data analysis.
Sure, there is bigger, better, more complex software available for data analysis these days, not to mention the free, web-based Google Sheets, but nothing has the broad appeal and powerful simplicity of analyzing data in Excel.
Start coding now
Stop waiting and start learning! Get my 10 tips on teaching yourself how to code.
Success! Now check your email to confirm your subscription.
Numbers rarely lie, which is why making data-driven decisions is so important. Companies need skilled professionals who are able to turn those raw numbers into actionable insights.
Of course, it would take thousands of hours to sift through it all manually and make connections with no tools to help. That’s why learning how to become proficient in Excel and other data programs is the first step for those looking to enter this highly sought-after tech career. The right data analysis skills—including advanced Excel functions—can turn raw information into sound business strategy.
Excel skills can come in handy for a variety of different jobs — not just for data analysts. Like marketing, sales, HR, accounting, admin assistants, the list goes on!
Regardless of your technical experience, understanding data is crucial. So what’s one of the simplest and most accessible ways to start? By mastering basic Excel skills, then leveling up to intermediate Excel skills and advanced Excel formulas.

What Can You Do With Excel Skills?
There are tons of different things you can do with Excel. It’s a super powerful tool that has a range of applications. Examples include:
- Balance sheets
- Budgets
- Editorial calendars
- Data calculators
- Inventory tracking
- Creating forms
- Project management
- Data visualization
- Simple games
- Forecasting
- Expense tracking
- And much more!
The best Excel functions for your needs depend on what you’re using them for. The best Excel skills for business use might be different from the most useful Excel functions for your personal tracking needs. You don’t necessarily need to know how to become an Excel expert just to make a grocery expense tracker. (Although once you start learning Excel skills, you might get addicted!)
Different Types of Excel Skills
So what exactly do we mean by Excel skills? The two most common types of Excel skills are referred to as functions and formulas.
A formula in Excel is an expression that returns a specific result, such as adding, taking the average, etc. Formulas in Excel must begin with an equal sign (=).
A function is a formula with a name and purpose; for example, one of the most useful Excel functions is “SUM,” which adds numbers together.

3 Basic Excel Skills to Start With
Over the last decade, we’ve taught over a million students valuable spreadsheet skills, and we’ve learned a thing or two ourselves. The biggest lesson is that you only need a little Excel training and a handful of Excel basic skills and formulas to start getting brilliant returns from it.
So we got all the Excel experts we know, together, looked at the data we had, and came up with The Definitive 100 Most Useful Excel Tips.
Here are some very basic Excel skills that will get you doing more with Excel than just listing things.
Excel Skill #1: SUM
The SUM function helps you add individual values, cell references or ranges or a mix of all three. If you need to add a column or row of numbers, Excel can do the math for you. All you have to do is select a cell next to the numbers you want to sum, click AutoSum on the Home tab, press Enter, and you’re done.
Excel Skill #2: COUNT
You can use the COUNT function in Excel to get the number of entries in a number field that is in a range of numbers. For example, if you want to count how many numbers are in a column, you can use a formula like A1:A20: =COUNT(A1:A20). If there are 10 numbers in that range, the result is 10.
Excel Skill #3: AVERAGE
Similar to the SUM function, AVERAGE in Excel gives you the average of a range of numbers. You can do this by clicking a cell below the numbers for which you want to find the average. On the Home tab, in the Editing group, click the arrow next to AutoSum, click Average, and then press Enter.
We’ve picked out the top 11 intermediate Excel skills that will help you supercharge your data analysis abilities and spreadsheet skills, preparing you for a fantastic career in tech. We’ve even included a difficulty rating and how long each Excel skill takes to master, so you can pick the best Excel functions and formulas for you.
Excel Skill #4: PivotTables
📈 Difficulty: 3 / 5
⏰ Mastery: 4 hours
At 4 hours to proficiency, PivotTables is one of the more time-intensive and most useful Excel functions to master, but it’s worth it. You can use them to sort, count, total, or average data stored in one large spreadsheet and display them in a new table, cut however you want.
🔎 Where to find it: Launch a PivotTable from the “Tables” section of the Insert tab once you have a table of data.
The versatility of PivotTables is what makes this Excel knowledge so powerful. You simply drag and drop the relevant column data to create the table format you want.
A PivotTable will automatically group matching data, giving you quick summaries from a giant table. For example, if you had a table full of sales data and each line was a product and an amount, in a couple of clicks you could display all the data summed and group by product (something that would take much longer just using formulas or functions). (As a warning, make sure your data is clean first!)
If you are analyzing data with Excel, then PivotTables are THE most valuable Excel skill you can learn.
The LinkedIn Learning course featured in the video is Excel 2016 Essential Training. I’d recommend taking the updated version, Excel 2021 Essential Training.
Excel Skill #5: Flash Fill
📈 Difficulty: 2 / 5
⏰ Mastery: 30 minutes
Excel developed a mind of its own in 2013, which is perfectly illustrated by this Excel professional feature.
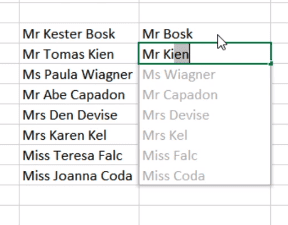
Say you have two columns of names and you need to construct email addresses from them all. With Flash Fill, you can just do it for the first row, and Excel will work out what you mean and do it for the rest (see image and video below). Pre-2013, this was possible but relied on a combination of functions (FIND, LEFT, &, etc). This way is much faster. If you learn how to use Excel tools like this, you WILL impress people even though it’s so easy!
🔎 Where to find it: If Flash Fill is turned on (File Options Advanced) it should just start working as you type. Or, get it going manually by clicking Data > Flash Fill, or Ctrl-E.
👩💻 Where to learn more about Flash Fill: Complete Guide – Flash Fill in MS Excel on Udemy
Excel Skill #6: Filters
📈 Difficulty: 2 / 5
⏰ Mastery: 1 hour
As you become proficient in Excel, you’ll probably want the ability to explore data in a table quickly. Filtering effectively hides data that is not of interest to you.
Usually there’s a value, e.g. ‘Blue cars,’ that you’re looking for, and Filters will bring up those and hide the rest. But in more modern versions of Excel, you can now also filter on number values (e.g. is greater than, top 10%, etc), and cell color.
Filtering becomes an even more useful Excel function when you need to filter more than one column in combination, e.g. both colors and vehicles, to find your blue car. Alt D F F is the shortcut (easier than it sounds—give it a go, pressing the keys in order rather than all together).
Conditional Formatting and Sorting serve related purposes. Sorting involves re-arranging your spreadsheet, which is intrusive and may not be desirable. Conditional formatting brings visualization. Filtering is fast and effective. Choose well. Knowing when to use each is a key part of Excel proficiency.
🔎 Where to find it: Apply filters by going to “Sort & Filter” in the Data tab.
The LinkedIn Learning course featured in the video is Excel: Filtering Data for Beginners.
Excel Skill #7: Conditional Formatting
📈 Difficulty: 3 / 5
⏰ Mastery: 3 hours
Conditional Formatting is a useful Excel skill that can highlight or change the color/appearance of cells given a certain condition. For example, you might want to highlight any negative numbers in red, or cells that contain a certain word. Conditional formatting makes this a breeze and makes colorful sense of data in a noisy world.
Conditional Formatting can be sophisticated. But even the simplest color changes can be hugely beneficial. Suppose you have volumes sold by sales staff each month. Just three clicks can reveal the top 10% of salespeople by performance and tee up an important business conversation.
🔎 Where to find it: On the Home tab in the “Styles” section.
👩💻 Want to learn more about conditional formatting in Excel? Check out this conditional formatting tutorial on Skillshare. (You can even try it for free!)
Excel Skill #8: COUNTIF
📈 Difficulty: 2 / 5
⏰ Mastery: 15 minutes
Next on the list of Excel functions to know, COUNTIF counts cells with certain properties. For example, you want to find out how often a certain entry appears in a list. COUNTIF will look at the list and count it if it matches your chosen criteria. It’s one of the top Excel functions, very simple to learn, and one you’ll use over and over again when analyzing data.
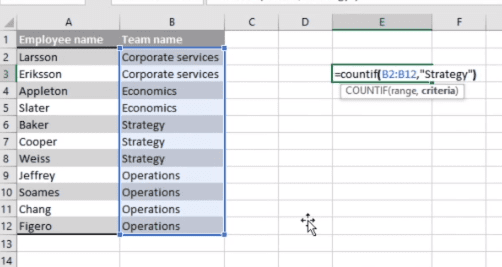
How it works: The syntax for COUNTIF is =COUNTIF(range [range of numbers you are looking at], criteria [criteria you are searching against]
👩💻 Want to learn to use COUNTIF? Check out Excel For Beginners: VLOOKUP, INDEX, MATCH, SUMIFS, COUNTIFS on Udemy.
Excel Skill #9: Charts
📈 Difficulty: 3 / 5
⏰ Mastery: 3 hours
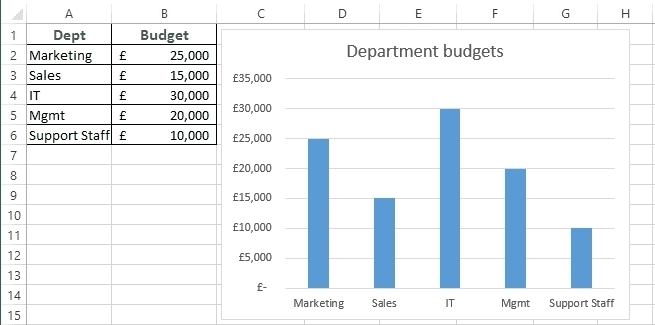
What Excel skills are employers looking for? If your role will involve any sort of data visualization, Charts will probably be one. There are more than 20 chart types in Excel. Most people get by with Bar, Column, Pie, Line, and Scatter charts.
With Bar, Column, Pie, and Line charts, you just need a single series of numbers to generate a chart. With a Scatter, you need two sets of corresponding data to compare (e.g. height vs. weight).
Charts are one of the most effective ways to display the data analysis you’ve conducted. Words and tables tell a story, but an image tells a thousand words; that’s why charts are one of the most useful Excel functions for data analysis.
🔎 Where to find it: Start exploring charts from the “Charts” section of the Insert tab.
👩💻 Want to learn more about Excel charts? Check out this Excel Charts and Visualization course on Mammoth Interactive.
Excel Skill #10: SUMIF
📈 Difficulty: 3 / 5
⏰ Mastery: 15 minutes
SUMIF adds cells with certain properties. Like COUNTIF, these properties include: being a certain number or word (most useful), being above/below certain values, not equaling a value (<>), etc.
Just like COUNTIF, SUMIF is incredibly useful when you want to pull out summary information from large datasets. In the example image below, we are adding together the sales that match the category Cola.
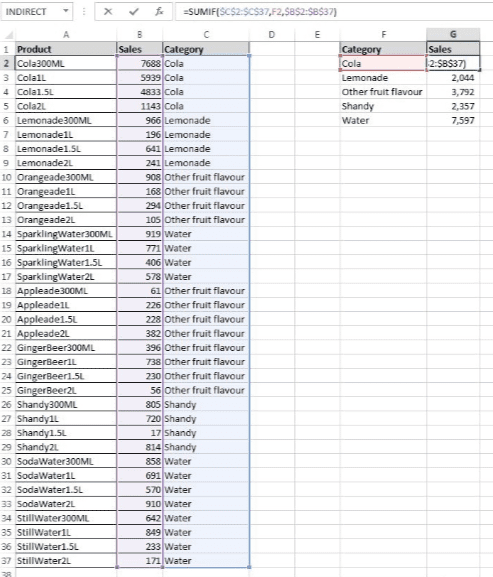
How it works: The syntax for SUMIF is: =SUMIF(range, [the range of cells to look at], criteria [the criteria determining which cells to add], sum range [the cells to add together]
👩💻 Want to learn to use SUMIF? Check out Excel ForBeginners: VLOOKUP, INDEX, MATCH, SUMIFS, COUNTIFS on Udemy.
Excel Skill #11: IFERROR
📈 Difficulty: 2 / 5
⏰ Mastery: 30 minutes
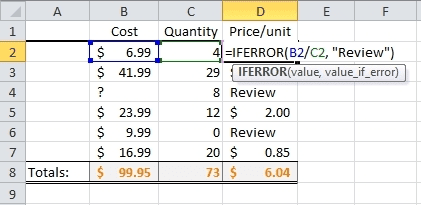
Errors (#VALUE!, #####, #DIV/0!, #REF!, etc) look ugly and can stop calculations from working (e.g. summing over a range of values with a single #DIV/0!). You can avoid it by using =IFERROR().
You can wrap any formula in IFERROR to remove those ugly error codes. For example:
=IFERROR(VLOOKUP(B14,C6:D15,2,FALSE),””)
If this above VLOOKUP was returning an error, it would now return a blank cell. In Excel functions, quotation marks will return the information inside them, so if you put nothing between them (“”) then it returns an empty cell—genius.
Excel Skill #12: Slicers
📈 Difficulty: 2 / 5
⏰ Mastery: 45 minutes
PivotTable slicers do the same thing as Filters—they enable you to show certain data and hide other data as required. But rather than dull drop-down menus, slicers offer nice big friendly buttons to make the whole user experience nicer and easier.
As well as fast filtering, slicers also tell you what the current filtering state is so you know what’s currently in and out of the PivotTable report.
🔎 Where to find it: Add a slicer to your PivotTable from the “Filters” section of the Insert tab.
The LinkedIn Learning course featured in the video is Excel 2013 Essential Training. I’d recommend taking the updated version, Excel 2021 Essential Training.
Excel Skill #13: Power Pivots
📈 Difficulty: 4 / 5
⏰ Mastery: 3 hours
This is a powerful Excel function to know: it brings a lot more firepower to PivotTables (e.g. COUNTROWS) and more processing power to deal with much larger data sets. Power Pivot connects your PivotTables with external databases and can be refreshed on cue.
For example, say you had millions of rows of data—too much for Excel to handle—you could have these saved in an Access or SQL database. Using Power Pivot, you can pull this data into Excel and then run PivotTables and Charts straight off that data.
You can also create relationships between multiple tables, so if you have some data in one database and other data in another, no problem. Bring them together in Power Pivot and display your analysis using PivotTables and Charts.
This is one of those Excel skills for business that is mostly for Excel experts and BI professionals. If you want to get serious about data analysis, then you need to spend some time learning Excel skills like Power Pivot.
🔎 Where to find it: Access it from the Data tab under “Data Tools”.
Excel Skill #14: Sparkline
📈 Difficulty: 2 / 5
⏰ Mastery: 15 minutes
A Sparkline is a tiny chart in a worksheet cell that provides a visual representation of the data selected.
Sparklines are useful for showing useful Excel functions in a series of values, such as seasonal increases or decreases, economic cycles, or to highlight maximum and minimum values. Sparklines can be displayed as lines or columns and can also represent any negative values. Position a Sparkline near its data for greatest impact.
🔎 Where to find it: Add your first Sparkline to your table from the “Sparklines” section of the Insert tab.
👩💻 Where to learn more about Sparkline: Sparklines tutorial video on Coursera.
5 Advanced Excel Skills to Consider Learning
The 14 Excel basic skills above are extremely useful, but they’re only scratching the surface of what this powerful program can do.
Looking to progress to more advanced Excel functions? Start with these 5 advanced Excel formulas and skills.
Start coding now
Stop waiting and start learning! Get my 10 tips on teaching yourself how to code.
Success! Now check your email to confirm your subscription.
Excel Skill #15: INDEX MATCH
This advanced Excel formula is essentially the combination of two functions in Excel. You can use it to look up a value in a big table of data and return a corresponding value in that table.
This is an advanced alternative to the VLOOKUP or HLOOKUP formulas (which have several drawbacks and limitations). It’s more flexible and therefore more powerful than VLOOKUPs.
👩💻 Where to learn it: Index Match video on Coursera
Excel Skill #16: Goal Seek
Goal Seek answers “what if” scenarios. It involves changing values in cells to see how those changes will affect the outcome of formulas on the worksheet.
If you know the result that you want from a formula, but are not sure what input value the formula needs to get that result, that’s where the Goal Seek advanced Excel feature comes in.
Get the course mentioned in the video below here: Learning Excel What-If Analysis via LinkedIn Learning
Excel Skill #17: Macros in Excel VBA
If you have tasks in Excel that you need to do repeatedly, you can use your Excel proficiency to record a macro to automate those tasks. This helps you cut down on annoying or time-consuming busywork so you can focus on more important things!
A macro is an action or a set of actions that you can run as many times as you want. When you create a macro, you are recording your mouse clicks and keystrokes. The macro can then be saved and run whenever it is needed.
Course mentioned in the video: Recording and Managing Excel Macros via Pluralsight
Excel Skill #18: INDIRECT
INDIRECT is an advanced Excel function used to convert a text string into a valid reference.
For instance, you can use it to convert a reference assembled as text (e.g. ‘Sheet1!A1’) into a value reference. So Excel knows to find the value from the cell in A1 rather than treat it as text.
Excel Skill #19: Get External Data (from Web)
Data that you want to use in Excel might not always be stored in another Excel workbook. Sometimes that data may exist externally, e.g. in an access file, in a database, or maybe on the web.
This data can be imported into Excel easily using the ‘Get External Data’ utility. The main benefit of connecting to external data is that you can periodically analyze it in Excel without having to repeatedly copy it, which can be time-consuming and error-prone.
So, we’ve covered 19 of the best Excel functions—but there are still so many more to learn for proficiency in Excel. If you’re interested in seeing the Microsoft Excel skills that didn’t make this list, see the full 100 here!
Where to Learn More About Excel
To really learn how to get good at Excel and become an Excel expert, you need to turn to books and courses!
🖥️ Online Excel Courses
These ten courses will teach you the best Excel functions for your needs, whether you’re just after basic Excel knowledge or you want to know how to become proficient in Excel.
- Excel Skills for Business Specialization on Coursera: A 4-course specialization that teaches advanced Excel features and techniques.
- Excel/VBA for Creative Problem Solving Specialization on Coursera: Teaches you how to automate Excel spreadsheets with Visual Basic for Applications.
- Excel Tips Weekly on LinkedIn Learning: Tune in every Tuesday for a new Excel tip (e.g., productivity-boosting tricks, cool hidden features, need-to-know functions).
- Excel: Advanced Formulas and Functions on LinkedIn Learning: In this course, Excel expert Dennis Taylor demystifies hundreds of formulas and functions available in Excel.
- Microsoft Excel – Excel from Beginner to Advanced on Udemy: Taught by a Microsoft Certified Trainer (MCT) and certified Microsoft Office Master Instructor, this course is great for newcomers to Excel.
- The Ultimate Excel Programmer Course on Udemy: Learn Excel VBA from scratch through 12.5 hours of on-demand video.
- Excel Essentials for the Real World (Complete Excel Course) on Udemy: By the end of the course, you’ll be able to do things like organize, clean, and manage large data, turn messy data into helpful charts, and more.
- Microsoft Excel Programming on Pluralsight: In this learning path, you’ll learn Visual Basic for Applications, built-in Excel functions, Excel macros, and troubleshooting formulas.
- Excel for the Real World: Gain the Basic Skills of Microsoft Excel on Skillshare: A 3-part series that teaches you all the basics of Excel and its practical applications. Taught by a former financial analyst at Google.
- Complete Excel, Python and Machine Learning eDegree on Mammoth Interactive: Start as a beginner and progress throughout 6 courses, gaining skills in Python machine learning with Excel files, building internal apps with Amazon Honeycode and spreadsheets, and much more.
📚 Excel Books on Amazon
Note: All the books listed below are available on Amazon. As an Amazon Associate, I earn from qualifying purchases.
- 101 Most Popular Excel Formulasby John Michaloudis: Nearly 500 pages with step-by-step instructions to take your Excel skills to the next level. Best for intermediate or advanced Excel users.
- Excel 2021: The Most Updated Guide to Master Microsoft Excel from Scratch in 7-Days or Lessby Stan Webber: Over the course of 256 pages, learn the ins and outs of of Excel. A great guide for beginners and even seasoned users.
- Excel 2019 All-in-One For Dummiesby Greg Harvey: Covers basic Excel functions all the way to editing macros with Visual Basic and everything in between. Great for beginners and intermediate Excel users.
- Excel 2019 Bibleby Michael Alexander: Over 1,000 pages of Excel tips, tricks, and techniques. Great for all levels, from beginner to intermediate to power user.
- Excel 2019 Basics: A Quick and Easy Guide to Boosting Your Productivity with Excelby Nathan George: Offers a step-by-step process to becoming skilled with Excel, starting with introductory topics and ending with advanced ones like analyzing your data with charts.
- Excel Basics In 30 Minutesby Ian Lamont: Written in plain English, with lots of step-by-step instructions/screenshots to help you learn the fundamentals of Excel.

Frequently Asked Questions About Excel Skills
If you’re ready to learn how to get better at Excel, that’s excellent (pun intended)! Let’s finish up by covering a few final questions about being an Excel professional.
🧠 Is Excel hard to learn?
It depends on which skills you’re learning! Obviously, basic Excel skills will be faster and easier to learn than Excel advanced functions. But in general, it’s not too difficult to learn Excel functions, especially with plenty of practice.
❗ Which Excel skills are most important?
Understanding the basics as well as the most common and useful Excel functions is generally the most important, such as the 19 skills mentioned in this post. The advanced Excel skills you’ll need to know will differ from employer to employer as well as the type of project you’re working on.
📄 How to list Excel skills on a resume?
Are you learning Excel skills for business reasons? There are a few different ways to display your Excel experience on your resume. First, you can simply list “Excel” in your skill section. You can also say “Advanced Excel” or “Intermediate Excel” depending on your skill level.
Another great way to list Excel experience on your resume is to include it in your work history section. Explain how you specifically used Excel in a previous role or project and what impact it had (e.g. did you save the company time or money?). It can be helpful for employers to see how you used Excel in context to show, rather than just tell them that you know Excel.
👩💼 What Excel skills are employers looking for?
It depends on the employer and role. Skills like PivotTables, VLOOKUP, basic macros, data validation, and graphs/charts are common across a lot of roles. If you’re unsure, try looking up a job you’re interested in and see if the job description lists out any specific Excel skills you’ll need to know.
🎓 How to improve/practice your Excel skills?
There are lots of ways to practice and improve your Excel skills. Try taking a course or tutorial to learn how to use Excel. Then, start working on a project you’re interested in to see if you can apply the skill to your specific use case. You’ll learn a lot by simply doing.
Once you start mastering the power of spreadsheets skills, you’ll wonder how you ever got through life without them. If you want to work in a data-related career, getting proficient in Excel is the perfect first step!
And if you’re still keen to learn more data analysis skills after Excel? There are plenty of courses that teach the ins and outs of data, like the courses from DataCamp.

About the Author
Adam Lacey is Managing Director of Excel with Business, an online training company that has helped improve Excel and Microsoft Office skills for over 1 million people.

About Laurence Bradford
Hey! I’m the creator of Learn to Code With Me, a blog for beginners teaching themselves how to code. Once upon a time, I was digitally unsavvy. But not anymore. Find out how I changed my life by teaching myself digital skills here.
Источник
January 21, 2020
Taking the time to explain your knowledge and skills in Microsoft Excel is worth the effort and time on your resume. Excel skill additions can help you stand out and put you ahead of other candidates in the process of selection for interviews. This article will discuss Excel skills and the best ways to include them on your resume.
What are Excel skills?
Excel skills are those you’ll need for the spreadsheet program in Microsoft Office that many businesses use for recording data, finances, calculations and other valuable information. There are common uses and knowledge of Excel and there are more advanced skills that are an asset to highlight in your resume. Knowing how to use the Microsoft Excel program properly and efficiently will help your resume stand out among others.
When describing your Excel skills on a resume, you should be specific about the skills and tasks you’ve worked with and your knowledge of the program. Being able to explain certain properties and functions you mastered in Excel will showcase your advanced ability with the spreadsheet software.
Common Excel skills to list on your resume
Here are some common functions and data recording uses within Excel that you can highlight on your resume:
Formula functions
Since Excel is a spreadsheet program used to record data, it is an imperative skill to know how to use formulas to measure and calculate all sorts of information. Formulas are used to find the values of cells and are the main function tool of Excel. Knowledge like simple math equations and understanding Excel’s calculation functions are needed to work within the program. In your resume, you will want to explain the functions and calculations you worked with the most while using Excel.
Feature any Excel educational courses you’ve taken to expand your knowledge of formulas and equations. Because there are over 300 formulas and functions in Excel, it is beneficial for you to share examples and feature your knowledge of the program on your resume. This will give employers a clear picture of your knowledge of the program.
Formatting
There are many chart designs and color schemes you can use in Excel. Formatting your spreadsheets does not have to be boring or lack creativity. Maybe you had the freedom to create spreadsheets in Excel with spectacular labels and designs for the company you worked for that were later used in the business’s presentations and promotions. This is a skill you can include in your resume. Tell about a time you made marketing spreadsheets that drove sales to increase or that landed a new business deal with the company.
Being able to format information and data that is visually pleasing is a meaningful skill to have when working with Excel. This could make your next employer desire you over other candidates because you not only can record data correctly and efficiently within Excel, but you also design it in a way that could be marketed for the visual success of the company.
Pivot tables
Pivot tables are highly valued in Excel because they show an interactive view of certain data in a spreadsheet or among many other spreadsheets. With pivot tables, you can group data, form categories, filter data to exclude or include information, break down data into months or years and even build other progress charts. Since pivot tables are a viewing mechanism to show the differences or correlations of a set of information in spreadsheets, this Excel skill is helpful to feature on your resume. Explain how you used pivot tables for the examination of large data over time for your last employer. Highlighting how you’ve used pivot tables to record and show information is a key skill to include on your resume.
VBA knowledge
Visual Basic for Applications (VBA) is the programming language of Excel and all the other Microsoft Office programs. Since you cannot manipulate Excel program software through VBA, the skill with VBA is mastering how to make macros to optimize the time used in Excel. Knowing how to code macros with VBA will create triggers of certain actions in the Excel model. The macro will be activated by the modification of certain cells or there could be an action button created through VBA macros on the worksheet. Stating the use of VBA knowledge with macros to create buttons or triggers into the Excel software is an advanced skill that will make you an impressive candidate to an employer through your resume.
Interfacing Excel with other software
If you worked with other programs using interfacing techniques from Excel, like importing or exporting data, then you should give examples of how you used this within your resume. Employers are always looking for applicants who are diverse in their knowledge of incorporating other programs and tools while using Excel. Interfacing is also an advanced skill that will indicate your level of knowledge. Telling how you interfaced Excel with other programs for your last job or project will tell employers you are highly qualified for the job.
While all of these skills are important and useful in Excel, some of the advanced skills, like VBA knowledge and interfacing, might not be required by the employer. You could do some research into the company or business you are applying for to gain more insight into what Excel skills the employer is expecting from you.
Home / Top 25 EXCEL SKILLS – All Levels (Basic | Intermediate | Advanced) + Test
Check Top 10 Excel Skills out of the Top 25
These days no matter on which profile you are working, from accountant to data analyst, HR to product manager, having Excel skills have huge benefits.
When we talk about Excel skills, we can further categorize them in 3 levels:
- Basic Excel Skills
- Intermediate Excel Skills
- Advanced Excel Skills
And in this tutorial, we will be covering all these three levels in detail, one by one, so let’s get started.
Below you have the top ten basic Excel skills to learn by anyone who is just starting out with Excel needs to learn.
1. Saving and Opening a Workbook
Saving and opening an Excel workbook is just like as you do in any other application.

When you click on the file tab it shows you the option to save the file.

And when you click on the save button it opens the save as dialog box from where you can specify the location and you can also select the file format to use.

Basically, Excel has different file extensions that you can use for saving a workbook. You can use the above steps if you are saving a file for the first time and if you have a file that is already saved in the system, you just need to press Control + S to save the changes.
In the same way, if you want to open a file that is saved on your system you can go to the FILE tab and click on the open.

It shows you the open dialog box from where you can locate the file and open it.
2. Managing Worksheets
Every workbook consists of worksheets where you can add your data and analyze it and once you open an Excel workbook you can see there are tabs at the bottom of the window.

To insert a new worksheet simply click on the plus button or you can also use the shortcut key Shift + F11.

And if you want to delete a worksheet just right-click on the worksheet tab and then select the delete option or you can also use the shortcut key Alt ➜ H ➜ D ➜ S.

But there’s one thing that you need to take care that once you delete a worksheet you can’t get it back.
3. Formatting Cells
In Excel, you have a bunch of options on the home tab for formatting.

- The font group gives you the option to format the font by making it bold, italic, and underline. You can change the font size, and color of the font and cell color.
- From the alignment group, you can define the alignment of the text, add indent, merge-unmerge cells, and wrap the text.
- And from the number group, you can apply accounting format, text format, number format with or without comma style, etc.
Apart from the above options, you can also open the format cell options by right-clicking on a cell and selecting the format option or you can also use the shortcut key Control + 1.

4. Printing
When you go to the File tab, you can find there is a print button that further includes all the printing options that you can use for printing data from a worksheet.
You can also use the shortcut key Control + P to open the print option and once you open it you can see the following options there:

- Print Area
- Range of Pages to Print
- Collision
- Page Orientation
- Page Type
- Margins
- Scaling
5. Excel Functions (Basic)
The biggest power of Excel is its functions that you can use to perform a lot of calculations below you have a list of the top ten Basic Excel Functions:
- SUM: With this function, you can sum values from multiple cells, or you can also input values directly into the function.
- COUNT: This function returns the count of numeric values in a cell. You can refer to the cells where you have values or simply insert the values into them.
- AVERAGE: It returns the average of numeric values. You can refer to the cells where you have the values or simply insert them into the function.
- TIME: It returns a valid time serial number as per Excel’s time format. You need to specify hours, minutes, and seconds.
- DATE: It returns a valid date (date serial number) as per Excel’s time format by using the day, month, and year specified.
- LEFT: It extracts specific characters from a cell/string starting from the left (start). You need to specify the text and number of characters to extract.
- RIGHT: It extracts specific characters from a string starting from the right (last). You need to specify the text and number of characters to extract.
- VLOOKUP: It looks up a value in a column and can return that value or a value from the corresponding columns using the same row number.
- IF: IF function (tests a condition) returns a value when the specific condition is TRUE and returns another value if that condition is FALSE.
- NOW: It returns the current date and time (using your system’s settings) in the cell where you insert it.
And here are the Top 100 Excel Functions for you to learn more.
- String (Text) Functions
- Date Functions
- Time Functions
- Logical Functions
- Math Functions
- Statistical Functions
- Lookup Functions
- Information Functions
- Financial Functions
6. Charts
Once you start working on data probably you need to present it to someone, and a chart is one of the best ways to this.
In Excel, you have a whole list of charts that you can create. Once you go to the Insert tab, and in the charts group you can find all the charts which are available to use.

But to create a chart in Excel you need to have data in the right format, and then you need to select the right type of chart (make sure to check out this guide on chart types). For example, below you have 12 months of data for the sales quantity.

You can create a column chart to present this monthly data.

But you can also use a line chart if you want to show the trend for the 12 months.

But below you have product-wise data.

And in this case, the perfect chart would be a pie chart where you can present the quantity share of these products.

You can also use the recommended charts button to let Excel recommend a chart type according to the data you have.

You just need to select the data and click on the recommended chart button.

You can customize a chart in different ways. Once you select the chart you will have Chart Design and Format tabs where you have all the options for customization.

7. Sorting Data
Excel gives you a powerful option to sort data. To open the sort option, you need to go to the Data Tab and then click on the Sort button.

Now here you have 3 things to define:

- Sort by: The column to use as the base of sorting.
- Sort on: In the sort drop-down, you have 4 different options to sort values on. You can use cell value, cell color, font color, and conditional formatting.
- Order: The order of sorting or a custom order.
You can also use more than one level of sorting. If you want to add a new level simply click on the Add Level and then define all the three things that we have discussed above.

Related: Sort By Date, Date and Time & Reverse Date Sort
8. Find and Replace Option
Just like any other application, Excel has its own find and replace option. The shortcut key to open the find is Control +F and to find and replace it is Control + R.
In the “Find what” input bar, enter the value that you want to find, and in the “Replace with” enter the value with which you want to replace.

Now if you want to replace or find all the values, use the replace all or find all buttons, otherwise, you can use the “Find Next” and “Replace” buttons for a single value.
And once you click on the options button, you’ll see that there are some advanced options that you can use.

- Perform case-sensitive find and replace.
- Find and replace in the entire workbook.
- Find and replace using the cell format.
- And you can also find values from comments and notes.
9. Paste Special Option
The paste special option gives you complete control over how you want to paste values in a cell.
To open the page special option, you need to go to the Home tab and then click on the dropdown “Paste” and click on the paste special (You can also open the page special from the right-click menu).

In the paste special dialog box, you have multiple options that you can use.

Let’s say, you have a cell where you have a formula, but you only want to copy and paste the value from that cell. In this case, simply copy that cell and use the “Values” option from the paste special options on the destination cell.

Or if you want to copy and paste the format from one cell to another you can use the “Formats” option.
Related: Format Painter | Transpose
10. Keyboard Shortcuts
From Excel 2007 to Excel 2019, you can locate a keyboard shortcut by pressing the ALT key. On pressing it, it shows the shortcut keys for the options which are there on the ribbon, just like below.

And from here you can download (Excel Shortcuts Cheat Sheet) which covers the top eighty two keyboard shortcuts for Excel.
More Tutorials on Basic Excel Skills
Now once you master the basic stuff the next thing you need to understand is the Intermediate Excel Skills. Basically, these skills include options and methods to manage and work data in an efficient way.
11. Go To Special
The GO TO SPECIAL option helps you navigate to a specific cell or a range of cells within the worksheet. To open it you need to go to the Home Tab ➜ Editing ➜ Find and Select ➜ Go To special.

As you can see it has different options that you can use and select the different kinds of cells.

For example, if you want to select all the cells which are blank, you need to select the blank and click OK, and it will instantly select all the blank cells.
In the same way, if you want to select cells that have formulas and return numbers, you need to select formulas and then tick-mark numbers, and then click OK.

12. Pivot Table
Pivot Tables are one of the best ways to analyze data. You can create a summary table out of a large data set. To create a pivot table, follow the below steps:
- First, go to the Insert Tab and click on the pivot table button.

- You’ll have a dialog box to specify the source data, but as you have already selected the data it takes the range automatically.

- Once you click OK, you will have a sidebar just like below where you can define the rows, columns, and values for the pivot table that you can simply drag and drop. And now, add “Age” to the rows, “Education” to the column, and “First Name” to the values.

Once you define all, you’ll have a pivot chart like the one below.

More on Pivot Tables
- Rank in a Pivot Table
- Update Pivot Table Range Automatically
- Pivot Table Calculated Field
- Grouping Dates in Pivot Table
- Link multiple Pivot Tables to One Slicer
- Add a Date Timeline to the Current Pivot Table
- Refresh All Pivot Tables
- Running total in Pivot Table
13. Named Range
Named Range is about giving a name to a cell or range of cells. In Excel, every cell has its address which is a combination of row and column.
Related: Excel R1C1 Style
But with the named range you can give that cell or the range of cells a specific name (Generic) and then you can use that name to refer to it.
Let’s say you have a tax percentage in cell A1 and now instead of using the reference, you can give a name to it and then use that name in every calculation.
- To create a named range, you need to go to the Formula Tab ➜ Define Names ➜ Define name.

- Now in the define name dialogue box, you need to define the following things:

- Name of the range.
- Scope to use that range in the entire workbook or just in the worksheet.
- Comment if you want to add any.
- And then the address of the cell or the range.
Now once you click OK, Excel will assign that name to cell A1 and you can use that in formulas to refer to cell A1.

In the same way, you can also create a named range for the range of cells and then you can refer to it in the formulas.
14. Drop Down Lists
A drop-down list is basically a predefined list of values that can help you quickly enter the data in a cell. To create a dropdown list, you need to go to the Data Tab ➜ Data Tools ➜ Data Validation ➜ Data Validation.

Now in the data validation dialog box, you need to select the list from the allow, and then in the source you need to refer to the range from where you want to take values (You can also insert values directly into the source input box).

In the end, click OK
Now when you go back to the cell, you’ll have a dropdown list from which you can select the value to insert into the cell.

More on Drop Down Lists
- Dependent Drop-Down List
- Dynamic Drop-Down List
15. Conditional Formatting
The basic idea of conditional formatting is to use conditions and formulas for formatting and the best part is there are more than 20 options that you can apply with a single click.

Let’s say you want to highlight all the duplicate values from a range of cells, you just need to go to the Home Tab ➜ Conditional Formatting ➜ Highlight Rules ➜ Duplicate Values.

And you also have data bars, color skills, and icons to apply.
Make sure to explore all the options and check out this guide if you want to learn to use formulas in conditional formatting.
16. Excel Table
Excel table converts normal data into a structured table where you can sort, filter, and analyze data easily.

To convert your normal data into an Excel table all you need to do is use the keyboard shortcut key Control + T or you can also go to the Insert tab ➜ Table.

Excel tables by Microsoft | Rename an Excel Table | Excel Slicer
17. Idea Button
If you’re using Office 365 you can have access to the new Idea Button introduced by Microsoft that can help you to analyze your data in an easy way by recommending the possible ways to create:
- Pivot Tables
- Trendline Charts
- Frequency Distribution Chart
You simply need to select the data and then click on the idea button which is on the home tab.

It takes a few seconds to analyze the data and then show you a list of possible outcomes.

18. Using Sparklines
Sparklines are tiny charts you can insert into a cell, based on a range of data.
To insert a sparkline you need to go to the Insert Tab ➜ Sparklines.

There are 3 types of sparklines that you can insert into a cell.
- Line
- Column
- Win-Loss

When you click on the sparkling button it shows you a dialog box where you need to select the data range and the destination range of the sparkling.

Apart from this, you have options to customize a sparkline by changing its color, adding markers, and much more from the sparkline tab.

19. Text to Column
With the text-to-column option, you can split a single column into multiple columns using a separator. It’s one of the best ways to clean and transform your data.
Look at the below table where you have a column with names and between first name and last name there is a space.

You can split this column into two different columns (first name and last name) using text to column by using space as a separator.
- First, go to the Data Tab and click on the Text to Column.

- Now, from the dialog box select delimiter and click next.

- After that, tick-mark the space. As you can see it has separated values from the column using the space.

- In the end, click next and then finish.
The moment you click the finish, it converts that one column of full names into two different columns (first and last name).

20. Quick Analysis Tool
As the name suggests the Quick Analysis Tool allows you to analyze the data with one or two clicks. What I’m trying to say is, it has some of the selected options that can help you to analyze and present the data.
Below you have student data with their score the moment you select it you get a small icon at the bottom of the screen which is the button for the quick analysis tool.

Now when you click on it, it shows you a few tabs from which you can select options. Now let’s explore each tab one by one.
- Formatting: This tab allows you to add conditional formatting to the selected table, like, as data bars, color scale, icon sets, and other conditional formatting rules.

- Charts: This tab shows you some of the recommended charts which you can insert with the selected data or you can also click on more charts to select a specific chart.

- Total: From this tab, you can quickly add some of the basic formulas, like average count, running total, and many more.

- Table: From this tab, you can insert a pivot table with the selected data, and you can also apply an Excel table to it.

- Sparklines: This tab allows you to add sparklines which are basically tiny charts that you can create within a cell.

Advanced Excel Skills
Advanced Excel skills are more about solving complex problems and making you efficient to do all the work done in Excel, and below you have top advanced Excel skills that you need to master.
21. Advanced Excel Formulas
An ADVANCED EXCEL FORMULA (Excel Formulas List) means combining different functions to calculate a specific value that is not possible to calculate otherwise. Below is a list of some of the most important ones:
Advanced Formula Examples
22. Advanced Excel Charts
As you have already seen that you can create most of the charts in Excel with a few clicks, but apart from all those charts you can also create some advanced charts.

Advanced Excel Charts are for a specific purpose and need you to spend a few minutes learning how to create and how they presented data. Below you have a list (tutorials) for some of the Advanced charts that you can learn to create in Excel.
23. Visual Basic for Applications
VBA is an object-oriented programming language for Microsoft office applications, and you can use it in Excel to write VBA codes to automate the activities that you normally perform manually.

24. Power Query
If you work with data, I’m sure you face this situation where you need to clean and transform data before you use it.

Now the thing is cleaning data and transforming data is a tedious process and you need to spend a big chunk of your time on it every day. But with the power query, you can do this entire process of cleaning and transform with a few clicks.
Power query basically works as an ETL where you can extract data from different sources, transform it, and then load it back to the worksheet. Check out this complete tutorial on Power Query and do not forget to learn to combine multiple Excel files.
25. Power Pivot
Power Pivot is basically a data modeling technique that you can use to import data of millions of rows, from multiple sources, and then perform calculations (DAX).

To get started with Power Pivot:
- Introduction to Power Pivot
- Power Pivot – Overview and Learning
Learn More
- Excel Tips and Tricks
- Excel Watch Window
- Excel Formula Bar