Парсинг нетабличных данных с сайтов
Проблема с нетабличными данными
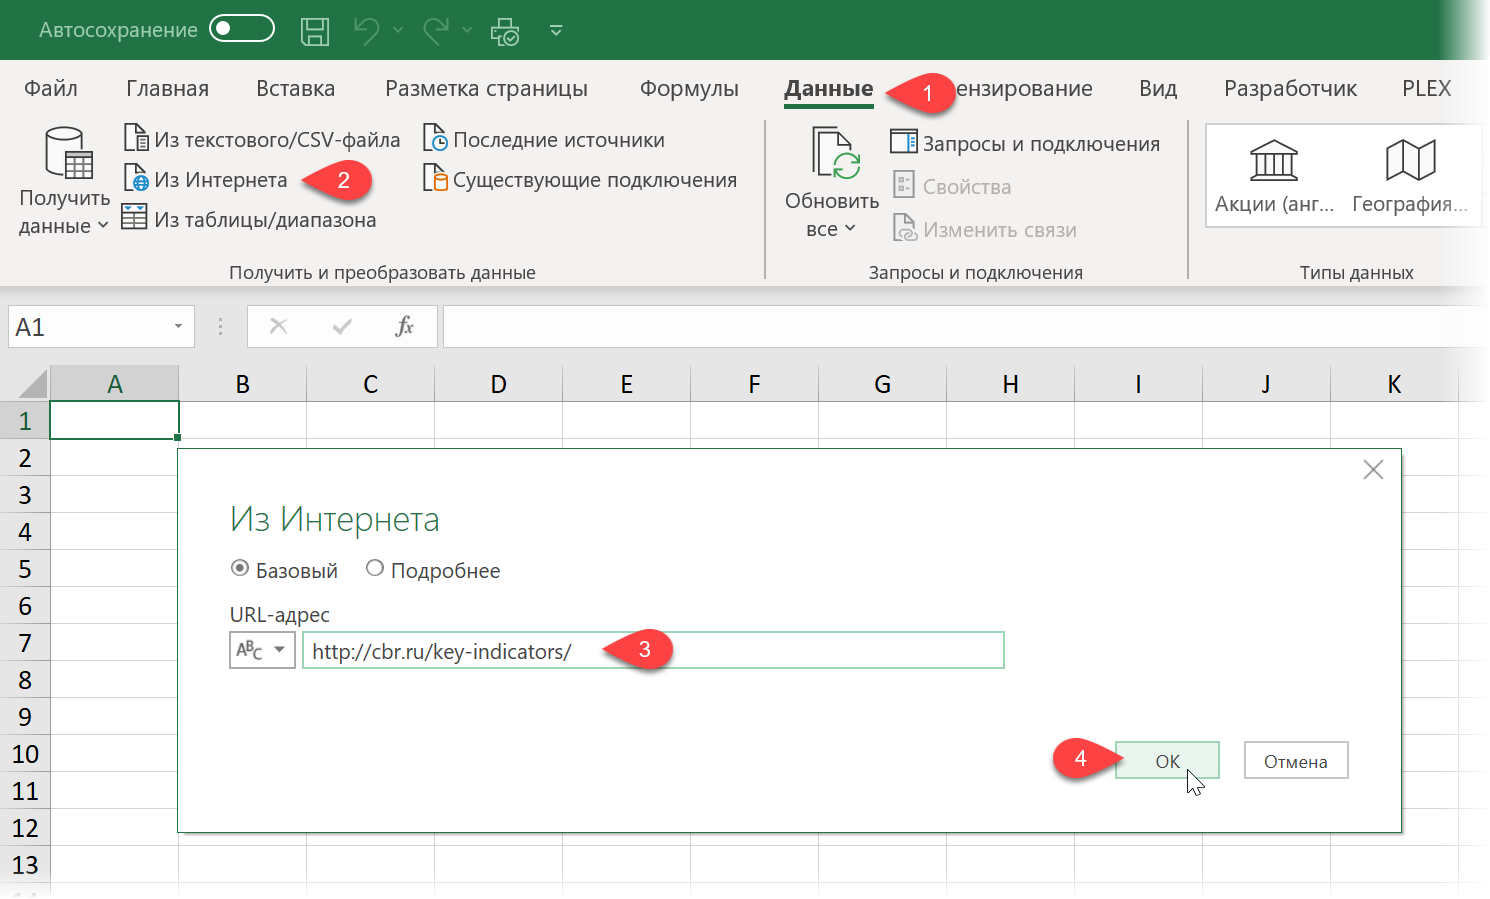
С загрузкой в Excel табличных данных из интернета проблем нет. Надстройка Power Query в Excel легко позволяет реализовать эту задачу буквально за секунды. Достаточно выбрать на вкладке Данные команду Из интернета (Data — From internet), вставить адрес нужной веб-страницы (например, ключевых показателей ЦБ) и нажать ОК:
Power Query автоматически распознает все имеющиеся на веб-странице таблицы и выведет их список в окне Навигатора:
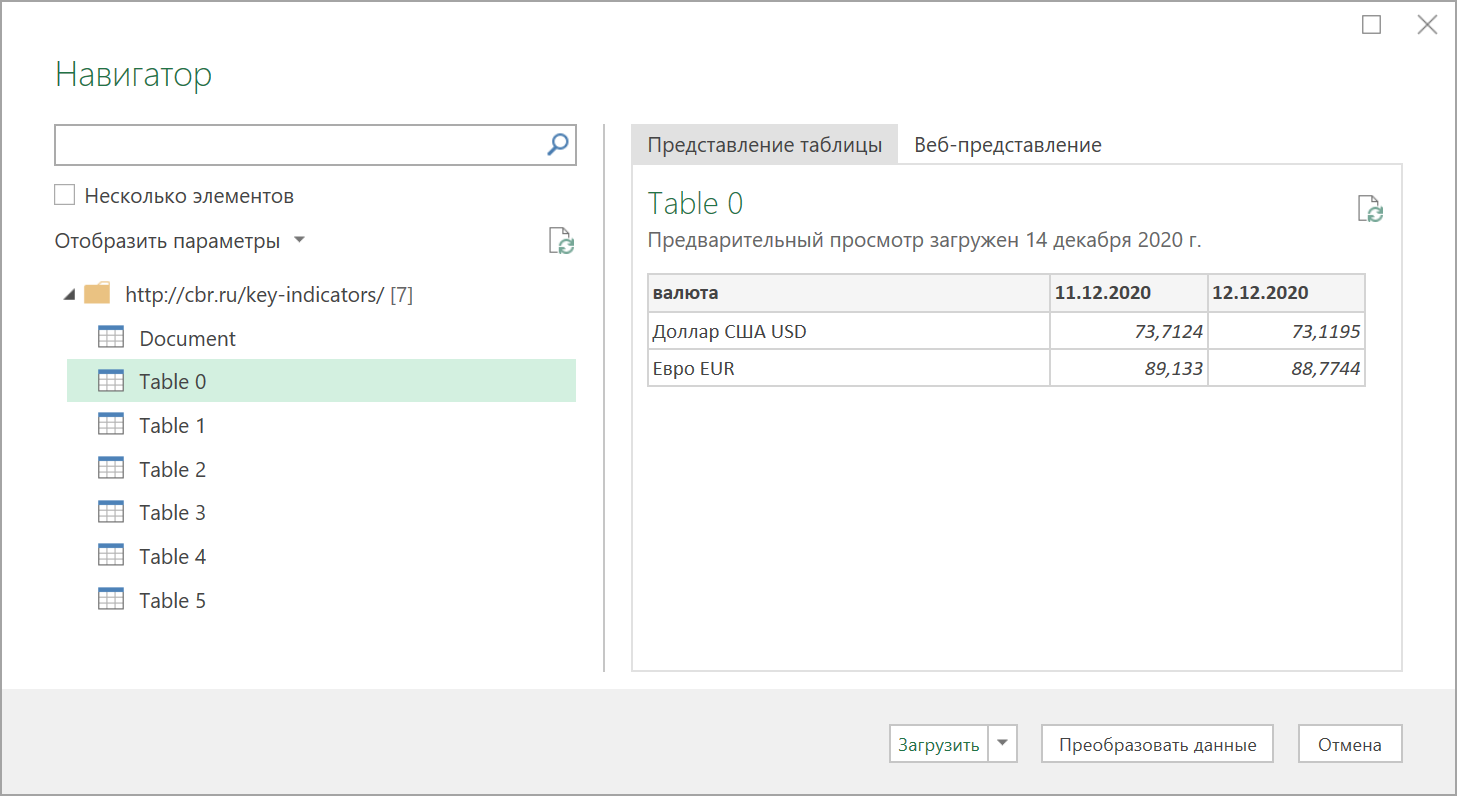
Дальше останется выбрать нужную таблицу методом тыка и загрузить её в Power Query для дальнейшей обработки (кнопка Преобразовать данные) или сразу на лист Excel (кнопка Загрузить).
Если с нужного вам сайта данные грузятся по вышеописанному сценарию — считайте, что вам повезло.
К сожалению, сплошь и рядом встречаются сайты, где при попытке такой загрузки Power Query «не видит» таблиц с нужными данными, т.е. в окне Навигатора попросту нет этих Table 0,1,2… или же среди них нет таблицы с нужной нам информацией. Причин для этого может быть несколько, но чаще всего это происходит потому, что веб-дизайнер при создании таблицы использовал в HTML-коде страницы не стандартную конструкцию с тегом <TABLE>, а её аналог — вложенные друг в друга теги-контейнеры <DIV>. Это весьма распространённая техника при вёрстке веб-сайтов, но, к сожалению, Power Query пока не умеет распознавать такую разметку и загружать такие данные в Excel.
Тем не менее, есть способ обойти это ограничение 
В качестве тренировки, давайте попробуем загрузить цены и описания товаров с маркетплейса Wildberries — например, книг из раздела Детективы:

Загружаем HTML-код вместо веб-страницы
Сначала используем всё тот же подход — выбираем команду Из интернета на вкладке Данные (Data — From internet) и вводим адрес нужной нам страницы:
https://www.wildberries.ru/catalog/knigi/hudozhestvennaya-literatura/detektivy
После нажатия на ОК появится окно Навигатора, где мы уже не увидим никаких полезных таблиц, кроме непонятной Document:

Дальше начинается самое интересное. Жмём на кнопку Преобразовать данные (Transform Data), чтобы всё-таки загрузить содержимое таблицы Document в редактор запросов Power Query. В открывшемся окне удаляем шаг Навигация (Navigation) красным крестом:

… и затем щёлкаем по значку шестерёнки справа от шага Источник (Source), чтобы открыть его параметры:
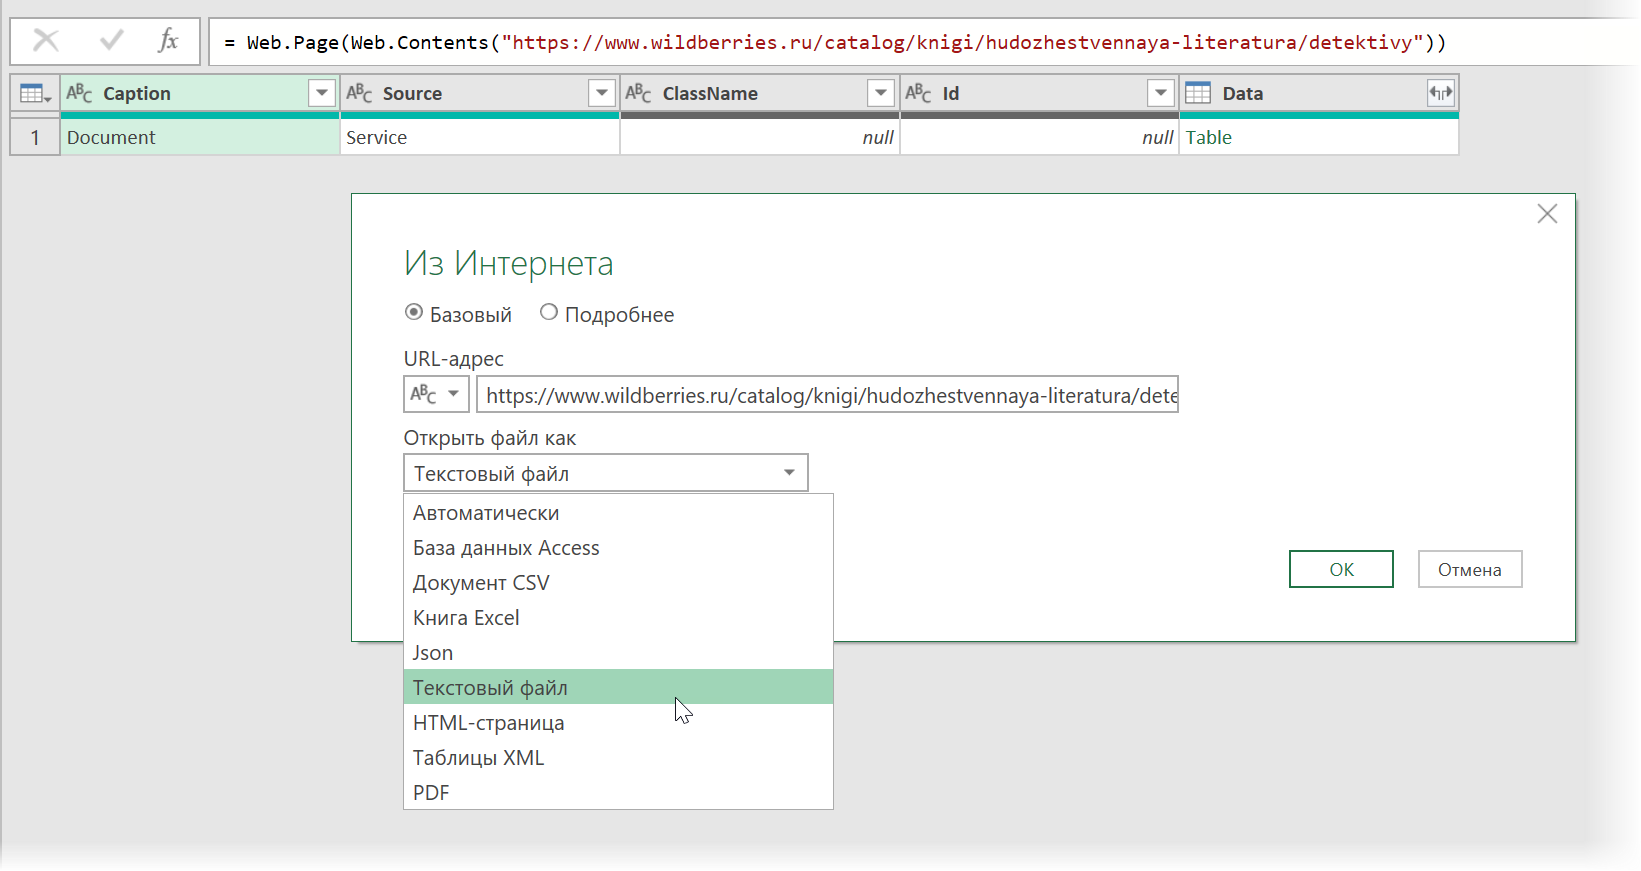
В выпадающием списке Открыть файл как (Open file as) вместо выбранной там по-умолчанию HTML-страницы выбираем Текстовый файл (Text file). Это заставит Power Query интерпретировать загружаемые данные не как веб-страницу, а как простой текст, т.е. Power Query не будет пытаться распознавать HTML-теги и их атрибуты, ссылки, картинки, таблицы, а просто обработает исходный код страницы как текст.
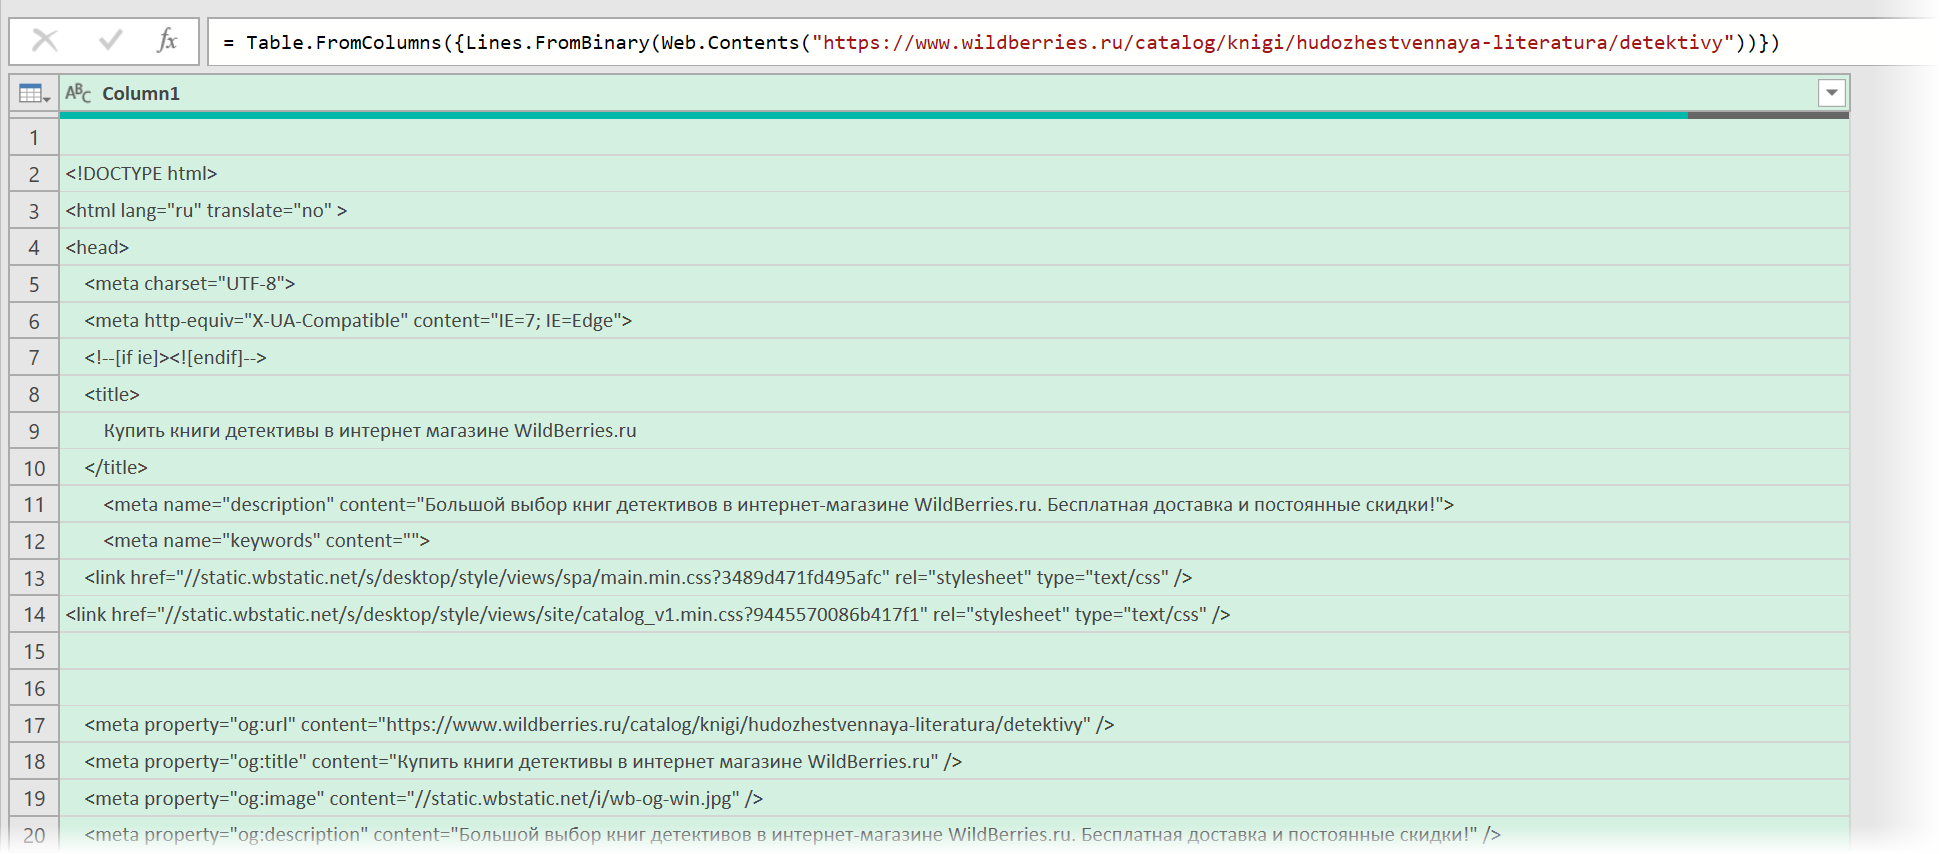
После нажатия на ОК мы этот HTML-код как раз и увидим (он может быть весьма объемным — не пугайтесь):
Ищем за что зацепиться
Теперь нужно понять на какие теги, атрибуты или метки в коде мы можем ориентироваться, чтобы извлечь из этой кучи текста нужные нам данные о товарах. Само-собой, тут всё зависит от конкретного сайта и веб-программиста, который его писал и вам придётся уже импровизировать.
В случае с Wildberries, промотав этот код вниз до товаров, можно легко нащупать простую логику:
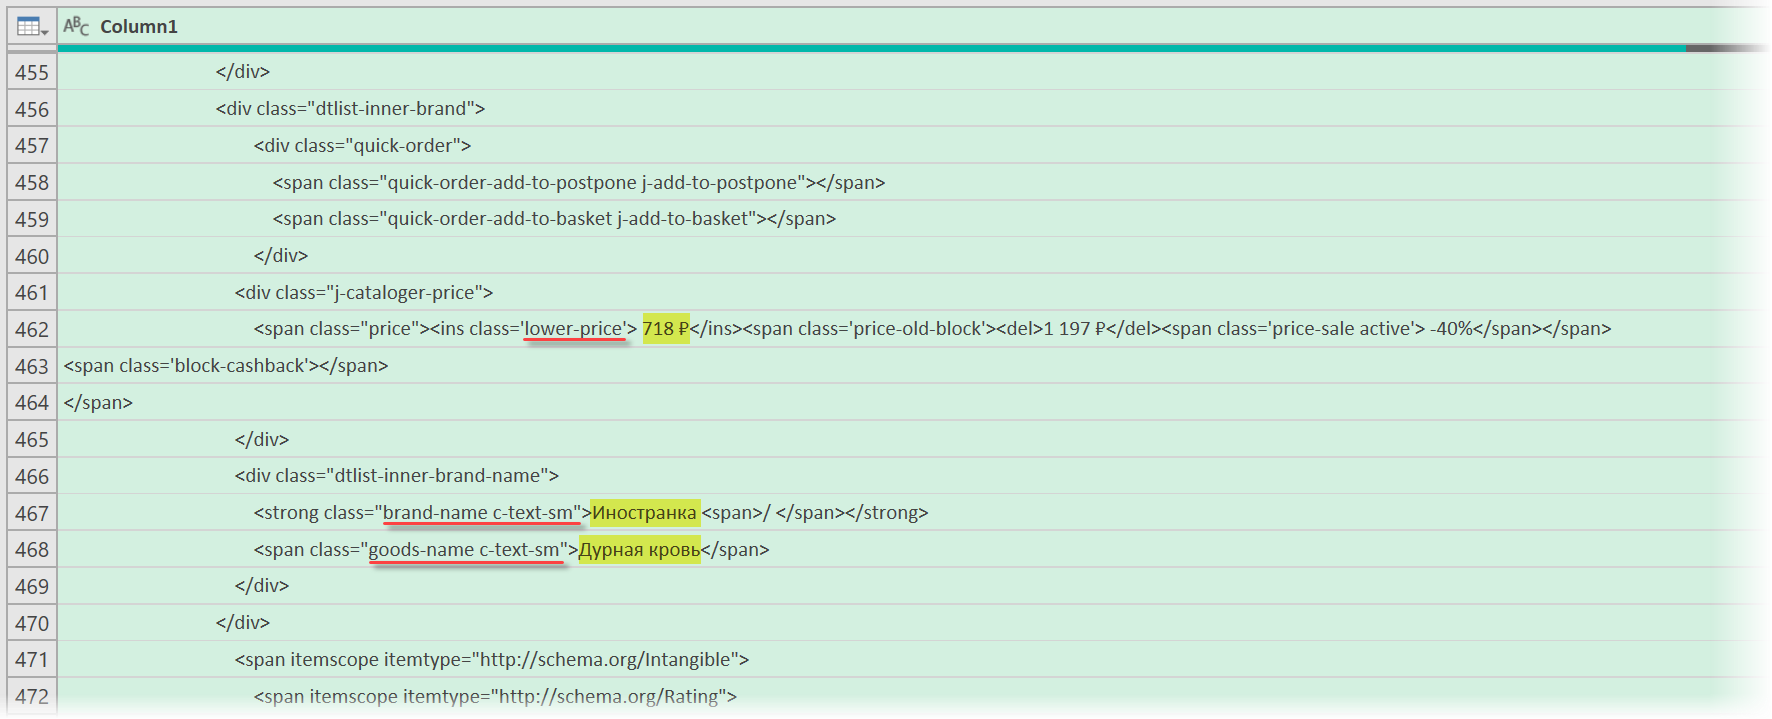
- Строчки с ценами всегда содержат метку lower-price
- Строчки с названием бренда — всегда с меткой brand-name c-text-sm
- Название товара можно найти по метке goods-name c-text-sm
Иногда процесс поиска можно существенно упростить, если воспользоваться инструментами отладки кода, которые сейчас есть в любом современном браузере. Щёлкнув правой кнопкой мыши по любому элементу веб-страницы (например, цене или описанию товара) можно выбрать из контекстного меню команду Инспектировать (Inspect) и затем просматривать код в удобном окошке непосредственно рядом с содержимым сайта:

Фильтруем нужные данные
Теперь совершенно стандартным образом давайте отфильтруем в коде страницы нужные нам строки по обнаруженным меткам. Для этого выбираем в окне Power Query в фильтре [1] опцию Текстовые фильтры — Содержит (Text filters — Contains), переключаемся в режим Подробнее (Advanced) [2] и вводим наши критерии:
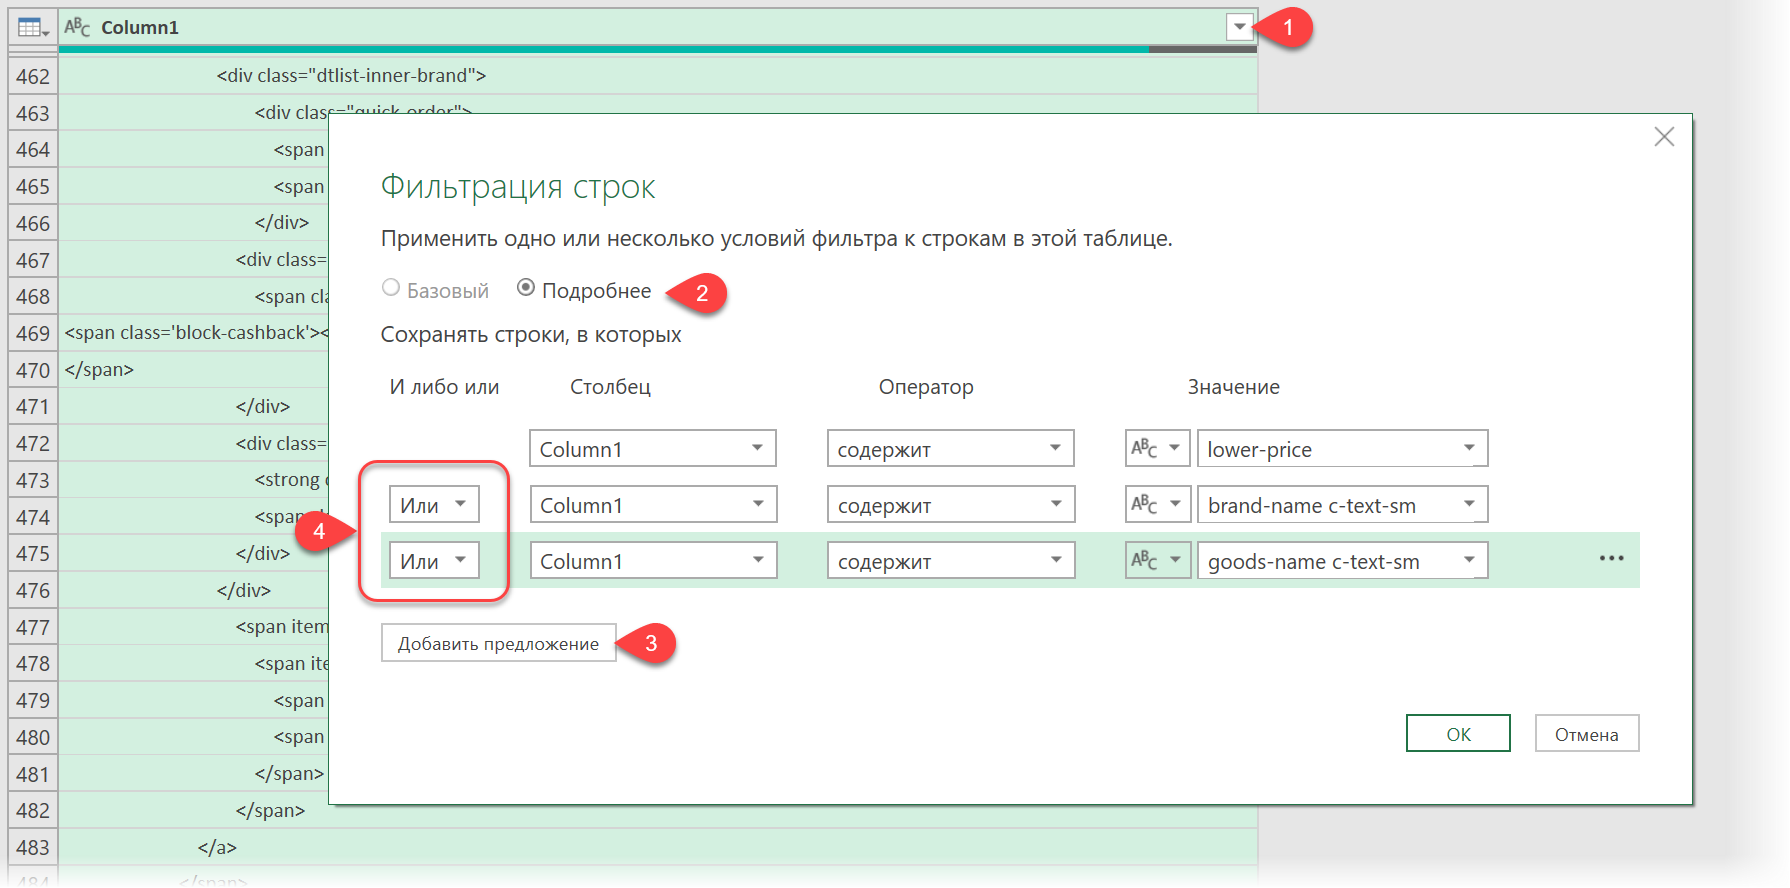
Добавление условий выполняется кнопкой со смешным названием Добавить предложение [3]. И не забудьте для всех условий выставить логическую связку Или (OR) вместо И (And) в выпадающих списках слева [4] — иначе фильтрация просто не сработает.
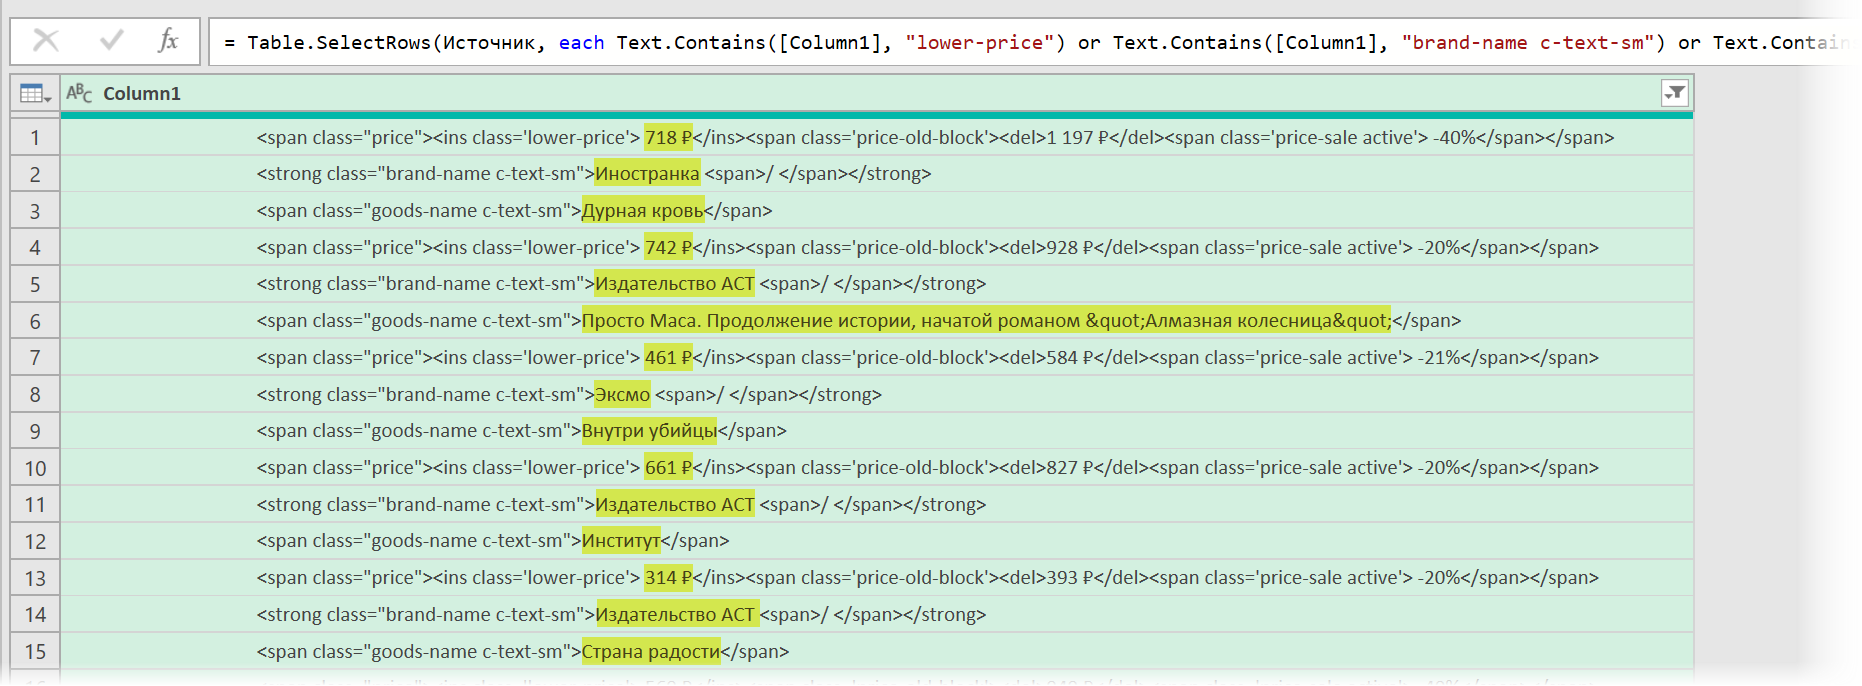
После нажатия на ОК на экране останутся только строки с нужной нам информацией:
Чистим мусор
Останется почистить всё это от мусора любым подходящим и удобным лично вам способом (их много). Например, так:
- Удалить заменой на пустоту начальный тег: <span class=»price»> через команду Главная — Замена значений (Home — Replace values).
- Разделить получившийся столбец по первому разделителю «>» слева командой Главная — Разделить столбец — По разделителю (Home — Split column — By delimiter) и затем ещё раз разделить получившийся столбец по первому вхождению разделителя «<» слева, чтобы отделить полезные данные от тегов:
- Удалить лишние столбцы, а в оставшемся заменить стандартную HTML-конструкцию " на нормальные кавычки.
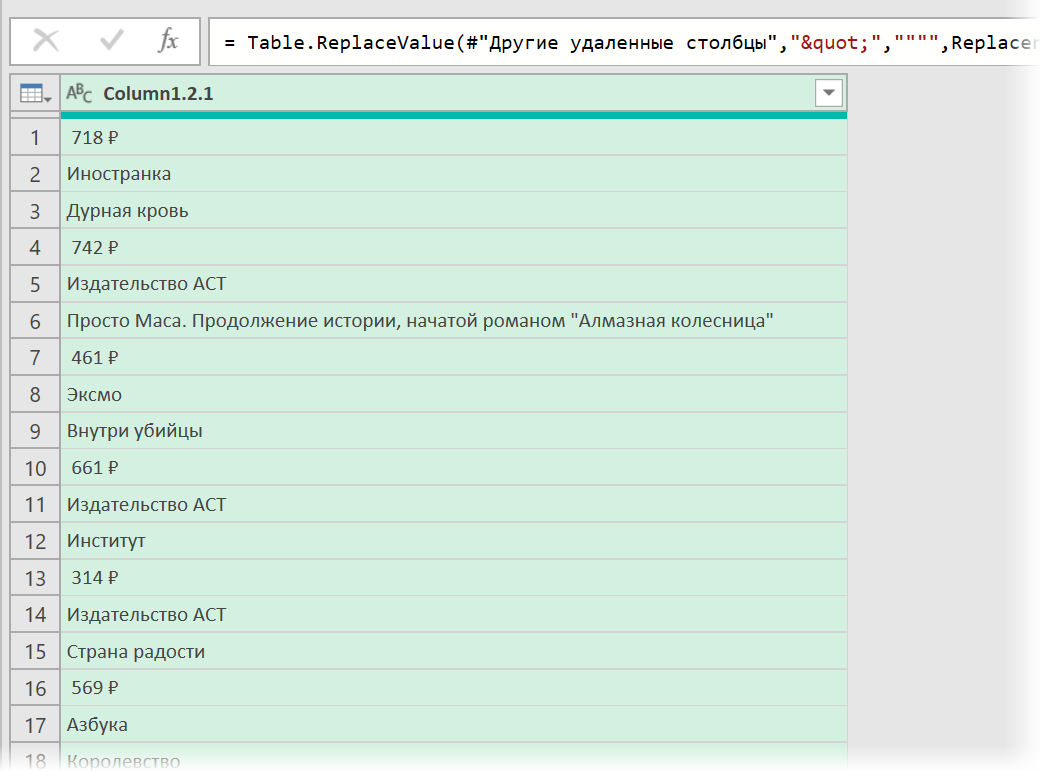
В итоге получим наши данные в уже гораздо более презентабельном виде:
Разбираем блоки по столбцам
Если присмотреться, то информация о каждом отдельном товаре в получившемся списке сгруппирована в блоки по три ячейки. Само-собой, нам было бы гораздо удобнее работать с этой таблицей, если бы эти блоки превратились в отдельные столбцы: цена, бренд (издательство) и наименование.
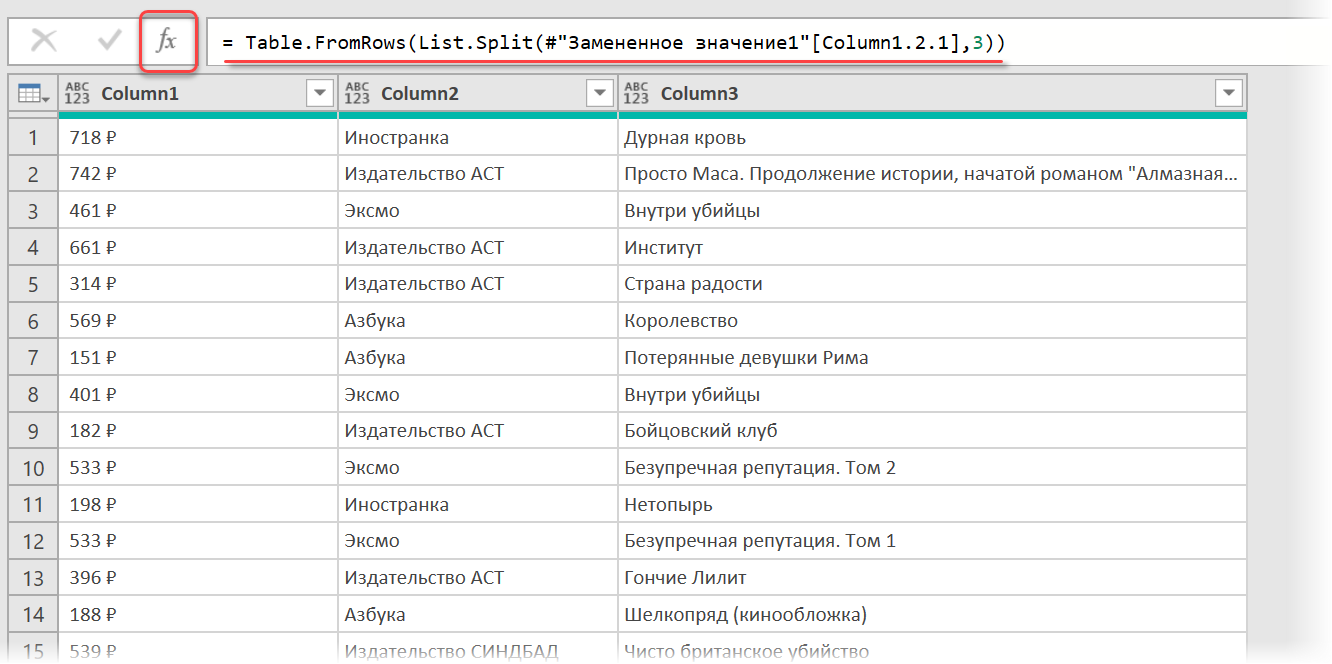
Выполнить такое преобразование можно очень легко — с помощью, буквально, одной строчки кода на встроенном в Power Query языке М. Для этого щёлкаем по кнопке fx в строке формул (если у вас её не видно, то включите её на вкладке Просмотр (View)) и вводим следующую конструкцию:
= Table.FromRows(List.Split(#»Замененное значение1″[Column1.2.1],3))
Здесь функция List.Split разбивает столбец с именем Column1.2.1 из нашей таблицы с предыдущего шага #»Замененное значение1″ на кусочки по 3 ячейки, а потом функция Table.FromRows конвертирует получившиеся вложенные списки обратно в таблицу — уже из трёх столбцов:
Ну, а дальше уже дело техники — настроить числовые форматы столбцов, переименовать их и разместить в нужном порядке. И выгрузить получившуюся красоту обратно на лист Excel командой Главная — Закрыть и загрузить (Home — Close & Load…)
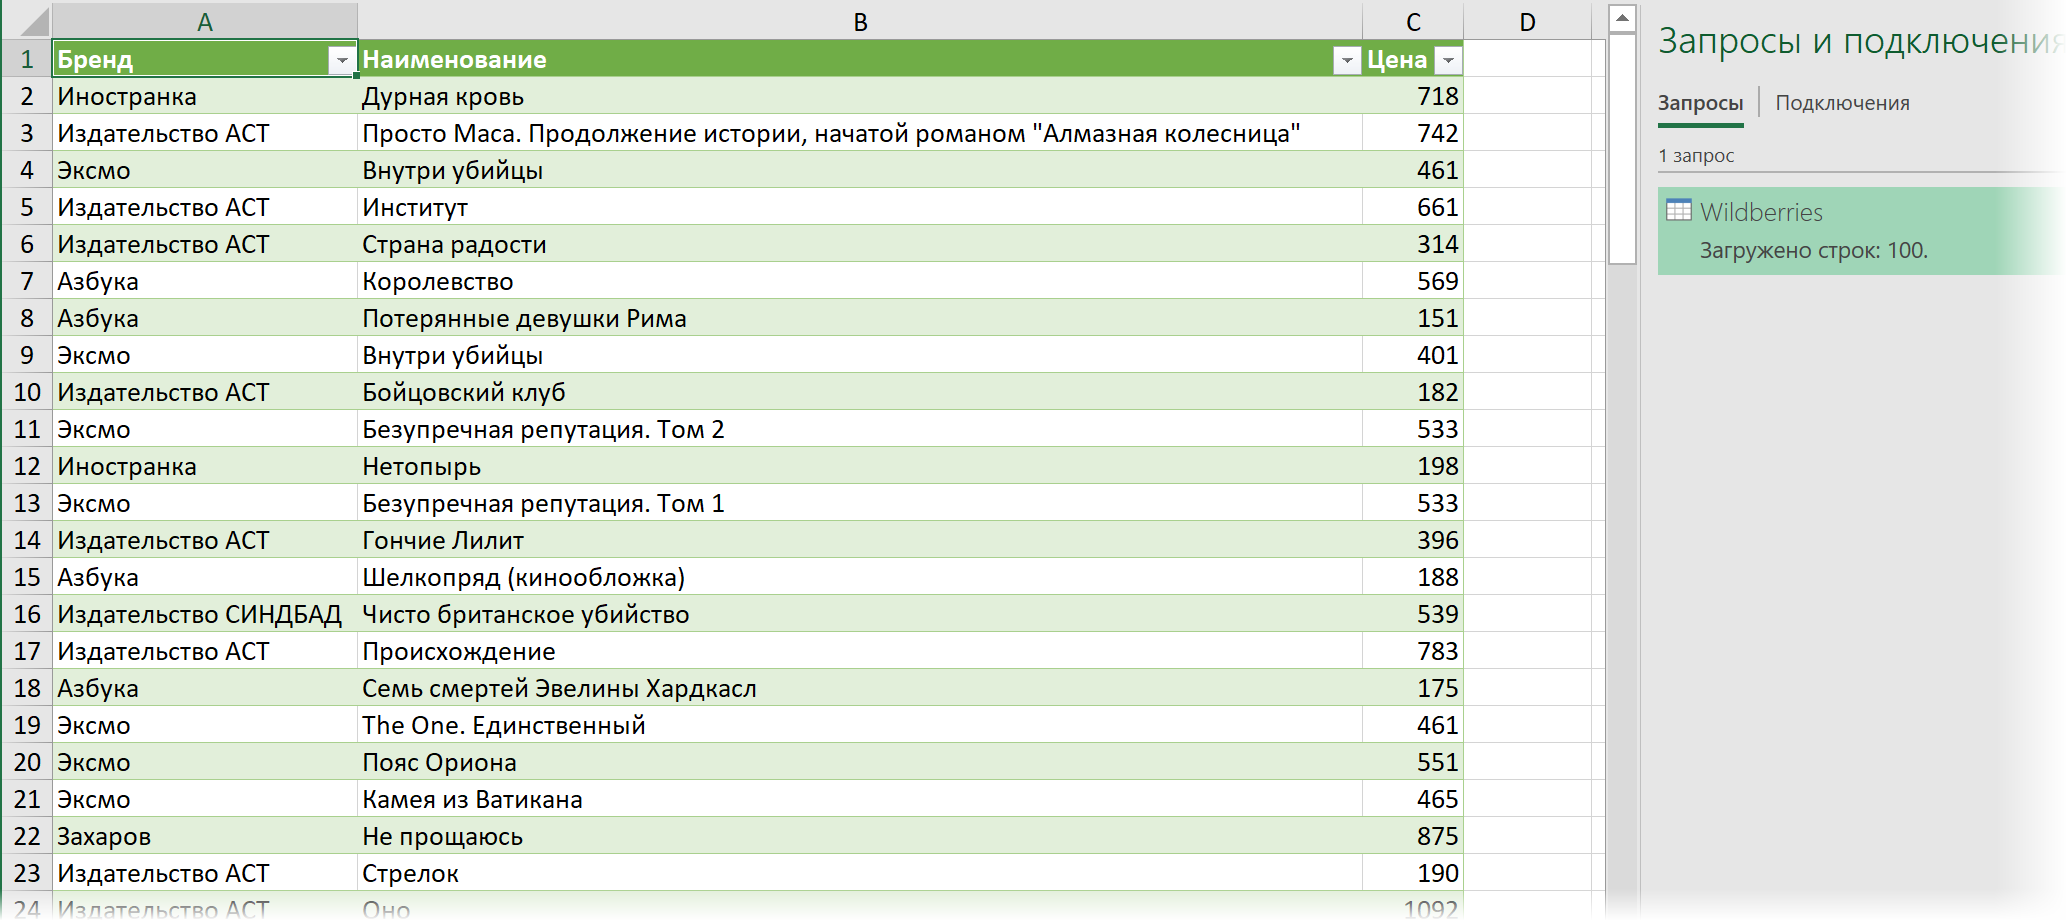
Вот и все хитрости 
Ссылки по теме
- Импорт курса биткойна с сайта через Power Query
- Парсинг текста регулярными выражениями (RegExp) в Power Query
- Параметризация путей к данным в Power Query
See all How-To Articles
This tutorial demonstrates how to import an HTML table into Excel or Google Sheets.
Import Table Data From Website
Using the Power Query feature, you can pull live data directly from a website into Excel.
- Open the Excel file that you wish to import the data into.
- In the Ribbon, select Data > Get & Transform Data > From Web.
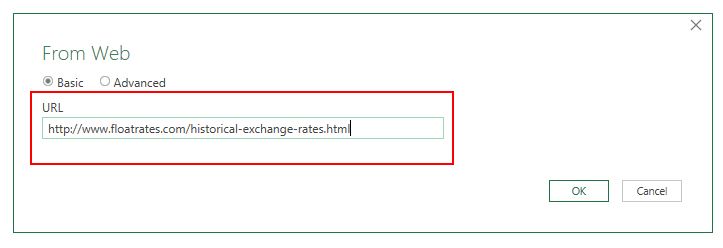
- Type in the URL from which you wish to fetch the data and click OK.
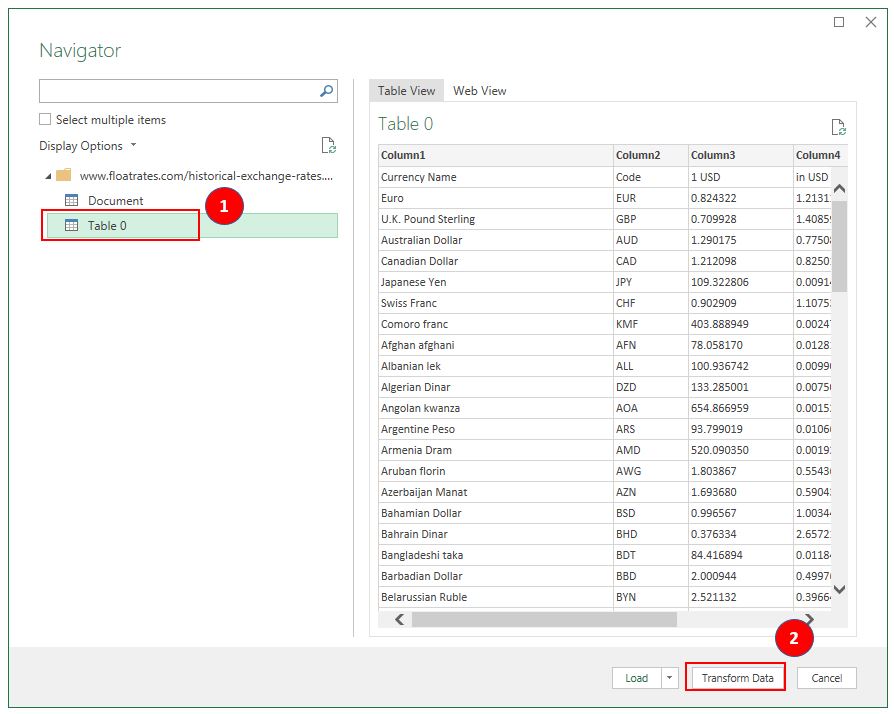
- In the Navigator, on the left, select the table to be imported, then click Transform Data.
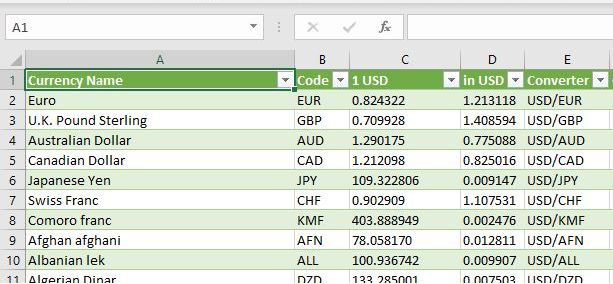
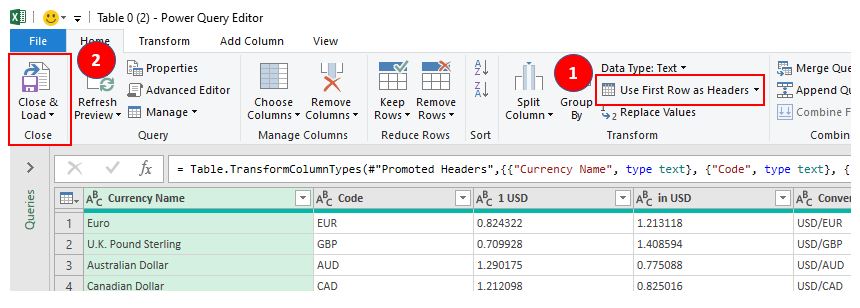
- The Power Query Editor will open. Manipulate the table as required – in this case, select Use First Row as Headers. Then to load the data, click Close and Load.
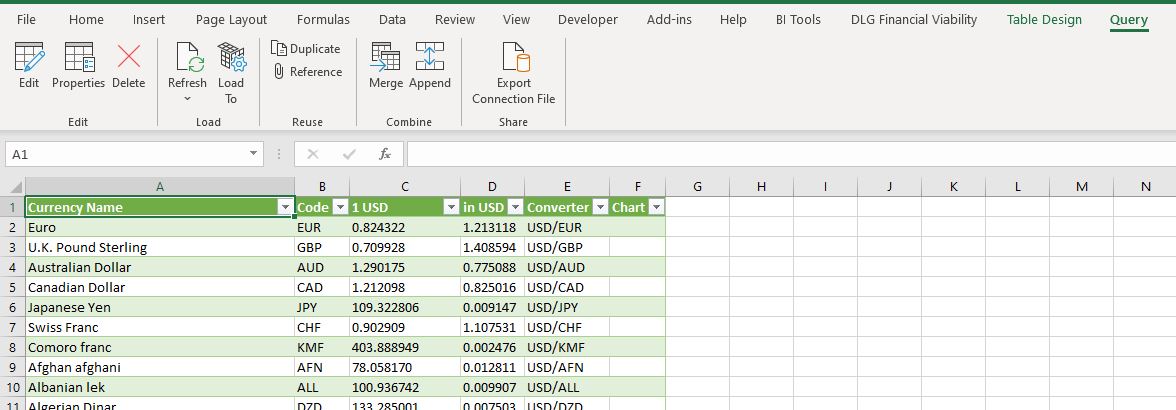
- The table will then be loaded into Excel with two new Ribbon tabs available: Table Design and Query.
How to Import an HTML Table into Google Sheets
- Open the Google sheet where the data needs to be imported to and select the cell where the data will be positioned.
- Then, type in an HTML import formula such as the one shown below:
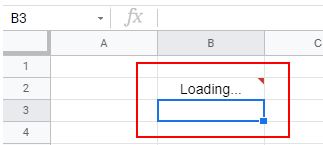
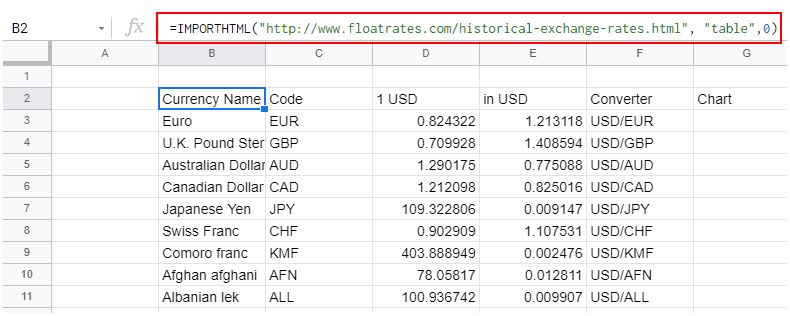
=IMPORTHTML("http://www.floatrates.com/historical-exchange-rates.html", "table",0)- As soon as you press ENTER, Google Sheets will try to load the data into the sheet.
Once done, the data will be displayed.
The reason the solution you found on the internet is no working is because of the line that starts var colCount. The variable mytable only has two elements being <thead> and <tbody>. The var colCount line is looking for all the elements within mytable that are <tr>. The best thing you can do is give an id to your <thead> and <tbody> and then grab all the values based on that. Say you had <thead id='headers'> :
function write_headers_to_excel()
{
  str="";

  var myTableHead = document.getElementById('headers');
  var rowCount = myTableHead.rows.length;
  var colCount = myTableHead.getElementsByTagName("tr")[0].getElementsByTagName("th").length;

var ExcelApp = new ActiveXObject("Excel.Application");
var ExcelSheet = new ActiveXObject("Excel.Sheet");
ExcelSheet.Application.Visible = true;

for(var i=0; i<rowCount; i++)
{
    for(var j=0; j<colCount; j++)
    {
        str= myTableHead.getElementsByTagName("tr")[i].getElementsByTagName("th")[j].innerHTML;
        ExcelSheet.ActiveSheet.Cells(i+1,j+1).Value = str;
    }
}

}
and then do the same thing for the <tbody> tag.
EDIT: I would also highly recommend using jQuery. It would shorten this up to:
function write_to_excel()
{
 var ExcelApp = new ActiveXObject("Excel.Application");
 var ExcelSheet = new ActiveXObject("Excel.Sheet");
 ExcelSheet.Application.Visible = true;

  $('th, td').each(function(i){
    ExcelSheet.ActiveSheet.Cells(i+1,i+1).Value = this.innerHTML;
  });
}
Now, of course, this is going to give you some formatting issues but you can work out how you want it formatted in Excel.
EDIT: To answer your question about how to do this for n number of tables, the jQuery will do this already. To do it in raw Javascript, grab all the tables and then alter the function to be able to pass in the table as a parameter. For instance:
var tables = document.getElementsByTagName('table');
for(var i = 0; i < tables.length; i++)
{
  write_headers_to_excel(tables[i]);
  write_bodies_to_excel(tables[i]);
}
Then change the function write_headers_to_excel() to function write_headers_to_excel(table). Then change var myTableHead = document.getElementById('headers'); to var myTableHead = table.getElementsByTagName('thead')[0];. Same with your write_bodies_to_excel() or however you want to set that up.
Improve Article
Save Article
Like Article
Improve Article
Save Article
Like Article
Any HTML table that you have created can be converted into an Excel Spreadsheet by using jQuery and it is compatible with all browsers. There are two simple approaches that require basic HTML and jQuery knowledge to achieve this.
- Approach 1: Using jQuery plugin: A simple jQuery plugin ‘table2excel’ can be used for converting an HTML table to an excel sheet.
Syntax:
$("#table-id").table2excel({
    filename: "excel_sheet-name.xls"
});
- Example:
html
<table id="studtable">
<tr>
<th>ID</th>
<th>Name</th>
<th>Age</th>
<th>Address</th>
</tr>
<tr>
<td>101</td>
<td>Alex</td>
<td>15</td>
<td>Maldives</td>
</tr>
<tr>
<td>102</td>
<td>Chris</td>
<td>14</td>
<td>Canada</td>
</tr>
<tr>
<td>103</td>
<td>Jay</td>
<td>15</td>
<td>Toronto</td>
</tr>
</table>
<script>
$(document).ready(function () {
$("#studtable").table2excel({
filename: "Students.xls"
});
});
</script>
- Output:
ID    Name    Age    Address
101    Alex    15    Maldives
102    Chris    14    Canada
103    Jay    15    Toronto
- The above output gets converted into an Excel spreadsheet in the exact same manner the HTML table is. About ‘table2excel’: The ‘table2excel’ is a simple yet useful jQuery plugin that allows for exporting HTML table data to an Excel file. The ‘table2excel’ also has a feature to exclude cells that contain a specified class. Syntax for noExport:
$(document).ready(function() {
    $("#table-id").table2excel({
        exclude: ".noExport",
        filename: "name-of-the-file",
    });
});
- Example code for excluding some specified cells:
html
<script src=
"//ajax.googleapis.com/ajax/libs/jquery/2.2.4/jquery.min.js">
</script>
<script src=
"//cdn.rawgit.com/rainabba/jquery-table2excel/1.1.0/dist/jquery.table2excel.min.js">
</script>
<button>Export</button>
<table>
<thead>
<tr>
<td class="noExport">
This cell will not be exported.
</td>
<td>
This cell will get exported.
</td>
</tr>
</thead>
<tbody>
<tr>
<td>Alex</td>
<td class="noExport">Maldives</td>
</tr>
<tr>
<td>Chris</td>
<td>Canada</td>
</tr>
</tbody>
</table>
- Note: In the above sample code, the class ‘.noExport’ has been used to exclude those specified cells from the HTML table data. Therefore the exported Excel Spreadsheet also does not include those cells from the HTML table data.
- Approach 2: Using simple HTML: Consider the same students table above to understand the below. Let’s use a button in our code which when clicked to converts the HTML data table into an Excel spreadsheet. Note that the ‘export’ button below does not actually convert the HTML table to an excel sheet. This has to used in a proper and already existing HTML code to get the Excel spreadsheet and will not work in this IDE.
html
<!DOCTYPE html>
<html>
<head>
<title>
HTML Table To Excel
spreadsheet using
HTML only
</title>
</head>
<body>
<table id="studtable">
<tr>
<th>ID</th>
<th>Name</th>
<th>Age</th>
<th>Address</th>
</tr>
<tr>
<td>101</td>
<td>Alex</td>
<td>15</td>
<td>Maldives</td>
</tr>
<tr>
<td>102</td>
<td>Chris</td>
<td>14</td>
<td>Canada</td>
</tr>
<tr>
<td>103</td>
<td>Jay</td>
<td>15</td>
<td>Toronto</td>
</tr>
</table>
<button onclick="tableToExcel(
'studtable', 'Students')">
Click to Export
</button>
</body>
</html>
- Output:
HTML is the foundation of webpages, is used for webpage development by structuring websites and web apps. jQuery is an open source JavaScript library that simplifies the interactions between an HTML/CSS document, It is widely famous with it’s philosophy of “Write less, do more“.
- HTML Tutorial and HTML Examples.
- jQuery Tutorial and jQuery Examples.
Like Article
Save Article
Обычно экспорт в txt, csv или excel. txt и csv обычно используются для обмена данными между системами,
Однако, как правило, Excel имеет лучший эффект отображения и может быть экспортирован в соответствии с определенным шаблоном. Экспорт не нужно набирать. Он прост в использовании. Если он используется в качестве отчета, он обычно экспортируется в файл Excel. .
Однако экспорт данных в Excel с использованием компонентов com очень медленный. Другой способ создания файлов Excel — это быстро экспортировать данные через html и css и одновременно установить стиль. У использования этого метода есть два преимущества: 1 — быстрый, 2 — Нет необходимости устанавливать поддержку Excel.
Реализация заключается в том, что его можно напрямую преобразовать в excel через html. Есть два основных момента: один — отображать строку таблицы, например, ASP.net напрямую экспортирует excel через Gridview, он не отображает таблицу
Второй — установить формат данных.
1. Отображается строка таблицы:
Добавьте следующий код в тег заголовка html:
<xml>
<x:ExcelWorkbook>
<x:ExcelWorksheets>
<x:ExcelWorksheet>
<x:Name>Заголовок рабочего листа</x:Name>
<x:WorksheetOptions>
<x:Print>
<x:ValidPrinterInfo />
</x:Print>
</x:WorksheetOptions>
</x:ExcelWorksheet>
</x:ExcelWorksheets>
</x:ExcelWorkbook>
</xml>
2. Установите формат данных:
Добавить определение css в заголовок
<style type=»text/css»>
.spercent
{
background-color:#ffff99;
mso-number-format:0.00%;
}
</style>
Добавить в css: mso-number-format определяет формат данных. Формат можно просмотреть в Excel. Для получения дополнительной информации см.
mso-number-format:»0″ NO Decimals
mso-number-format:»0.000″ 3 Decimals
mso-number-format:»#,##0.000″ Comma with 3 dec
mso-number-format:»mm/dd/yy» Date7
mso-number-format:»mmmm d, yyyy» Date9
mso-number-format:»m/d/yy h:mm AM/PM» D -T AMPM
mso-number-format:»Short Date» 01/03/1998
mso-number-format:»Medium Date» 01-mar-98
mso-number-format:»d-mmm-yyyy» 01-mar-1998
mso-number-format:»Short Time» 5:16
mso-number-format:»Medium Time» 5:16 am
mso-number-format:»Long Time» 5:16:21:00
mso-number-format:»Percent» Percent — two decimals
mso-number-format:»0%» Percent — no decimals
mso-number-format:»0.E+00″ Scientific Notation
mso-number-format:»@» Text
mso-number-format:»# ???/???» Fractions — up to 3 digits (312/943)
Экспортированный Excel можно открыть напрямую через Excel, эффект будет следующим:
Полный код:
{
protected const string HEADER = «<html xmlns:x=»urn:schemas-microsoft-com:office:excel»>» +
«<meta http-equiv=Content-Type content=»text/html; charset=»gb2312″>» +
«<head>» +
«<!—[if gte mso 9]><xml>» +
«<x:ExcelWorkbook>» +
«<x:ExcelWorksheets>» +
«<x:ExcelWorksheet>» +
«<x: Name> Название рабочего листа </ x: Name>» +
«<x:WorksheetOptions>» +
«<x:Print>» +
&n bsp; «<x:ValidPrinterInfo />» +
«</x:Print>» +
«</x:WorksheetOptions>» +
«</x:ExcelWorksheet>» +
«</x:ExcelWorksheets>» +
«</x:ExcelWorkbook>» +
«</xml>» +
«<![endif]—>» ;
const string STYLE=»<style type=»text/css»>» +
«.spercent» +
» {» +
» background-color:#ffff99;» +
» mso-number-format:0.00%;» +
» }» +
«.sId» http://msnpiki.msnfanatic.com/index.php/Main_Page—>
0;»>+
» {» +
» background-color:#ff6633;» +
» mso-number-format:0;» +
» }» +
«.sName» +
» {» +
» color:red;» +
» }» +
«.sValue» +
» {» +
» color:blue;» +
» mso-number-format:0;» +
» }» +
«</style>»;
static void Main(string[] args)
{
using (StreamWriter writer = new StreamWriter(@»C:1.xls», true, System.Text.Encoding.GetEncoding(«gb2312»
style=»color: #000000;»>), 512))
{
writer.WriteLine(HEADER);
writer.WriteLine(STYLE);
writer.WriteLine(«</head><body><table border=»1″ style=»font-size:9pt»><tr>»);
writer.WriteLine («<th>ID</th>»);
writer.WriteLine («<th>Name</th>»);
writer.WriteLine («<th>Value</th>»);
writer.WriteLine («<th>Percent</th>»);
for (int row = 1; row < 50; row++)
{
writer.WriteLine(«<tr>»);
writer.WriteLine(«<td class=»sId»>{0}</td», row);
writer.WriteLine(«<td class=»sName»>{0}</td», Guid.NewGuid ().ToString ());
writer.WriteLine(«<td class=»sValue»>{0}</td», new Random().Next());
writer.WriteLine(«<td class=»spercent»>{0}</td», new Random().NextDouble());
writer.WriteLine(«</tr>»);
}
writer.WriteLine(«</table></body>»);
}
}
}


