
Microsoft Word is one of the most popular word processing tools for creating reports and other documents. Whether you are a student, professional or anyone who does documentation works, proficiency in Microsoft Word is a skill that is necessary for today’s digital age. Microsoft Word software comes with a vast number of features to improve the productivity of your works and to produce accurate outputs. In this post, I will show you how to use some of these features to create professional reports with Microsoft Word.
When you write a Thesis, Dissertation, Project Report, and Technical Report, etc… Microsoft Word helps you to keep your content more organized, clear and structured. Microsoft Word comes with inbuilt options such as Source Manager for managing your citations, Track Changes, Document Outlines, etc… to make it easier to handle your documents and related resources.
If you closely observed any professional report created with Microsoft Word, you can identify there are several common features in every document. Those common features include Table of Contents, List of Tables, List of Figures, different levels of Heading Styles, Sections, Image and Table Captions, Index, Headers & Footers, Page Numbering, etc… Microsoft Word has specific ways of creating and generating those features. If you follow those methods correctly, you can create your report more easily and correctly.
In this series of tutorials, I will show you how to create Microsoft Word reports and make use of the inbuilt features correctly to make your report looks professional.
For better understanding, I have created a separate post for each key options that you will need to create reports and documents with Microsoft Word. I have listed out all the posts below, and it is not necessary to follow the same order. How ever, to use some options there are some prerequisites. I have added links to those prerequisites within the post itself.
First of all, let’s identify the main sections of a report.
Identify the main sections of a report
In a professional report, the appearance or look of the report as well as it’s flow is significant. So, you should first identify the main sections of the report. The sections given below are the most common in a professional report. (in this post I assume that you know the meaning of bellow terms)
- Cover Page
- Title Page
- Abstract
- Acknowledgement
- Table of Contents
- List of Figures
- List of Tables
- List of Acronyms
- Main Content/ Chapters
- References
- Appendixes
- Index
Creating these sections manually is not an easy task. However, if you practice the following Microsoft Word features, you can easily create the above sections.
The list of must-know features in Microsoft Word to create Professional Reports
Each feature below described in separate pages. You may click the post image or “read more” link to access these pages.
Insert Section Breaks

As the name suggests, section breaks used to break the document into separate sections. Sections allow you to handle its contents separately with the contents of other sections. Read More…
Create Numbered Multilevel Heading Styles

Numbered multilevel heading styles let you clearly distinguish the heading levels make the report easy to read & track. Correctly styled headings are used to generate… Read More…
Add Captions

It is a good practice to caption all the tables, images, maps, etc… added to your report. Caption helps you to refer to those objects precisely in your text. Read More…
Add Citations and Bibliography

Citation is “a word or piece of writing taken from a written work” [Cambridge Dictionary]. If you are obtaining information from another source, you must reference them. Read More…
Add Headers and Footers

Headers and footers are areas in the top or bottom of each page in a document. You can add title, page numbers, dates, or some graphics to every page in a document using headers and footers. Read More…
Add Page Numbers

Page numbers are generally added in the footer section of the document. Therefore the easiest way to add Page Numbers in Microsoft Word is to select a footer with page numbers when you are adding footers to the document. Read More…
Create a Table of Contents

Table of content help readers to easily navigate through your document. In this post, I will show you how easily you can create a table of contents in Microsoft Word. Read More…
Create List of Tables and Figures

When you add several tables and figures or any other objects in your report, it is a best practice to create a list of tables and figures or lists of other objects in the preface of the report. Read More…
Create an Index

An Index is a list of terms and topics that are discussed in a document. The terms and topics are listed along with the page numbers that they appear in the document. Read More…
Wrapping Up
The listed above are the essential features required to create professional reports with Microsoft Word. Here I have explained the basics of those features only. Once you get used to them, you can find more design and customization options inside those features. These features not only adding rich & professional looks to your documents, but they also help you to create and manage your report more easily and productively.
i financial report image by Christopher Hall from Fotolia.com
Writing a report in Microsoft Word can be done by using the available report templates. These templates have the complete report layout, so you can just add your content and adjust the template text. Once the adjustments are made, your report is personalized to your needs. Select the report template that fits your reporting style. Save the report when you are done so the report can be modified or retrieved at a later date.
Open Word 2010 and select the «File» tab. Select «New.» Select «Reports» from the left category task pane. Select one of the report sub-categories. For example, if you are doing an academic report, select this sub-category. Download the report template by clicking the «Download» icon in the right pane.
Highlight the default title text in the report and type your report name and details. Highlight additional default text and type your report information.
Change the report images by right clicking the image and selecting «Change Picture.» Search your computer for the image you want to use. Click the image and select the «Open» button. Your image replaces the default image.
Save your change by clicking the «Save» icon on the Quick Access Toolbar.
References
Writer Bio
Emmanuelle Douglas has been an avid writer since 1990. Her first professional writing assignment was for «Oscar News,» a local corporate Intranet website. She holds a Bachelor of Science in mathematical sciences from Clemson University.
Общая структура доклада
Доклад состоит из трёх частей: вступление, основная часть и заключение. Основная часть делится, в свою очередь, еще на несколько частей (как правило, 2–3). При этом и сам доклад, и все его части должны иметь заголовки. Также можно включить дату, расположив её под заголовком доклада. Например:
Subject: Changing Compliment Patterns in Disney Movies
Date: 18th January 2017
Purpose
(под этим заголовком располагается вступление)
Changes (вместо слова ‘changes’ нужно подставить свой заголовок)
(под этим заголовком располагается первая половина основной части)
Reasons (вместо слова ‘reasons’ нужно подставить свой заголовок)
(под этим заголовком располагается вторая половина основной части)
Conclusion
(под этим заголовком располагается заключение)
Примечания: вместо слова ‘purpose’ можно писать ‘introduction’. Вместо слова ‘conclusion’ можно писать ‘recommendation’, если вы пишете доклад-рекомендацию. На олимпиадах писать дату обычно не требуется. Можно переходить ко вступлению сразу после строки, на которой написана тема. Также не обязательно писать в теме слово Subject. Можно просто написать саму тему.
Вступление
Главная задача вступления в докладе — дать читателю понять, о чём будет доклад и с какой целью он написан. Если вы собираетесь описывать какие-нибудь меняющиеся показатели и объяснять причины изменений, то так и говорите во вступлении: «Цель доклада — обозначить изменения и объяснить их причины». Говорить нужно максимально по делу, без абстрактных рассуждений.
Разберем пример. Вам дали табличку, в которой представлены результаты некоего опроса о местном ресторане, и нужно написать по ней доклад. Неправильное вступление в формате report будет звучать так:
- Eating out is a very popular way of spending free time. Many people in our district often visit a local restaurant — the Ivy, which provides them with both food and pleasant atmosphere.
Это вступление является неподходящим, потому что мы уходим в абстрактные рассуждения (они годятся для эссе) и описания (они годятся для статей). Подходящее для формата report вступление будет звучать так:
- The aim of this report is to analyse the results of a survey in which 250 residents were questioned about the local Ivy restaurant. Basing on this analysis, the report provides recommendations on how to improve the service at the restaurant.
В этом вступлении мы сразу переходим к делу и явным образом указываем, о чем будет доклад.
Основная часть
В основной части вы выполняете изложенные в задании требования. Если нужно сравнить данные двух таблиц — сравниваете, если нужно объяснить причины изменений — объясняете, если нужно проанализировать диаграммы — анализируете. При этом необходимо не просто перечислять факты один за другим, а структурировать, группировать информацию. Структурирование и группирование делает информацию проще для восприятия и благотворно влияет на баллы как за содержательную, так и за организационную часть.
Информация без группирования и анализа (просто перечислили цифры из табличек с заданием, потеряли баллы за организацию и содержание):
- In 2000 60% of schoolchildren traveled for tourist purposes, 25% did that to attend summer language courses, and only 15% had higher education among their travelling goals. In 2014 about 28% became interested in higher education, 38% wanted to attend summer language courses and only 34% travelled for pleasure.
Группированная информация с анализом (не просто перечислили цифры, а подумали, как связаны между собой 2000 и 2014 год, что и обобщили в тексте):
- While in 2000 the principal reason for going abroad was tourism (at 60%), its role plummeted to only 34% in 2014. In contrast, educational purposes significance rose by approximately 10%, reaching 28% for higher education and 38% for summer language courses.
Заключение
Задача заключения — подвести итоги, суммировать всю изложенную информацию. В зависимости от того, какой у вас доклад, может также потребоваться выразить своё мнение или дать рекомендацию. Не пишите одно и то же шаблонное заключение к разным докладам — оно во многих случаях просто не выполнит своей функции. Как и в случае со вступлением, нужно писать по делу, не уходя в отвлеченные рассуждения.
Такое заключение не подойдет по формату (потому что содержит не относящиеся к делу общие рассуждения):
- To sum it all up, restaurants are an integral part of our life and the Ivy restaurant is not an exception. Although not everyone is satisfied with it, it still remains an attractive way to spend an evening with a friend.
А такое подойдет (потому что в нем все по делу):
- All points considered, some improvements evidently need to be made if clients are to be fully satisfied with the service provided by the restaurant.
Стиль
Доклад пишется в формальном стиле. Следует заменять простые структуры более сложными, использовать продвинутую лексику, страдательный залог, подходящие средства логической связи. Не должно быть разговорных выражений и сокращений.
- The service there is so cool! The waiters are very polite.
- The majority of those surveyed find the service at the restaurant excellent and note the politeness of the waiters.
Пример работы в формате report
Напишем ответ на такое задание:
Imagine that you are a linguist doing research into the dialogues in children’s animated films. You have collected some data on the ways female characters are complimented (see the charts below). Write a brief report describing the changes you have noticed comparing Disney movies over the years.
Write 220–250 words.
Use the following plan:
- make an opening statement;
- give some general information outlining the trend, analyze the information given in the charts;
- suggest possible reasons for the changes happening;
- make a conclusion.
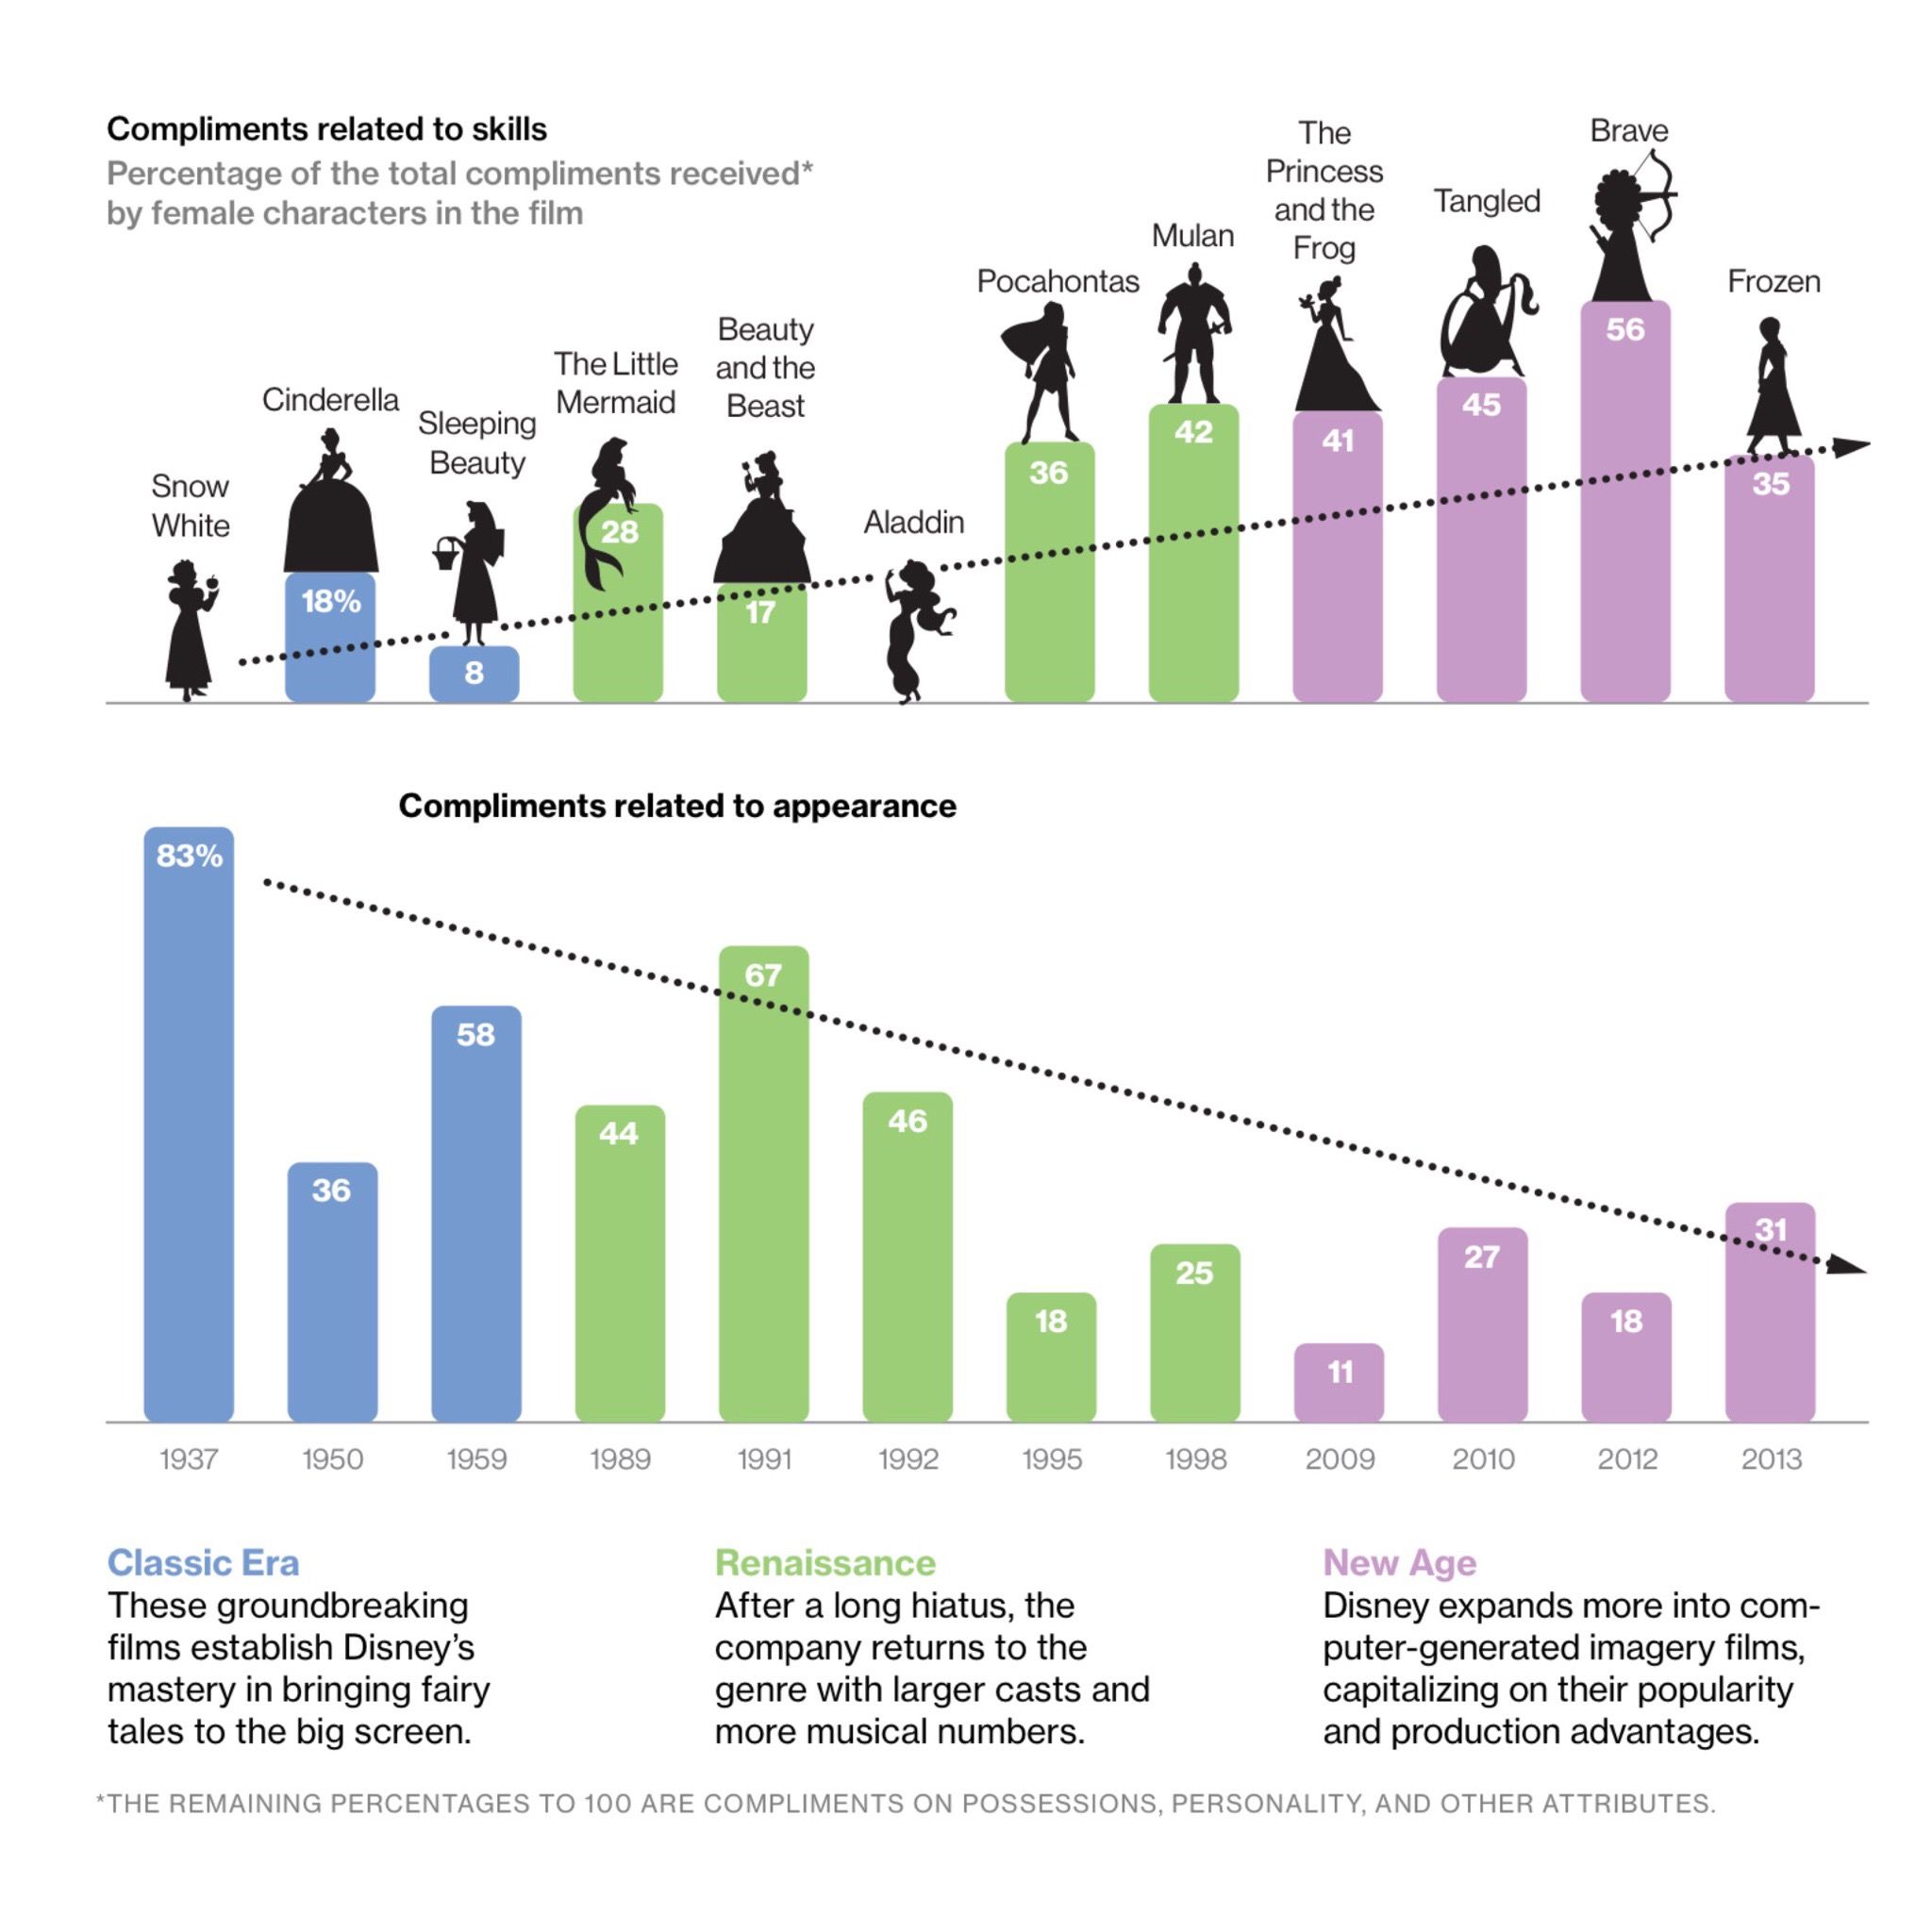
Первое, что необходимо сделать — внимательно рассмотреть графики. Как только мы это сделаем, так сразу поймём, что есть две четко прослеживающиеся тенденции: комплиментов о внешности становится всё меньше, комплиментов о навыках и умениях — всё больше.
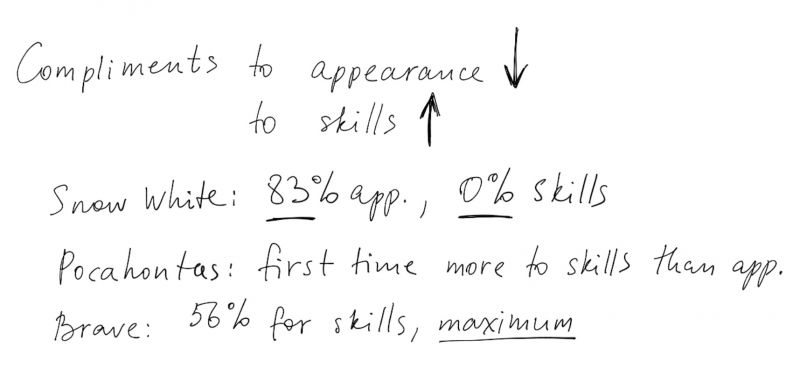
Уловив общее направление, найдем заметные, отличающиеся от остальных точки. Например, Snow White — ни одного комплимента, касающегося умений, зато 83% — о внешности. Pocahontas — первый женский персонаж в истории Диснея, у которого комплиментов о внешности меньше, чем комплиментов о талантах. Brave — максимальное количество комплиментов об умениях и навыках за всю историю. В общем, отмечаем для себя всё то, что сразу бросается в глаза. Причём отмечаем не в голове, а на бумаге:
Дальше мы видим, что временная шкала разделена на три периода: Classic Era, Renaissance, New Age. Эти периоды помогут в структурировании информации о комплиментах, так что берем их на заметку.
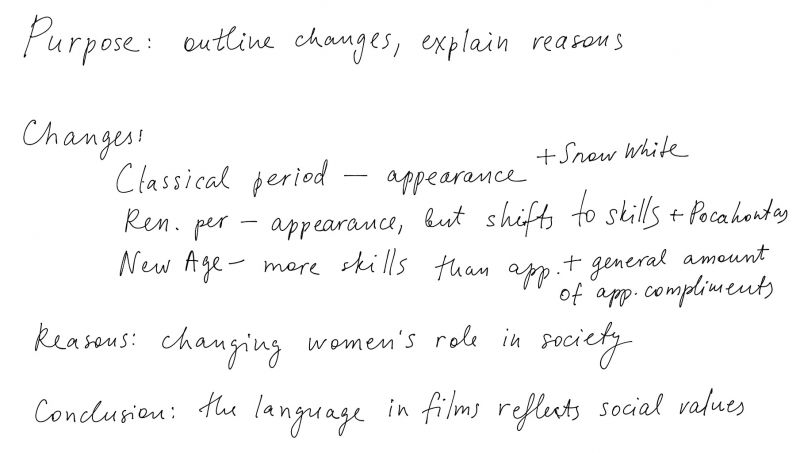
Проведя таким образом первичный анализ графиков, мы переходим к составлению плана (подробно о составлении плана можно почитать в статье «Как составить план?»). Для составления плана нам нужно понять, как группировать информацию. Разумеется, в отдельные абзацы выйдут вступление и заключение. Также отдельным абзацем будут причины изменений. Что касается описания самих изменений, тут единственно верного варианта нет, организовывать можно по-разному. Например, разбить описание на два абзаца: skills compliments, appearance compliments. Можно разбить на три, в соответствии с периодами: Classic Era, Renaissance, New Age. Можно вообще не разбивать.
Выбирая способ группировки, нужно помнить о лимите на количество слов. В данном задании мы ограничены 250 словами. Из них около 80 уйдёт на вступление с заключением. Останется примерно 170 слов на основную часть. Если мы выберем вариант описания по периодам, то абзацев в основной части будет четыре: три для периодов и один для описания причин изменений. То есть, в одном абзаце получится всего лишь около 40 слов. Писать такие короткие, но при этом логически безупречные и информативные абзацы весьма непросто. Поэтому целесообразнее будет не дробить на мелкие кусочки, а остановиться на более крупных частях.
Я выберу вариант разделения основной части всего на два абзаца: изменения и их причины. Плюс такого способа я вижу в том, что расположение всех изменений в одном абзаце даст мне возможность активно сравнивать их между собой.
Отражаем все наши мысли в базовом плане:
Когда базовый план готов, можно писать черновик, если на это хватает времени. Если времени мало, лучше детализировать план и, используя этот план, писать работу сразу начисто.
Напишем вступление. Во вступлении нужно обозначить цели и содержание доклада. Также нужно обозначить, откуда взялись данные, которые мы будем описывать.
The linguistic analysis of the dialogues from 12 Disney movies appearing over the period 1937–2013 has revealed certain alterations in the nature of the compliments paid to female characters. This report aims at outlining the discovered changes and explaining the reasons behind them.
Теперь напишем об изменениях. Для этого будем действовать по схеме обобщения и детализации. Как написано у нас в плане, в классических мультфильмах большинство комплиментов относится ко внешности. Примером служит Sleeping Beauty. Так и пишем:
In classic Disney animated films female characters receive several times the amount of praise for their appearance as for their skills and abilities. For instance, Snow White and Sleeping Beauty have respectively 83% and 58% compliments related to the way they look.
Проделываем аналогичную операцию со следующим периодом. Сначала обобщенно говорим о тенденции, потом даём пример:
The same trend generally remains during the renaissance Disney period, although it must be noted that it is then that a character appears (namely Pocahontas, 1995), who is given credit for her skills rather than attractiveness.
С последним периодом поступаем точно так же.
In most recent films the role of beauty-related compliments is noticeably lower — 20% on average, while showing respect for competence has risen in frequency, making up almost half of the total compliments in every film since 2009.
Обратите внимание, что хотя общая схема одинакова, при описании мы используем разные языковые структуры: several times the amount, respectively, the same trend remains, noticeably lower, on average, has risen in frequency. Чем они разнообразнее, тем выше будет оценена работа.
Также необходимо всеми силами избегать повторов. Например, чтобы не писать всё время ‘compliments on appearance’, мы используем синонимы: praise for their appearance, compliments related to the way they look, given credit, attractiveness, beauty-related compliments.
Следующий пункт — описание причин изменений. Это принципиально другой по своей сути текст. В отличие от предыдущего абзаца, он не просто передаёт объективные факты, взятые из графиков, а отражает личное мнение автора. Однако несмотря на это, он должен быть максимально обезличен в соответствии с особенностями формата report.
Differing compliment patterns might have been caused by the changing perception of women’s role in society. When a woman was primarily regarded as wife and mother, her value was mostly based on appearance. A shift towards engagement in activities other than household and motherhood was, in its turn, naturally followed by the increase in ability-related compliments.
Пассивные конструкции ‘might have been caused’, ‘was naturally followed’ позволяют добиться этого обезличивания.
Осталось написать заключение. Подведем итоги всему вышесказанному, кратко обозначив, что изменилось и почему.
To conclude, the quality of the compliments given to female characters in Disney movies has significantly altered, reflecting the ways the societal values have transformed over the past 76 years.
Наш report готов. Не забываем писать заголовки к каждому абзацу, а также к самому докладу.
Subject: Changing Compliments Patterns in Disney Movies
Purpose
The linguistic analysis of the dialogues from 12 Disney movies appearing over the period 1937–2013 has revealed certain alterations in the nature of the compliments paid to female characters. This report aims at outlining the discovered changes and explaining the reasons behind them.
Changes
In classic Disney animated films female characters receive several times the amount of praise for their appearance as for their skills and abilities. For instance, Snow White and Sleeping Beauty have respectively 83% and 58% compliments related to the way they look. The same trend generally remains during the renaissance Disney period, although it must be noted that it is then that a character appears (namely Pocahontas, 1995), who is given credit for her skills rather than attractiveness. In most recent films the role of beauty-related compliments is noticeably lower — 20% on average, while showing respect for competence has risen in frequency, making up almost half of the total compliments in every film since 2009.
Reasons
Differing compliment patterns might have been caused by the changing perception of women’s role in society. When a woman was primarily regarded as wife and mother, her value was mostly based on appearance. A shift towards engagement in activities other than household and motherhood was, in its turn, naturally followed by the increase in ability-related compliments.
Conclusion
To conclude, the quality of the compliments given to female characters in Disney movies has significantly altered, reflecting the ways the societal values have transformed over the past 76 years.
Подводные камни
Очень распространённая ошибка при написании доклада — несоответствие стиля. Использование личных местоимений (I think, I consider), сокращений (it’s, hasn’t), слишком простых предложений и разговорной лексики пагубно отражается на качестве доклада и на количестве получаемых за него баллов.
Do you need to make a professional annual report quickly? You can do it using a report design template Word doc.


A good template has an attractive annual report format already set. This makes your task of annual report creation easy.
Let’s look at how to make annual report designs quickly using a report design template Word doc. We’ll also take a look at some tips on how to make a good annual report design. So, let’s dig in and start designing.
How to Make Annual Report Designs
So, how do you make an annual report design? Well, you’ll need to decide which software you’d prefer to use. You’ll need to decide things like the best annual report format for your project too. Microsoft Word is one of many tools you can try. And there are plenty of annual report templates for Word.
New to Microsoft Word? Check out this free tutorial: Learn How to Use Microsoft Word (Beginner Tutorial Guide). It’s a great place to start!
Templates are a great solution because they give you a head start. You don’t have to begin with a blank canvas. An annual report template already has the basics established for you. Customize and edit it as much or as little as you want.


If you prefer to just insert your content in the annual report template, that’s fine. It’s a quick way to get your report done in a flash. Or, if you really want to change it up, use the template to jumpstart your design process. Turn it into something entirely new! The choice is yours.
Find the Perfect Annual Report Template Word Document
So, where do you find templates, especially if you want your annual report format in Word? Well, there’s a great collection of templates on Envato Elements. In fact, one low price gets you access to all of them, with unlimited downloads. That’s a great deal.


This means you can download as many annual report template Word documents as you like. Try out a few of them! They’re all included.
You also get a library of fonts, stock photos, illustrations, and more. Envato Elements comes with access to thousands of professional assets, all licensed for commercial use. It’s an awesome resource for creative professionals.
If you don’t necessarily need access to a library of files, consider GraphicRiver. Here, you can download only what you need. One download, one fee. It’s a great option for keeping things simple, but you still get the same level of professionalism.
How to Quickly Make Annual Reports in Microsoft Word Format With Templates
Now, let’s walk through how easy it to quickly create and customize an annual report in Microsoft Word using an annual report template. We’ll use this premium professional annual report template from Envato Elements:


You can download this tutorial and follow along if you like. Otherwise, these concepts are transferrable to any annual report template of your choice. We’ll hit the basic essentials to get you customizing your work right now.
Let’s begin!
1. Get Started With Your Document
You’ll need to navigate to your download. Your template may be compressed in a ZIP document. Uncompress this document and extract the files you need to your computer.
Depending on your template, you’ll be given a variety of different files.
Professional templates, like the one we’ll be using in this demonstration, usually have some sort of help guide or «readme» file. This will provide some insight as well as links to fonts that you’ll need for the document to display correctly. Install them before you open the files.
You may also have a variety of different file types. In our case we want to use the Word template. So, check out the template file in the DOCX format.


2. How to Navigate Through the Document
To open your document, go to File > Open. Navigate to the document on your computer and select it.
Navigating your document in Word is a simple process. Just scroll through the pages to see all the content within your document. The document we’re using has 20 pages worth of content with a large variety of different designs.


3. How to Duplicate and Manage Pages
To duplicate a page, you’ll need to create a new page. Make sure your cursor is placed at the top or bottom of a chosen page where you want to insert your new page. Then go to Insert > Blank Page.
Then copy the contents of another page and paste that into your new page to act as a template.
To delete an unwanted page, highlight the content of a page and click on the Delete button. Be careful with deleting page breaks.


4. How to Customize the Text
Customizing the text is also user friendly. As this is a Word document, in most cases, you can select the text with your cursor. Then edit as you would in most word processing software.
For our document you can change both the titles and paragraph text. Highlight the placeholder text and start typing your custom text. Your text will follow all the same formatting as the original text, including color font and size.


If your document includes a header, double click to access this content.
The great thing about adjusting header text is that the change appears on every page.
Our document even contains a page number that updates automatically. When you’re happy with your header, double click any area outside of your header to stop editing this part of your document.
You may come across some text that is inaccessible because it’s part of an image. Don’t worry. We’ll go over how to edit that too.
5. How to Change Colors
Changing colors of text is also a straight forward process. Highlight the text you want to change, then go to Home > Font Color. This is indicated by the icon with an A and a colored line under it. Once you click on the icon you get a palette of colors you can choose from.
You can also add your own colors to the palette by selecting More Colors.
It’s always a good idea to use a limited number of colors. Too many could be visually distracting.


6. How to Add Images
You may have noticed that there are some elements that you can’t easily edit. This may occur some templates. It’s usually because they’re images that have been imported. You can import your own images to replace them.
To remove an image, click to highlight and then press Delete.
To add an image, go to Insert > Picture. Then you can select Picture From File to select an image from your computer.
Once your image is inserted into the Word document you can place it anywhere you see fit. Remember to open up the Layout tab to control how your image appears. You can choose how text behaves and wraps around the image and even the order of how the images are layered.


7. How to Save Your Work
Once you’re happy with your report (or you’ve made some progress) you’ll likely want to save your work. You can do this by going to File > Save or File > Save As.
I suggest using Save As as this saves a new copy of the document. This way you keep a copy of the original template too.


From here, you can give your document a name. Place it in a folder where you can retrieve it later.
Annual Reports can be a big project, so I suggest saving many versions as you progress. You never know when you might need to revert to an older version.
8. How to Change Background Color


If you don’t like the background color of your annual report, you can easily change it.
Begin by clicking on the Design tab above the toolbar. Next, click on the Page Color button in the toolbar. When you click on this button, a color menu drops down.
9. How to Delete an Object


Sometimes you don’t like an object that is part of the design or in the way. To get rid of an object on your annual report template, select the object that you want to get rid of. Then, press Delete on your keyboard.
10. How to Change Object Color


If you want a new color scheme on your annual report Word template, change the color of the objects in your annual report Word template to match the color scheme.
Begin by selecting the object that you want to change the color of. When the object is selected, a Shape Format tab appears. Click on that tab.
Next, click on the Format Pane button in the toolbar. Clicking on this button opens a side panel in your window. Click on the Fill & Line tab on the Format Shape side panel.
In the Fill section of the panel, click on the Solid Fill option. When you click on this option, a Color field appears. Click on the button in that field. A color menu drops down. Choose the colors you want from the menu.
11. How to Add a New Text Box


To add more text to your annual report template you need to add a new text box. Click on the Insert tab. Next, click on the Text Box button in the toolbar. When you click on this button, a menu drops down.
Choose the right option for you from the drop-down menu. Next, click where you want the new text box to be and draw a diagonal line. Click inside the box and start typing your new text.
12. How to Save a File as a PDF


To email your annual report template, you’ll need to save it as a PDF file.
To save your annual report file as a PDF file, click File at the top of your screen. When you do, a menu drops down. Choose the Save As option. A window opens in the File Format field. Click on the PDF option to save your annual report as a PDF file.
Five Best Envato Elements Annual Report Design Template Word Documents
Take a look at some of the annual reports you can download right now on Envato Elements. Remember, they’re all included for one price, and you can customize them in Microsoft Word:
1. MS Word Report and Proposal (Annual Report Format in Word)


This stylish, multipage design has plenty of potential. Just open it up on Microsoft Word and add your content. Or customize the design to best suit your business needs.
2. Annual Report Template Word Design Document


If you’re looking for even more options, try out this design. It comes in two different sizes with plenty of different layouts to customize. Add your content to this template today.
3. Annual Report Design Template Word


Here’s another elegant design you could download today. It’s got 28 pages to choose from and includes a variety of file formats for your convenience.
4. Annual Report Word Design


Isn’t this design stylish? Download it today and easily edit the pages in Microsoft Word. This is just a sample of the 24 included pages. Change up the designs, color, and more.
5. Annual Corporate Report Template


Here’s another template with a lot of options. Customize the included 12 pages, duplicate them, and add your content. Includes a variety of file formats for your convenience and uses free fonts.
5 Quick Tips How to Make a Good Annual Report
We’ve just explored some ways how to make annual report designs quickly and easily with templates. But you might still wonder about how to make a good annual report work for you. What should it have? What do you need?
Check out these quick tips to help you create the perfect annual report:
1. Don’t Overwhelm the Reader
It can be tempting to put a lot of content on each page. But it’s wise to practice restraint. Too much content can be both overwhelming to read and overwhelming to look at. If you find yourself with a full page, consider breaking it up.
Empty space is just as important as your content. Think of it like breathing room for the eyes. This extra space can also help push the aesthetic of your design. Well balanced content that has both occupied and empty spaces can help make your work look more professional.


2. Make Sure All Text Is Clear and Legible
It’s essential that your text content is easy to read. For example, avoid the following pitfalls in your annual report format in Word:
- Don’t make your text too small. Even if it looks good, if it doesn’t read easily you’ve missed the point.
- Be careful about contrast. The text shouldn’t blend into the background. For example, light gray text on a white background is harder to read, especially at small sizes.
- Choose simple, clean fonts for paragraphs and body copy. You don’t want a busy, decorative fonts for long text. It can be very difficult to read.
If you aren’t sure, ask a friend or colleague to give your text a test read. Also remember, some may have more difficulty reading smaller sizes than others. Font legibility will also greatly vary depending on the font.
3. Keep Your Design Consistent
Your annual report format should exhibit consistency from page to page. Think about it: this is one, continuous presentation. It should look that way as you browse through it. If the design is jarringly different from page to page, it’ll feel really disjointed.
You can establish consistency in many different ways. For example, you could have a repeating header. You could have key colors that you keep consistent throughout.
The example below is a collection of some annual report format pages in Word. Notice how, while they vary, they share key elements in common.


4. But Don’t Let Things Get Boring Either
The same page layout, over and over again, would be visually boring. In fact, it might even be easier to get lost in the presentation. So, while consistency is good, it’s just like variety: you need to find a balance.


Above is an example annual report format in Word. Again, note how each page has some common elements:
- They use the same fonts.
- They share the same color scheme.
- But the layouts themselves mix things up.
You can also use different images. These pages basically have a theme, but they aren’t clones of each other. This keeps them looking related without being repetitive.
5. Consider Your File Formats
So, what annual report format is right for your project? Sharing your work as a Word document might not be the most effective way to do so. This would mean the viewer would have to have Microsoft Word installed. Also, you might put yourself in a position where your work is easily editable. This isn’t necessarily bad, but it might not be what you want.
Here are some questions to think about:
- Will you print your annual report?
- Will you offer it online?
Microsoft Word exports as PDF, so this can be a great option to explore.
Learn More About How to Make Annual Report Designs
There’s plenty more to learn about annual report design and Microsoft Word. Check out these free tutorials from Envato Tuts+. There are a great way to get start, keep learning, and do it all for free.
Check Out More Annual Report Templates
Looking for even more annual report design templates? Here are some inspiring collections to view today. There’s plenty of design inspiration and even more downloads you can check out.
Customize Your Annual Report Template in Word Today
Microsoft Word can be a great choice for your annual report format. Using a template can really help speed up the process too. There’s no better time to dig in and start designing, so why not begin your annual report design today?
Remember, if you’re looking for templates, you can find the perfect annual report format in Word over on Envato Elements. There’s so many files to choose from, and one fee gets you access to all of them. With unlimited downloads, you can grab as many as you’d like to try.
Or, if you prefer single downloads, remember to check out the annual report templates on GraphicRiver. There’s plenty more design inspiration over there to see too.
Good luck with your annual report, and happy designing!
Update: This post has been updated with help for Sarah Joy.
The ability to produce a professional report design is not a dark art. By adopting some simple guidelines, you can create documents that your audience will be able to read and understand more easily.
The report designs we create for our clients are based on the science of how our brain and eyes work when they engage with information – these guidelines use that same science.
It’s all about
cognitive fluency; the ease with which we process information in the form of words
or graphics so that we understand their meaning. It’s our job to make that
process as short and simple as possible.
We’re sharing six
creative guidelines that we use to do this within our work, and that could help
give professional finesse to your own report design.
01. Add a page header
Including a page header in your report design is a simple but effective feature. Many reports are now viewed digitally, and navigation bars can help your readers to move around your content more easily. They also give structure to the page and the document as a whole, framing the content and providing a consistent reference point for readers. Use colour or a bold font to help readers see where they are in the report.

02. Use columns for body copy
The
column structure in which the words of the report are set is a key design
feature of any written document and the width of a column affects readability.
We
don’t read character by character or even word by word but instead we scan and
then pause to pick up groups of three or four words. As three or four pauses happen
before it gets tiring, we can work out that a column width should be between
9-12 words. That’s the principle.
Using
two or three columns for your text can completely reinvent the look of your
report. Try using one column for pull-out quotes, key points or imagery. It’s
worth noting that white space is not wasteful, but more of that later.


03. Experiment with fonts
Before you start, think about the style of font (or
typeface) you would like to use. Bear in mind that your choice will have an impact
on how your report is perceived by readers as well as the more pragmatic design
consideration of how easy it is for them to read it.
Try and break out of the default standard fonts, Times New
Roman and Arial for example. There are plenty of good, standard fonts to choose
from, whether you’re using Mac or Windows. Google fonts also has plenty of free
commercial typefaces to download and use.
Fonts that have a range of weights (light, regular, medium,
bold, italicised) are especially useful as you can add more sophistication to
your report design. Light weights are effective for body copy and medium and
bold for headings.

Add colour for important information such as headings
and call-outs. Try a dark grey for body copy — it’s less stark than black and can make a report feel
warmer and more appealing. Don’t go too far and too bright with the colours — readers will be put off as they reach for sunglasses and
headache tablets.
04. Reduce the font size
In general, 10pt or 11pt is the widely used default size
but in professional report design we most often use 9pt, sometimes dropping to 8pt.
Often, text in 8pt or 9pt with deeper line spacing (known as leading) can be
easier and faster to read because our eye can more easily see where the next
word or line starts.
Consider if it’s likely that the report you’re working on may be read by those, old or young, who are partially sighted. Guidance about point size can be found on the websites of the RNIB, the charity for blind and partially sighted people or the UK Association for Accessible Formats.

05. Use white space
White space does not have to be white — the term simply refers to the space around written
content, and it is certainly not wasted space.
Using white space enables you to draw your readers eye
to a particular point or paragraph that you want to highlight and then gives
your readers the room so that they can focus on the key section; understanding
rises accordingly.
White space also allows the eyes and brain to rest at
points, to stay interested as layouts differ from page to page, and prevents
the brain from tiring as quickly as it might when presented with a full page of
information to process.

06. Think
about alignment
Alignment
of words is simply the way in which you arrange the lines on the page. The most
common are justified and ranged left. The former is where the column of words
is aligned on both the right and left of a column; the latter is where the text
is aligned just on the left.
When text is justified,
each
line is the same length, so the spacing between words varies from line to line.
Justified text can look neater in smaller point sizes and wide columns, but is
harder to read as the start and of end each line is more difficult to find.
When text is ranged
left, the spacing between words is the same throughout the document,
and the staggered line lengths actually make it easier to read as our brains
more easily identify where a line starts and ends.
Our advice is to
use left-ranged text with a two or three column layout.
The way a report
is designed can say a huge amount about the value you place on your content.
Client and, more importantly, potential client perceptions will be informed by
the design of printed or online reports you produce as well as by the way they
read.
If you’d like to chat to us about how we could help you create a professional report design, call us on 01606 276176 or email us workwithus@nwc.design.