
Solver is a Microsoft Excel add-in program you can use for what-if analysis. Use Solver to find an optimal (maximum or minimum) value for a formula in one cell — called the objective cell — subject to constraints, or limits, on the values of other formula cells on a worksheet. Solver works with a group of cells, called decision variables or simply variable cells that are used in computing the formulas in the objective and constraint cells. Solver adjusts the values in the decision variable cells to satisfy the limits on constraint cells and produce the result you want for the objective cell.
Put simply, you can use Solver to determine the maximum or minimum value of one cell by changing other cells. For example, you can change the amount of your projected advertising budget and see the effect on your projected profit amount.
Note: Versions of Solver prior to Excel 2007 referred to the objective cell as the «target cell,» and the decision variable cells as «changing cells» or «adjustable cells». Many improvements were made to the Solver add-in for Excel 2010, so if you’re using Excel 2007 your experience will be slightly different.
In the following example, the level of advertising in each quarter affects the number of units sold, indirectly determining the amount of sales revenue, the associated expenses, and the profit. Solver can change the quarterly budgets for advertising (decision variable cells B5:C5), up to a total budget constraint of $20,000 (cell F5), until the total profit (objective cell F7) reaches the maximum possible amount. The values in the variable cells are used to calculate the profit for each quarter, so they are related to the formula objective cell F7, =SUM (Q1 Profit:Q2 Profit).
1. Variable cells
2. Constrained cell
3. Objective cell
After Solver runs, the new values are as follows.
-
On the Data tab, in the Analysis group, click Solver.

Note: If the Solver command or the Analysis group is not available, you need to activate the Solver add-in. See: How to activate the Solver add-in.
-
In the Set Objective box, enter a cell reference or name for the objective cell. The objective cell must contain a formula.
-
Do one of the following:
-
If you want the value of the objective cell to be as large as possible, click Max.
-
If you want the value of the objective cell to be as small as possible, click Min.
-
If you want the objective cell to be a certain value, click Value of, and then type the value in the box.
-
In the By Changing Variable Cells box, enter a name or reference for each decision variable cell range. Separate the non-adjacent references with commas. The variable cells must be related directly or indirectly to the objective cell. You can specify up to 200 variable cells.
-
-
In the Subject to the Constraints box, enter any constraints that you want to apply by doing the following:
-
In the Solver Parameters dialog box, click Add.
-
In the Cell Reference box, enter the cell reference or name of the cell range for which you want to constrain the value.
-
Click the relationship ( <=, =, >=, int, bin, or dif ) that you want between the referenced cell and the constraint.If you click int, integer appears in the Constraint box. If you click bin, binary appears in the Constraint box. If you click dif, alldifferent appears in the Constraint box.
-
If you choose <=, =, or >= for the relationship in the Constraint box, type a number, a cell reference or name, or a formula.
-
Do one of the following:
-
To accept the constraint and add another, click Add.
-
To accept the constraint and return to the Solver Parameters dialog box, click OK.
Note You can apply the int, bin, and dif relationships only in constraints on decision variable cells.You can change or delete an existing constraint by doing the following:
-
-
In the Solver Parameters dialog box, click the constraint that you want to change or delete.
-
Click Change and then make your changes, or click Delete.
-
-
Click Solve and do one of the following:
-
To keep the solution values on the worksheet, in the Solver Results dialog box, click Keep Solver Solution.
-
To restore the original values before you clicked Solve, click Restore Original Values.
-
You can interrupt the solution process by pressing Esc. Excel recalculates the worksheet with the last values that are found for the decision variable cells.
-
To create a report that is based on your solution after Solver finds a solution, you can click a report type in the Reports box and then click OK. The report is created on a new worksheet in your workbook. If Solver doesn’t find a solution, only certain reports or no reports are available.
-
To save your decision variable cell values as a scenario that you can display later, click Save Scenario in the Solver Results dialog box, and then type a name for the scenario in the Scenario Name box.
-


-
After you define a problem, click Options in the Solver Parameters dialog box.
-
In the Options dialog box, select the Show Iteration Results check box to see the values of each trial solution, and then click OK.
-
In the Solver Parameters dialog box, click Solve.
-
In the Show Trial Solution dialog box, do one of the following:
-
To stop the solution process and display the Solver Results dialog box, click Stop.
-
To continue the solution process and display the next trial solution, click Continue.
-
-
In the Solver Parameters dialog box, click Options.
-
Choose or enter values for any of the options on the All Methods, GRG Nonlinear, and Evolutionary tabs in the dialog box.
-
In the Solver Parameters dialog box, click Load/Save.
-
Enter a cell range for the model area, and click either Save or Load.
When you save a model, enter the reference for the first cell of a vertical range of empty cells in which you want to place the problem model. When you load a model, enter the reference for the entire range of cells that contains the problem model.
Tip: You can save the last selections in the Solver Parameters dialog box with a worksheet by saving the workbook. Each worksheet in a workbook may have its own Solver selections, and all of them are saved. You can also define more than one problem for a worksheet by clicking Load/Save to save problems individually.
You can choose any of the following three algorithms or solving methods in the Solver Parameters dialog box:
-
Generalized Reduced Gradient (GRG) Nonlinear Use for problems that are smooth nonlinear.
-
LP Simplex Use for problems that are linear.
-
Evolutionary Use for problems that are non-smooth.
Important: You should enable the Solver add-in first. For more information, see Load the Solver add-in.
In the following example, the level of advertising in each quarter affects the number of units sold, indirectly determining the amount of sales revenue, the associated expenses, and the profit. Solver can change the quarterly budgets for advertising (decision variable cells B5:C5), up to a total budget constraint of $20,000 (cell D5), until the total profit (objective cell D7) reaches the maximum possible amount. The values in the variable cells are used to calculate the profit for each quarter, so they are related to the formula objective cell D7, =SUM(Q1 Profit:Q2 Profit).
 Variable cells
 Constrained cell
 Objective cell
After Solver runs, the new values are as follows.
-
In Excel 2016 for Mac: Click Data > Solver.
In Excel for Mac 2011: Click the Data tab, under Analysis, click Solver.
-
In Set Objective, enter a cell reference or name for the objective cell.
Note: The objective cell must contain a formula.
-
Do one of the following:
To
Do this
Make the value of the objective cell as large as possible
Click Max.
Make the value of the objective cell as small as possible
Click Min.
Set the objective cell to a certain value
Click Value Of, and then type the value in the box.
-
In the By Changing Variable Cells box, enter a name or reference for each decision variable cell range. Separate the nonadjacent references with commas.
The variable cells must be related directly or indirectly to the objective cell. You can specify up to 200 variable cells.
-
In the Subject to the Constraints box, add any constraints that you want to apply.
To add a constraint, follow these steps:
-
In the Solver Parameters dialog box, click Add.
-
In the Cell Reference box, enter the cell reference or name of the cell range for which you want to constrain the value.
-
On the <= relationship pop-up menu, select the relationship that you want between the referenced cell and the constraint.If you choose <=, =, or >=, in the Constraint box, type a number, a cell reference or name, or a formula.
Note: You can only apply the int, bin, and dif relationships in constraints on decision variable cells.
-
Do one of the following:
To
Do this
Accept the constraint and add another
Click Add.
Accept the constraint and return to the Solver Parameters dialog box
Click OK.
-
-
Click Solve, and then do one of the following:
To
Do this
Keep the solution values on the sheet
Click Keep Solver Solution in the Solver Results dialog box.
Restore the original data
Click Restore Original Values.
Notes:
-
To interrupt the solution process, press ESC . Excel recalculates the sheet with the last values that are found for the adjustable cells.
-
To create a report that is based on your solution after Solver finds a solution, you can click a report type in the Reports box and then click OK. The report is created on a new sheet in your workbook. If Solver doesn’t find a solution, the option to create a report is unavailable.
-
To save your adjusting cell values as a scenario that you can display later, click Save Scenario in the Solver Results dialog box, and then type a name for the scenario in the Scenario Name box.
-
In Excel 2016 for Mac: Click Data > Solver.
In Excel for Mac 2011: Click the Data tab, under Analysis, click Solver.
-
After you define a problem, in the Solver Parameters dialog box, click Options.
-
Select the Show Iteration Results check box to see the values of each trial solution, and then click OK.
-
In the Solver Parameters dialog box, click Solve.
-
In the Show Trial Solution dialog box, do one of the following:
To
Do this
Stop the solution process and display the Solver Results dialog box
Click Stop.
Continue the solution process and display the next trial solution
Click Continue.
-
In Excel 2016 for Mac: Click Data > Solver.
In Excel for Mac 2011: Click the Data tab, under Analysis, click Solver.
-
Click Options, and then in the Options or Solver Options dialog box, choose one or more of the following options:
To
Do this
Set solution time and iterations
On the All Methods tab, under Solving Limits, in the Max Time (Seconds) box, type the number of seconds that you want to allow for the solution time. Then, in the Iterations box, type the maximum number of iterations that you want to allow.
Note: If the solution process reaches the maximum time or number of iterations before Solver finds a solution, Solver displays the Show Trial Solution dialog box.
Set the degree of precision
On the All Methods tab, in the Constraint Precision box, type the degree of precision that you want. The smaller the number, the higher the precision.
Set the degree of convergence
On the GRG Nonlinear or Evolutionary tab, in the Convergence box, type the amount of relative change that you want to allow in the last five iterations before Solver stops with a solution. The smaller the number, the less relative change is allowed.
-
Click OK.
-
In the Solver Parameters dialog box, click Solve or Close.
-
In Excel 2016 for Mac: Click Data > Solver.
In Excel for Mac 2011: Click the Data tab, under Analysis, click Solver.
-
Click Load/Save, enter a cell range for the model area, and then click either Save or Load.
When you save a model, enter the reference for the first cell of a vertical range of empty cells in which you want to place the problem model. When you load a model, enter the reference for the entire range of cells that contains the problem model.
Tip: You can save the last selections in the Solver Parameters dialog box with a sheet by saving the workbook. Each sheet in a workbook may have its own Solver selections, and all of them are saved. You can also define more than one problem for a sheet by clicking Load/Save to save problems individually.
-
In Excel 2016 for Mac: Click Data > Solver.
In Excel for Mac 2011: Click the Data tab, under Analysis, click Solver.
-
On the Select a Solving Method pop-up menu, select one of the following:
|
Solving Method |
Description |
|---|---|
|
GRG (Generalized Reduced Gradient) Nonlinear |
The default choice, for models using most Excel functions other than IF, CHOOSE, LOOKUP and other “step” functions. |
|
Simplex LP |
Use this method for linear programming problems. Your model should use SUM, SUMPRODUCT, + — and * in formulas that depend on the variable cells. |
|
Evolutionary |
This method, based on genetic algorithms, is best when your model uses IF, CHOOSE, or LOOKUP with arguments that depend on the variable cells. |
Note: Portions of the Solver program code are copyright 1990-2010 by Frontline Systems, Inc. Portions are copyright 1989 by Optimal Methods, Inc.
Because add-in programs aren’t supported in Excel for the web, you won’t be able to use the Solver add-in to run what-if analysis on your data to help you find optimal solutions.
If you have the Excel desktop application, you can use the Open in Excel button to open your workbook to use the Solver add-in.
More help on using Solver
For more detailed help on Solver contact:
Frontline Systems, Inc.
P.O. Box 4288
Incline Village, NV 89450-4288
(775) 831-0300
Web site: http://www.solver.com
E-mail: info@solver.com
Solver Help at www.solver.com.
Portions of the Solver program code are copyright 1990-2009 by Frontline Systems, Inc. Portions are copyright 1989 by Optimal Methods, Inc.
Need more help?
You can always ask an expert in the Excel Tech Community or get support in the Answers community.
See Also
Using Solver for capital budgeting
Using Solver to determine the optimal product mix
Introduction to what-if analysis
Overview of formulas in Excel
How to avoid broken formulas
Detect errors in formulas
Keyboard shortcuts in Excel
Excel functions (alphabetical)
Excel functions (by category)
Full Guide to Solver in Excel: How to Use + Install (2023)
We make many assumptions when creating financial models in Microsoft Excel.
These assumptions also have limitations 🚧
If you want to find optimal solutions from a model, you must change these assumptions.
It will take hours to get the answer if you try to change these assumptions manually ⏳
That’s where the Excel Solver feature comes in handy!
In this lesson, I will explain this complex Excel feature in a very easy manner.
You can download the workbook and follow along with me.
What is the Solver add-in?
The Solver add-in is an Excel optimization tool.
You can use the Excel solver to perform a what-if analysis with multiple variables in your model.
It will find an optimal solution for a formula by changing the related variables.
We can add constraints on how much one variable can vary when we change the others.
The solver is useful for Linear programming problems in business, programming, and engineering.
Because of this, Solver is also known as a “Linear Programming Solver.”
However, you can solve both non-smooth or continuous functions as well as smooth non-linear issues with the Excel Solver.
How to add the Solver add-in
The Solver add-in, like the Analysis ToolPak of Excel, is a Microsoft Excel add-in program.
As a result, it is not immediately available in Excel by default.
We must install it 🤔
Let’s look at how to add the Solver add-in to our Excel workbook.
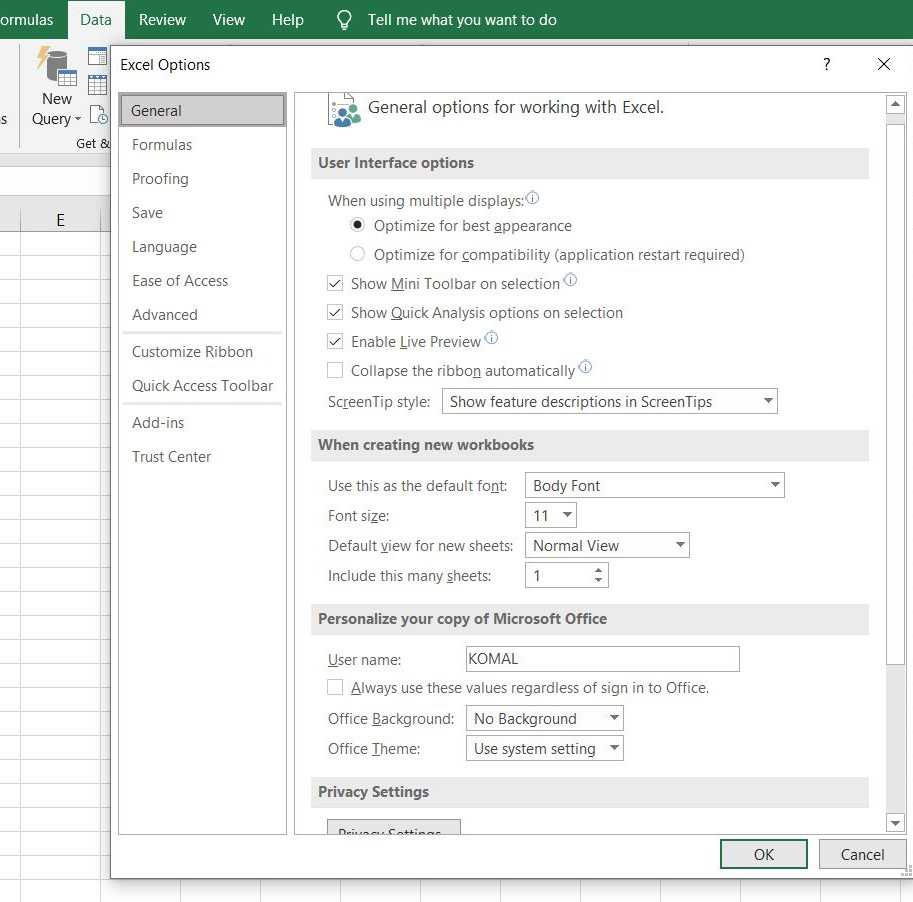
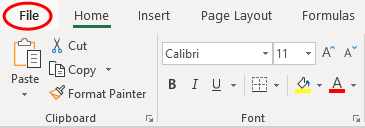
- Go to the file tab in your Excel file.

- Select options at the bottom of the left-hand sidebar.

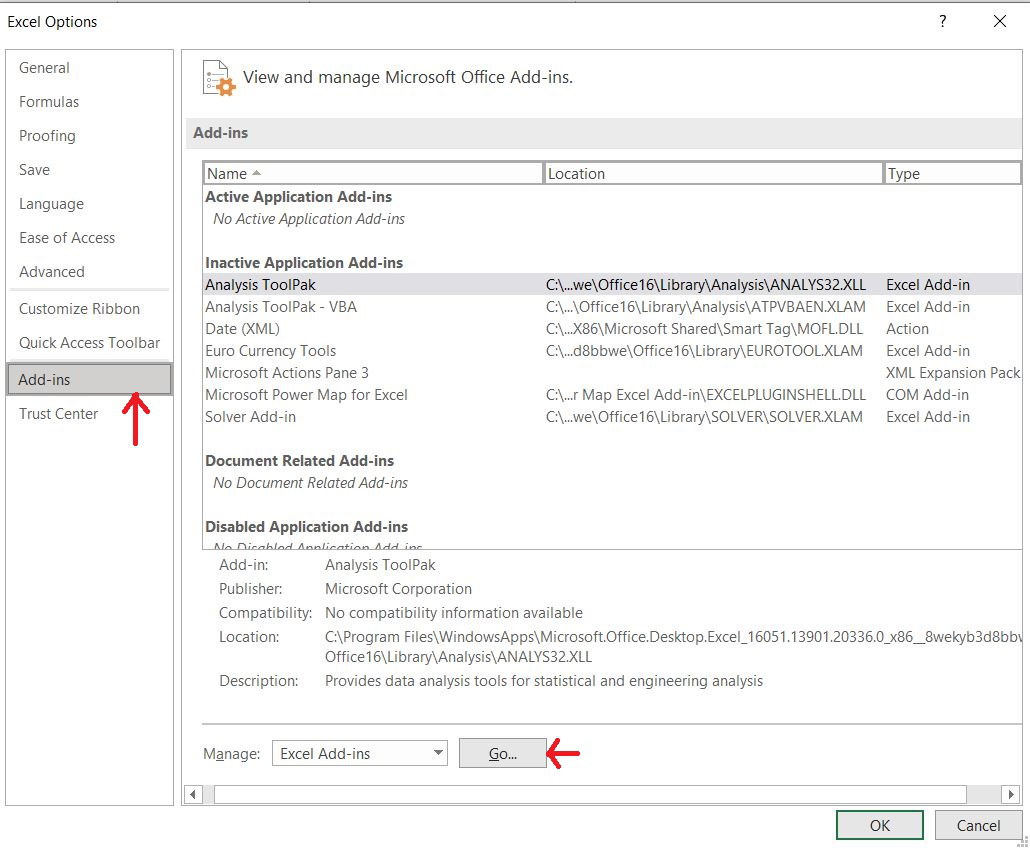
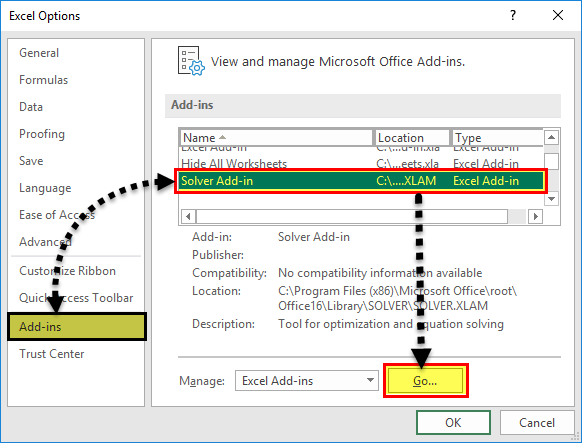
- Select Add-ins from the Excel options window.

- Then in the Manage box, select excel add-ins and click “Go…”.

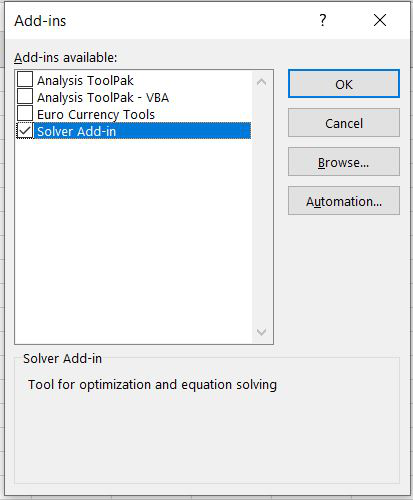
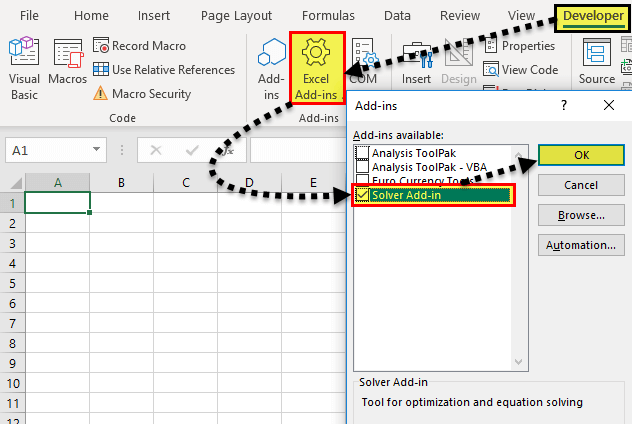
- Select the Solver Add-in check box from the Add-ins available box. Then, click OK.

Now the Excel Solver Add-ins are loaded to Microsoft excel 👌
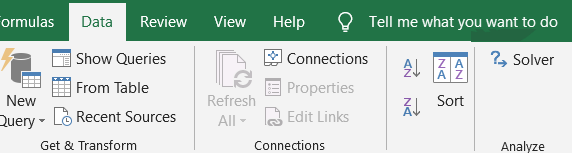
Now, go to the Data tab.

You can see the Excel solver command in the analysis group of the Data tab.
You can click Solver to open the Solver parameters dialog box.

How to use Solver in Excel
It is important to learn different parts of the Solver parameter dialog box before we use it 🧑🏻🎓
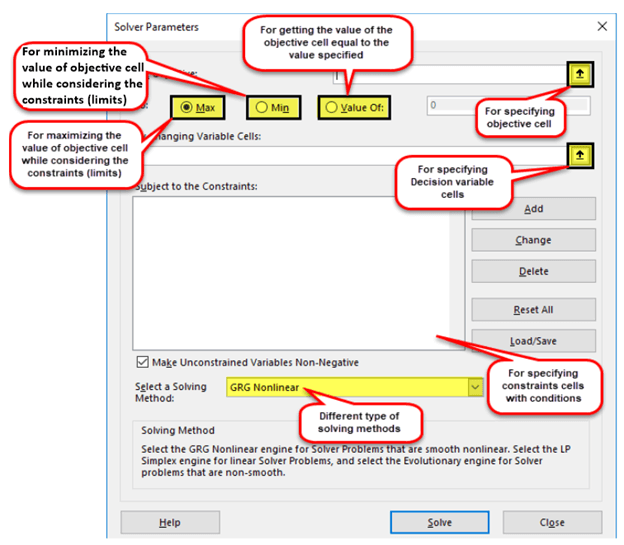
Set Objective
The set objective is the first input for the Excel Solver parameter dialog box.
In the set objective box, we have to select the cell reference for the objective cell.
The objective cell must have a formula.
Then you can set the objective cell to one of the following.
- Max
- Min
- Value of – If you select “Value of”, you must specify the target value in the box.

By changing variable cells
In this “by changing variable cells”, you have to select all the variable cells to get the optimal solution.
The variable cells are directly or indirectly related to the target cell.
Currently, you can include up to 200 variable cells for the Excel solver function.
If the variable cells are non-adjacent cells, you have to separate them with commas.

Subject to the constraints
Excel Solver can find the optimal solution within constraints or limits.
We can add constraints in this constraint box.

To add constraints, click add button.
Then “Add constraint” box will pop up.
You can select the variable cell for the cell reference box and add the limit in the constraint box.
You must specify the relationship between the cell reference box and the constraint box also.

Do you want to delete or change an existing constraint? 👇🏻
Select that constraint from the Excel Solver parameters dialog box.
Then click the change button to change the existing constraint.
Or click the delete button to delete that.
Select a solving method
In Excel solver, we can select one of the solving methods from the following 3.
- GRG non-linear – For solver problems that are smooth nonlinear.
- Simplex LP – For linear programming problems.
- Evolutionary – For solver problems that are non-smooth.

Now you are familiar with the Excel solver add-in options window 💪🏻
Let’s use Excel Solver to find a solution for a linear programming model.
Linear programming with Solver add-in
In the below example, we have to find how many units we have to sell in order to get the desired outcome of profit.

Let’s learn step by step how to use the Excel Solver solution to our linear programming problem.
- Go to the data tab and click solver to open the Excel Solver.
- Select the objective cell reference.
Our goal is to set the total profit in cell B7 to $900.
So, B7 is the objective cell.
As we need to match the value of the objective cell to $900, we have to select the option of “Value of”.
Then type 900, next to the “value of” option.

- Select the variable cells.
The variable for the target value is the quantity for each cell.
So, in this case, the variable cells are B2, C2, and D2.

- Click the “Add” tab to add constraints for each variable.
Choose each product’s quantity cell as a cell reference.
Then choose the referenced cell’s maximum amount as the constraint.
Next, choose the link between the referred cell.
Here we select “less than or equal sign” because the constraint is maximum quantity.
Again, we need the quantities as whole numbers.
So, we set another constraint for each variable cell as an Integer.


After entering all constraints, the solver displays all constraints for the particular solution.

- Select the “Simplex LP” as we are solving a linear solver problem and click the “Solve” button at the bottom of the window.

- Then, you can see the Solver results dialog box with options to “keep solver solution” and to “restore original values”.
Select the “keep solver solution” and click “OK”.

To get a total profit of $900, we have to sell 149 in vanilla flavour, 114 in chocolate flavour, and 75 in banana flavour.

That’s it – Now what?
Now you have learned Excel Solver a hidden gem of an Excel 💎
You can use this to solve many problems in financial models.
But, before you use Excel Solver for your model, you must make sure all your functions such as IF, SUMIF, and VLOOKUP are correctly applied in the model.
Otherwise, the Solver will take hours to get the solution and may give incorrect results.
Click here to access my free 30-minute online course where you can learn about IF, SUMIF, and VLOOKUP if you haven’t already.
Frequently asked questions
When you need to change only one input to get the desired outcome of a formula, you can easily use Excel’s inbuilt feature Goal Seek.
We have to specify the formula cell, the target value for the formula cell, and the cell to change in order to get the target value.
Only 200 decision variables are currently supported by Excel solver.
This restriction applies to both linear and nonlinear models.
Another problem is that we cannot ensure that we will obtain the solver model’s optimal solution if it is not linear.
Kasper Langmann2023-01-10T18:48:32+00:00
Page load link
![]()
Download Article
![]()
Download Article
- Enabling Solver
- Analyzing and Solving
- Video
- Tips
- Warnings
|
|
|
|
This wikiHow teaches you how to use Microsoft Excel’s Solver tool, which allows you to alter different variables in a spreadsheet in order to achieve a desired solution. You can use Solver in both Windows and Mac versions of Excel, though you’ll have to enable Solver before you can begin using it.
-
1
Open Excel. Click or double-click the Excel app icon, which resembles a green box with a white «X» on it.
- Solver comes pre-installed with both Windows and Mac versions of Excel, but you’ll have to enable it manually.
-
2
Click Blank workbook. This will open the Excel window, from which point you can proceed with enabling Solver.
- If you have an existing Excel file you’d like to use Solver with, you can open it instead of creating a new file.
Advertisement
-
3
Click File. It’s a tab in the upper-left side of the Excel window.
- On a Mac, click Tools instead, then skip the next step.
-
4
Click Options. You’ll find this option at the bottom of the File menu. Doing so brings up the Options window.[1]
-
5
Click Add-ins. It’s a tab in the lower-left side of the Options window.
- On a Mac, click Excel Add-ins in the Tools menu.
-
6
Open the «Add-ins Available» window. Make sure that the «Manage» text box has «Excel Add-ins» listed in it, then click Go at the bottom of the page.
- On a Mac, this window will open after clicking Excel Add-ins in the Tools menu.
-
7
Install the Solver add-in. Check the «Solver» box in the middle of the page, then click OK. Solver should now appear as a tool in the Data tab that’s at the top of Excel.


Advertisement
-
1
Understand Solver’s use. Solver can analyze your spreadsheet’s data and any constraints you’ve added to show you possible solutions. This is useful if you’re working with multiple variables.
-
2
Add your data to your spreadsheet. In order to use Solver, your spreadsheet must have data with different variables and a solution.
- For example, you might create a spreadsheet documenting your various expenses over the course of a month with the output cell resulting in your money left over.
- You can’t use solver on a spreadsheet which doesn’t have solvable data (i.e., your data has to have equations).
-
3
Click the Data tab. It’s at the top of the Excel window. This will open the Data toolbar.
-
4
Click Solver. You’ll find this option in the far-right side of the Data toolbar. Doing so opens the Solver window.
-
5
Select your target cell. Click the cell in which you want to display your Solver solution. This will add it to the «Set Objective» box.
- For example, if you’re creating a budget where the end goal is your monthly income, you would click the final «Income» cell.
-
6
Set a goal. Check the «Value Of» box, then type your target value into the text box next to «Value Of».
- For example, if your goal is to have $200 at the end of the month, you would type 200 into the text box.
- You can also check either the «Max» or «Min» box in order to prompt Solver to determine the absolute maximum or minimum value.
- Once you’ve set a goal, Solver will attempt to meet that goal by adjusting other variables in your spreadsheet.
-
7
Add constraints. Constraints set restrictions on the values that Solver can use, which prevents Solver from accidentally nullifying one or more of your spreadsheet’s values. You can add a constraint by doing the following:[2]
- Click Add
- Click the cell (or select the cells) for which the constraint applies.
- Select a type of constraint from the middle drop-down menu.
- Enter the constraint’s number (e.g., a maximum or minimum).
- Click OK
-
8
Run Solver. Once you’ve added all of your constraints, click Solve at the bottom of the Solver window. This will prompt Solver to find the optimal solution for your problem.
-
9
Review the results. When Solver alerts you that it has an answer, you can see the answer by looking at your spreadsheet to see which values were changed.
-
10
Change your Solver criteria. If the output that you received isn’t ideal for your spreadsheet, click Cancel in the pop-up window, then adjust your objective and constraints.
- If you do like your Solver’s results, you can apply them to your spreadsheet by checking the «Keep Solver Solution» box and then clicking OK.


Advertisement
Ask a Question
200 characters left
Include your email address to get a message when this question is answered.
Submit
Advertisement
Video
-
Solver is best used for problems such as scheduling employees, determining the lowest price for which you can sell items while meeting a financial goal, and budgeting.
Thanks for submitting a tip for review!
Advertisement
-
Solver cannot be used in spreadsheets in which there is no «output» or actual solution. For example, you can’t apply solver to a spreadsheet which has no equations.
Advertisement
About This Article
Article SummaryX
1. Enable Solver in the «Add-ins» section of your Excel preferences if necessary.
2. Open a spreadsheet with data you want to analyze.
3. Click Data, then click Solver.
4. Select a cell to use from the «Set Objective» field.
5. Check the «Value Of» box, then enter a desired value.
6. Click Solve.
Did this summary help you?
Thanks to all authors for creating a page that has been read 590,232 times.
Is this article up to date?
A solver is a mathematical tool present in MS-Excel that is used to perform calculations by working under some constraints/conditions and then calculates the solution for the problem. It works on the objective cell by changing the variable cells any by using sum constraints.
Solver is present in MS- Excel but for using it we need to activate it. For activating the solver tool we need to do the following steps:
Step 1: Go to File and select options. The following dialog box will appear.
Step 2: Now select the Add-ins option and click on Go and finally click on OK.
Step 3: After clicking OK, Select Solver Add-in and press OK. Now solver will be activated in Excel.
Step 4: Now solver will appear in data section like this.
Now let’s understand how to use solver with the help of an example.
Example:
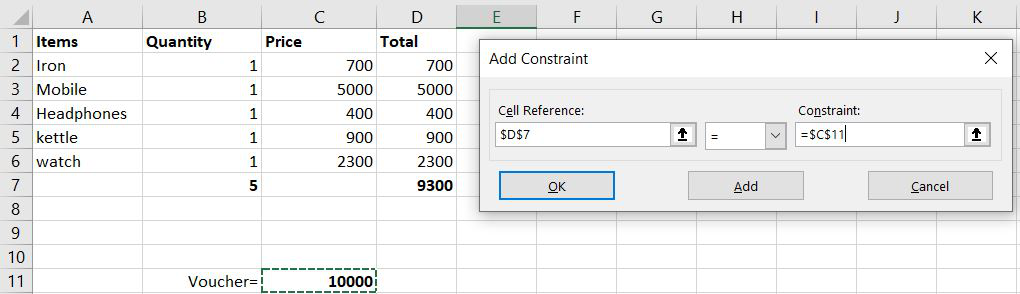
We went to a mall and we also have a gift voucher worth rs.10,000 and We want to purchase items in such a manner that all the money of the gift voucher gets utilized.
So, suppose we purchased the following items.
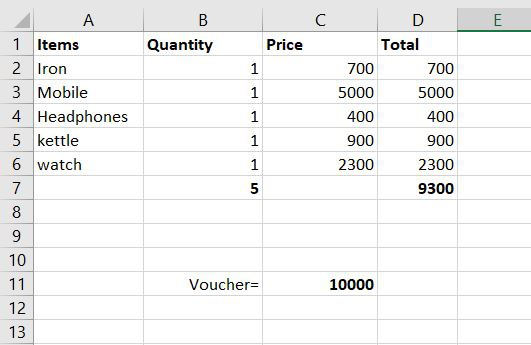
Suppose we purchased the above items in only one quantity and the total came out to be 9300 but the voucher was for rs.10,000. So now we want to use Solver for this purpose. Now let’s see how it will be done.
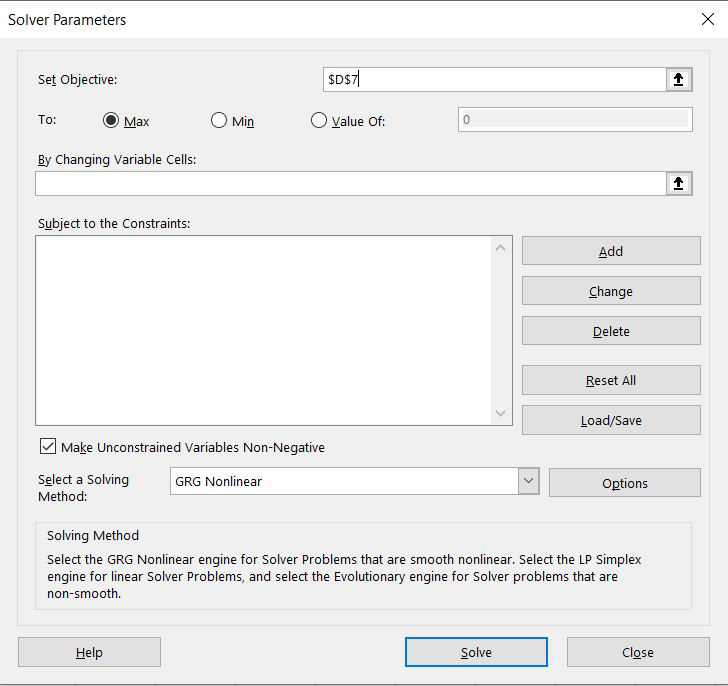
Step 1: Firstly go on data and find solver there and click it. The following dialog box will appear. Now in this, we have to select the objective in which we want to change our value.
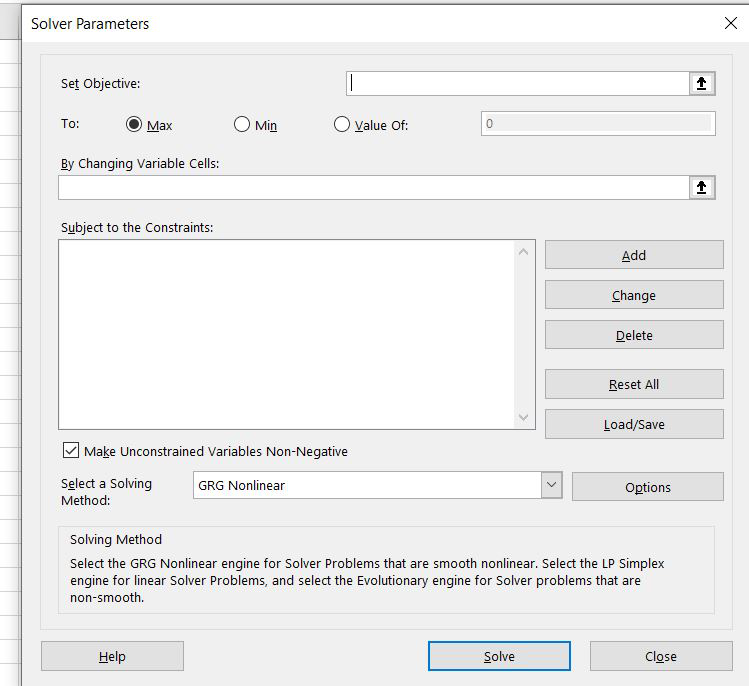
Step 2: In the set objective we have to select the total of the D column because want the value to change from 9300 to 10,000. After clicking on D7 following thing will be displayed on the set objective block.
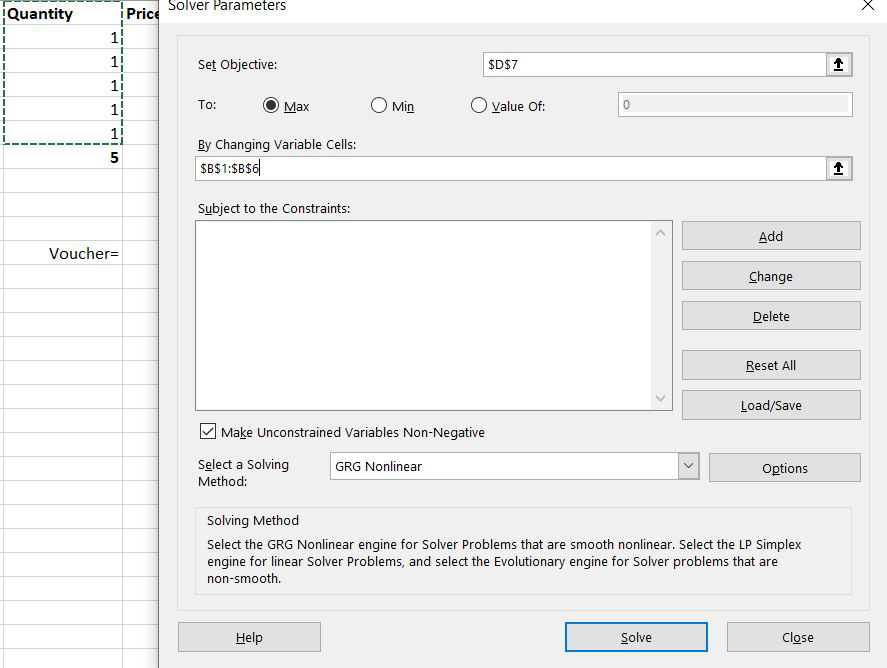
Step 3: Now in the ‘By changing Variable cell’ we will select the Quantity cell because we want to change the quantity in such a way so that the total amount comes to 10,000.
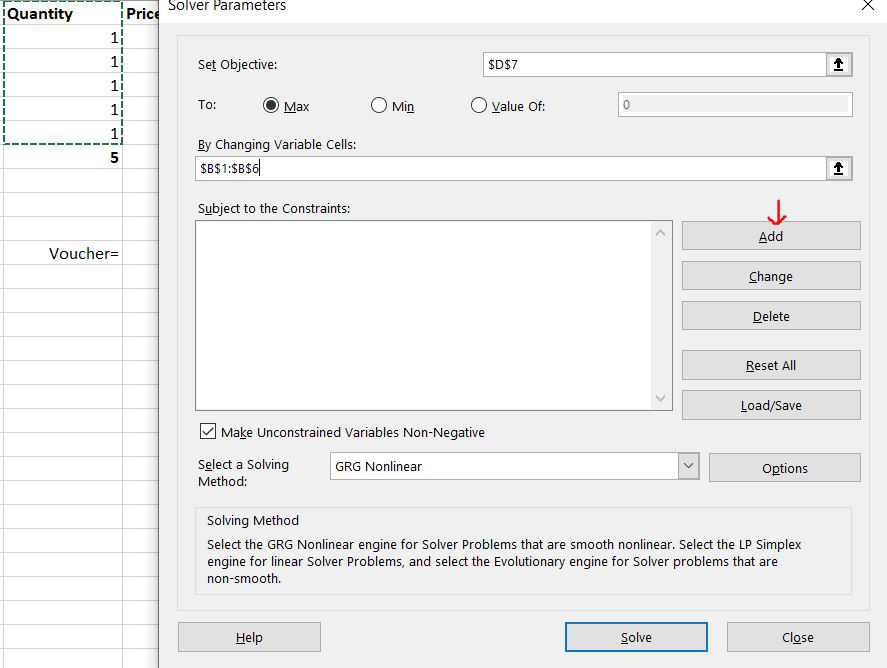
Step 4: Now we have to set some conditions under which we want our work to get done. So for setting some conditions /constraints, we will click on Add.
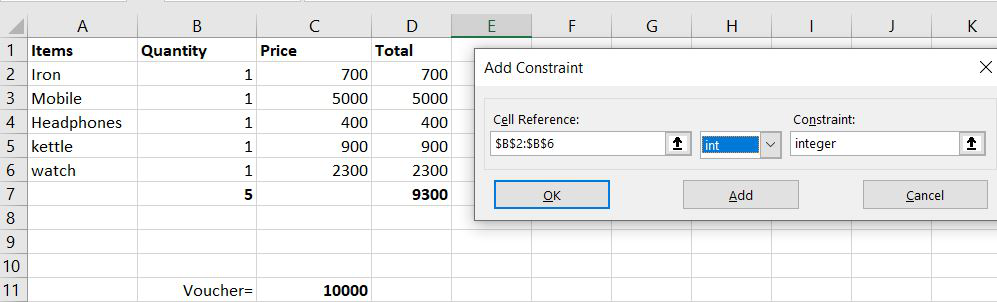
Step 5– Now, a dialog box will appear and we will add 3 conditions. The first condition is that the total amount should be equal to the voucher amount. So we will select cell D7 in a cell reference and then = sign, and finally, we will select cell C11. Now the first condition is added. To add the next condition press Add.
Step 6: For the second condition we will select the Quantity cell because we want the quantity to be an integer value, a whole value. So in cell reference, we will select from B2 to B6 then int, and then again will press Add.
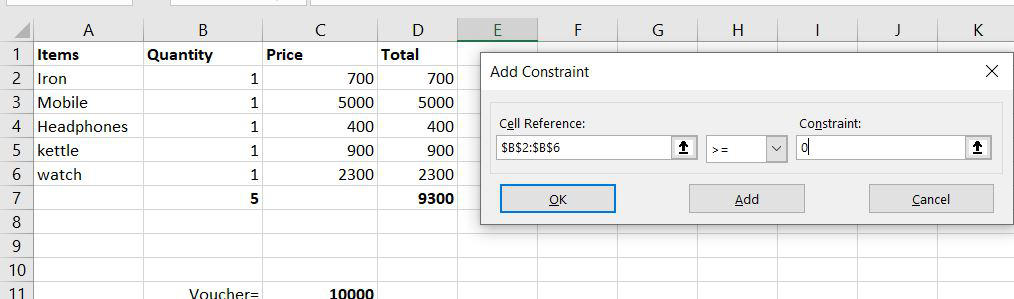
Step 7- Now for the third condition, we want that our item quantity should never be un negative which is not possible in real life. So we will select cells from B2 to B6 and should be >= to zero. Then click Add and cancel.
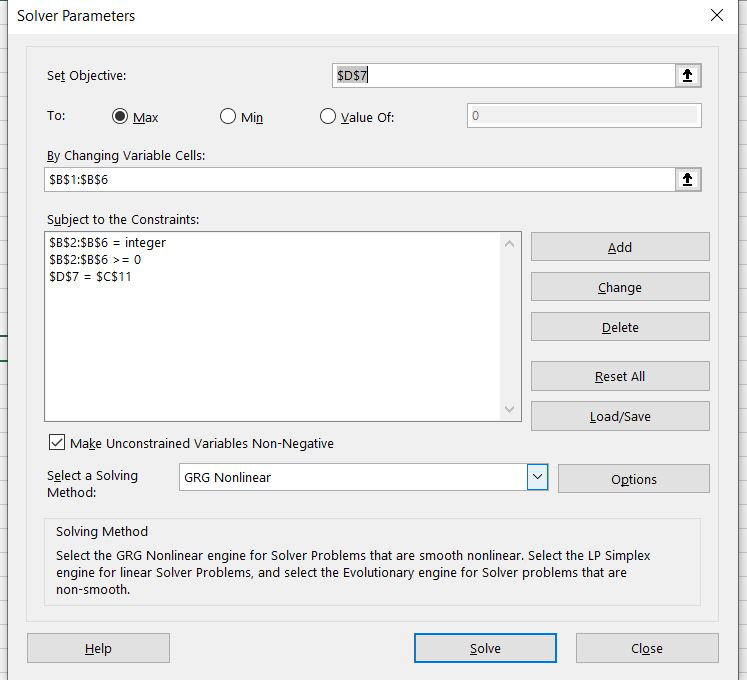
Step 8: Now the following dialog box will show all the 3 conditions that we used and now click on Solve.
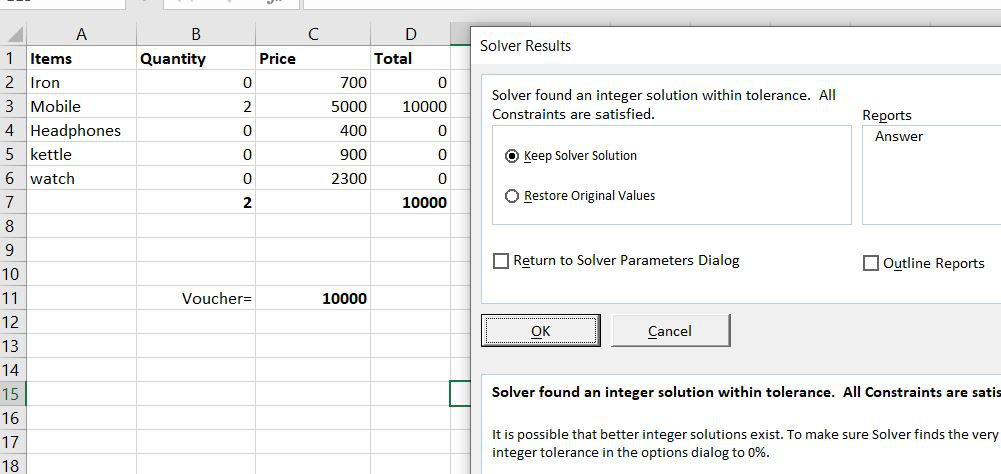
Step 9: By clicking Solve the solver will provide the desired output and to keep the answer we will click on keep solver solution.
So, this is what a solver is, How it is activated by not by default present in Excel and this is how it is used.
What is Solver in Excel?
The solver in excel is an analysis tool that helps find solutions to complex business problems requiring crucial decisions to be made. For every problem, the goal (objective), variables, and constraints are identified. The solver returns an optimal solution which sets accurate values of the variables, satisfies all constraints, and meets the goal.
For example, the solver helps create the most appropriate project schedule, minimize an organization’s expenses on transportation of its employees, maximize the profits generated by a given marketing plan, and so on.
The solver can solve the following types of problems:
- Optimization problems where profits need to be maximized and costs need to be minimized
- Arithmetic equations
- Linear and nonlinear problems
In optimization problems, the solver in excel helps to minimize or maximize the objective based on certain variables. Being known as a “what-if analysisWhat-If Analysis in Excel is a tool for creating various models, scenarios, and data tables. It enables one to examine how a change in values influences the outcomes in the sheet. The three components of What-If analysis are Scenario Manager, Goal Seek in Excel, and Data Table in Excel.read more” tool, the solver is enabled by the “add-insAn add-in is an extension that adds more features and options to the existing Microsoft Excel.read more” option or the Developer tab of Excel.
Table of contents
- What is Solver in Excel?
- The Functioning of the Excel Solver
- How to add “Solver Add-In” in Excel?
- The Terminologies of the Solver in Excel
- The Types of Solving Methods
- How to use the Solver in Excel?
- Example #1
- Example #2
- The Applications of the Solver Excel Model
- Frequently Asked Questions
- Recommended Articles
The Functioning of the Excel Solver
For solving a problem, the user has to input certain parameters based on which the solver operates. The tasks of the user followed by the functions of the solver are listed as under:
- Identify the goal (objective) of the problem–This tells the solver what has to be done, thereby lending a direction to the solver.
- Choose the variables of the problem–This tells the solver the areas it has to work upon. The solver in excel returns the most appropriate values of the variables that meet the goal.
- Set the constraints of the problem–This tells the solver to work within the limits defined by the constraints. The solver returns a solution that meets the goal and, at the same time, does not go beyond these limitations.
Hence, the entire solution is focused on the goal of the problem. The solver returns the best possible solution for a problem keeping in mind the set of controls.
How to add “Solver Add-In” in Excel?
The “solver add-in” is not enabled by default in Excel. The two ways to activate the “add-in” are stated as follows:
a. With the “add-ins” option of the File menu
b. With the Developer tabEnabling the developer tab in excel can help the user perform various functions for VBA, Macros and Add-ins like importing and exporting XML, designing forms, etc. This tab is disabled by default on excel; thus, the user needs to enable it first from the options menu.read more
You can download this Solver Excel Template here – Solver Excel Template
a. The steps under “add-ins” option of the File menu are listed as follows:
- Click on the File menu.

- Select “options” from the various options listed in the menu.

- Click on “add-ins.” Select “solver add-in” and click “go.”

- Select the checkbox for “solver add-in” and click “Ok.”


b. The steps under the Developer tab option are listed as follows:
- In the Developer tab, click on “Excel add-ins” in the “add-ins” group. Select the checkbox “solver add-in” and click “Ok.”
- Once installed, the “solver” button appears in the “analysis” group of the Data tab.

The Terminologies of the Solver in Excel
The solver model consists of the objective cells, variable cells, constraints, and formulas that interconnect these components. The excel solver finds an optimal solution to the formula mentioned in the objective cell by changing the variable data cells, given the restrictions of the constraint cells.
Let us understand the terminologies used in the “solver parameters” dialog box. This will be helpful when running the solver. The terms are defined as follows:
- Objective cell: This is a single cell which contains a formula. The formula is decision-based and subject to the restrictions of the constraint cells. The value of the objective cell can be minimized, maximized, or set equal to the specified target value.
- Decision variable or variable cells: These are the cells in which the solver returns the values based on the objective of the problem. Since these data cells are variable, they can be changed with respect to the objective. In Excel, up to 200 variable cells can be specified.
- Constraint cells: These are the limitations within which the given problem is solved. In other words, they are the conditions that should be satisfied.
The Types of Solving Methods
The three methods to solve the data in the excel solver are listed as follows:
- GRG nonlinear
The acronym “GRG” stands for “generalized reduced gradient nonlinear.” This method helps solve nonlinear problems. A nonlinear problem may have more than one feasible region. Alternatively, it may have a set of similar values for the variable cells with all the constraints being satisfied.
2. Simplex LP
The acronym “LP” stands for linear problems. This method helps solve linear programming problems and works faster than the GRG nonlinear method. In a linear programming problem, a single objective has to be maximized or minimized subject to certain conditions.
The simplex LP and GRG nonlinear method both are used for smooth problems.

3. Evolutionary
This method helps solve non-smooth problems, which consist of discontinuous functions. The non-smooth problems are the most challenging optimization models to solve.

How to use the Solver in Excel?
Let us consider some examples to understand the solver tool of Excel.
You can download this Solver Excel Template here – Solver Excel Template
Example #1
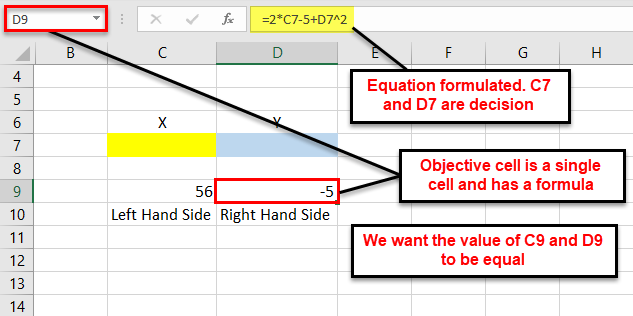
We want to find the value of X and Y in the following arithmetic equation with the help of the solver tool.
56=2X-5+Y2
Step 1: Formulate the equation on an Excel sheet, as shown in the following image.
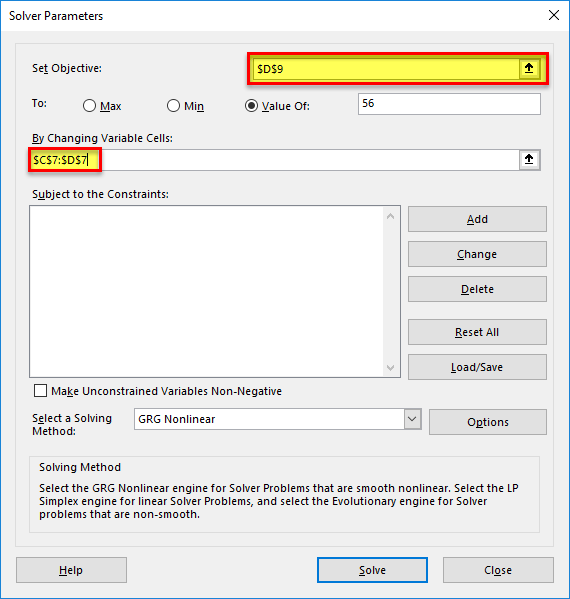
Step 2: Click the “solver” button in the “analysis” group of the Data tab. The “solver parameters” dialog box opens. Enter cell “$D$9” in the objective cell, as shown in the succeeding image. The variable cells are “$C$7:$D$7.”
In the “value of” box, type 56. This is because the right-hand side value of the given equation should be equal to 56.
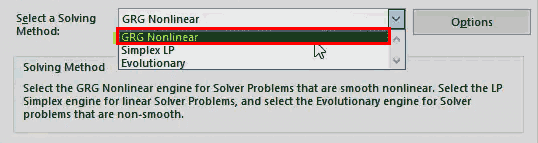
Step 3: Select GRG nonlinear in the “select a solving method” box. Click “solve.”
Note: The GRG nonlinear is the default solving method.
Step 4: The “solver results” box appears. This box may take some time to display depending on the complexity of the model. Select “keep solver solution” and click “Ok,” as shown in the following image.
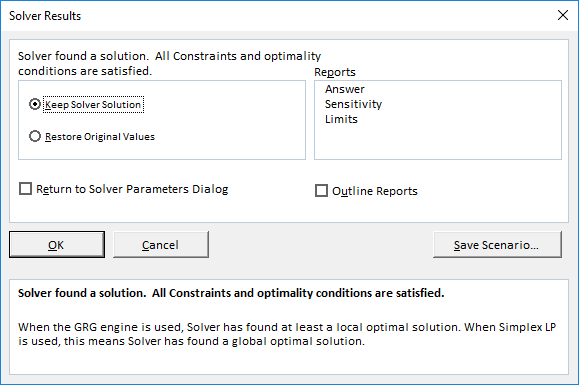
Step 5: The results are shown in the following image. The solver has calculated X as 30.5 and Y as 0. The right-hand and left-hand sides both are equal now.

Example #2
The succeeding image provides the details of an organization that manufactures a television set, stereo, and speaker. The raw materials used are chassis, picture tube, speaker cone, power supply, and electronics. The leftover stock of raw materials is given in G10:G14.
We want to maximize the overall profits given the limited availability of the raw materials.
The variable cells, constraint cells, and the objective cell are highlighted.
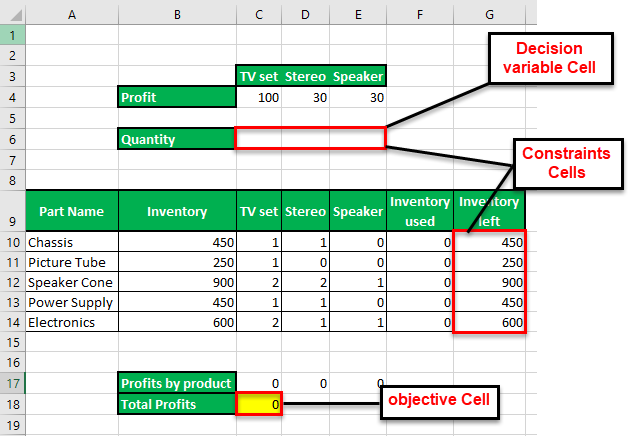
Step 1: Calculate the “used inventory” in F10:F14. The formula is shown in the following image.

Step 2: Click the “solver” button in the “analysis” group of the Data tab. In the “solver parameters” dialog box, click “add” to the right of the “subject to the constraints” box.
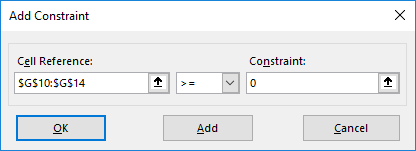
Step 3: The “add constraint” box appears, as shown in the succeeding image. The constraints are defined as follows:
- The leftover stock of raw materials should be greater than or equal to zero. So, enter “$G$10:$G$14” in the “cell referenceCell reference in excel is referring the other cells to a cell to use its values or properties. For instance, if we have data in cell A2 and want to use that in cell A1, use =A2 in cell A1, and this will copy the A2 value in A1.read more” box. In the box to the right, type the comparison operator “>=.” In the “constraint” box, enter “0.”
- The quantity of the three products (television set, stereo, and speaker) should be greater than or equal to zero. So, enter “$C$6:$E$6>=0” as done for the preceding point.
After entering every constraint, click the “add” button to add it to the “solver parameters” box. Once all constraints have been entered, click “Ok.”
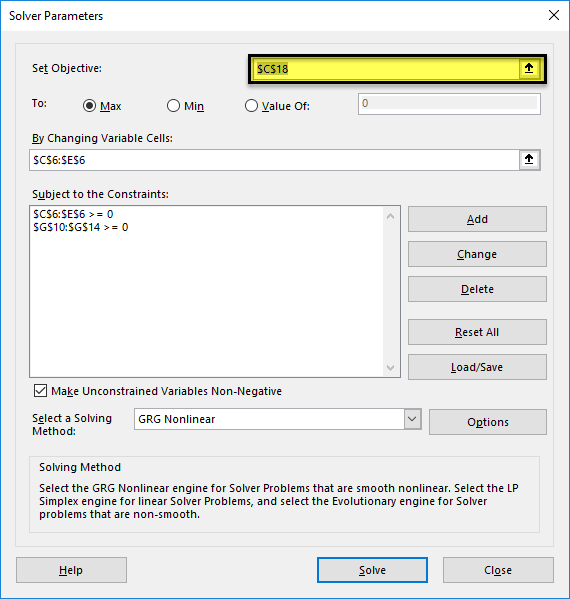
Step 4: In the “solver parameters” box, enter “$C$18” in the “set objective” box. Select the “max” option. In the “by changing variable cells” box, enter “$C$6:$E$6.” Select the solving method as GRG nonlinear. Click “solve.”
Step 5: The output is shown in the following image. The organization must produce 250 television sets, 50 stereos, and 50 speakers to make a profit of $28,000. The product-wise profits are also displayed in C17:E17.
This is an optimal solution given the constraints. With these numbers, the organization will be able to utilize its resources efficiently.

The Applications of the Solver Excel Model
The major applications of the excel solver are listed as follows:
- It helps take decisions at the top level of management. For instance, an organization may want to maximize the profits and minimize the costs given the limited resources of inventory and manpower.
- It helps solve the day-to-day problems of life which can be converted into arithmetic equations. For instance, a housewife may require an optimal monthly budget to be created which can meet the family’s financial needs, given the limitations.
Frequently Asked Questions
1. Define the solver in Excel.
The solver can solve optimization problems, arithmetic equations, and linear and nonlinear programming models. It helps minimize or maximize the output based on the associated variables and the given constraints.
The solver tool consists of three components which are stated as follows:
• Objective cell – This contains a formula which is to be solved.
• Variable cells – These cells contain variable data which can be adjusted to attain the objective.
• Constraint cells – These are the conditions to be met by the solution of the problem.
The solver solves the problems with the help of three methods GRG nonlinear, simplex LP, and evolutionary. The first two methods are used for smooth problems, while the last helps solve non-smooth problems.
2. What is the purpose of using the solver in Excel?
The objectives of using the solver are listed as follows:
• To find an optimal solution to a problem
• To help minimize or maximize the formula value
• To work on variable data provided the constraints are adhered to
• To perform a comprehensive analysis necessary for making decisions
3. What are the solver parameters in Excel?
The “solver parameters” is a dialog box which appears on clicking the “solver” button in the Data tab. It consists of the following components:
• “Set objective” – This is the objective cell categorized into “max,” “min,” and “value of.” The “max” and “min” help maximize or minimize the formula value respectively. The “value of” category helps set the desired target value.
• “By changing variable cells” – This consists of a range of variable data cells that are changed to achieve the goal.
• “Subject to the constraints” – These are the constraints that can be added, modified, and deleted depending on the requirement.
• “Load/save” button – This saves the current model and displays the stored parameters.
• “Select a solving method” – This consists of the method to solve the problem. Any one of the three methods (GRG nonlinear, simplex LP, and evolutionary) can be selected.
• “Solve” button – This is clicked once all the data has been entered in the tool. It takes the user to the “solver results” dialog box.
Note: If the variable cells are non-adjacent, select the range by pressing and holding the “Ctrl” key.
Recommended Articles
This has been a step-by-step guide to the Solver in Excel. Here we discuss how to use Solver in Excel along with examples and downloadable Excel templates. You may also look at these useful functions in Excel –
- VBA Refresh Pivot TableWhen we insert a pivot table in the sheet, once the data changes, pivot table data does not change itself; we need to do it manually. However, in VBA, there is a statement to refresh the pivot table, expression.refreshtable, by referencing the worksheet.read more
- Sum by Color in ExcelIn Excel, Sum by Color refers to adding a range of cells as per their specific background colour & you can do it by using the SUBTOTAL or GET.CELL function. read more
- Delete Pivot Table ExcelTo delete a pivot table in Excel, you must first select it. Then go to the Analyze menu tab under the Design and Analyze menu tabs and select actions. Then, from the Select option’s drop-down option, select Entire Pivot Table to delete it.read more
- Equations in ExcelIn Excel, equations are the formulas we type into cells. We begin by writing an equation with an equals to symbol (=), which Excel knows as calculate.read more