Excel for Microsoft 365 Excel for Microsoft 365 for Mac Excel for the web Excel 2021 Excel 2021 for Mac Excel 2019 Excel 2019 for Mac Excel 2016 Excel 2016 for Mac Excel 2013 Excel 2010 Excel 2007 Excel for Mac 2011 Excel Starter 2010 More…Less
This article describes the formula syntax and usage of the NPV function in Microsoft Excel.
Description
Calculates the net present value of an investment by using a discount rate and a series of future payments (negative values) and income (positive values).
Syntax
NPV(rate,value1,[value2],…)
The NPV function syntax has the following arguments:
-
Rate Required. The rate of discount over the length of one period.
-
Value1, value2, … Value1 is required, subsequent values are optional. 1 to 254 arguments representing the payments and income.
-
Value1, value2, … must be equally spaced in time and occur at the end of each period.
-
NPV uses the order of value1, value2, … to interpret the order of cash flows. Be sure to enter your payment and income values in the correct sequence.
-
Arguments that are empty cells, logical values, or text representations of numbers, error values, or text that cannot be translated into numbers are ignored.
-
If an argument is an array or reference, only numbers in that array or reference are counted. Empty cells, logical values, text, or error values in the array or reference are ignored.
-
Remarks
-
The NPV investment begins one period before the date of the value1 cash flow and ends with the last cash flow in the list. The NPV calculation is based on future cash flows. If your first cash flow occurs at the beginning of the first period, the first value must be added to the NPV result, not included in the values arguments. For more information, see the examples below.
-
If n is the number of cash flows in the list of values, the formula for NPV is:
-
NPV is similar to the PV function (present value). The primary difference between PV and NPV is that PV allows cash flows to begin either at the end or at the beginning of the period. Unlike the variable NPV cash flow values, PV cash flows must be constant throughout the investment. For information about annuities and financial functions, see PV.
-
NPV is also related to the IRR function (internal rate of return). IRR is the rate for which NPV equals zero: NPV(IRR(…), …) = 0.
Example
Copy the example data in the following table, and paste it in cell A1 of a new Excel worksheet. For formulas to show results, select them, press F2, and then press Enter. If you need to, you can adjust the column widths to see all the data.
|
Data |
Description |
|
|---|---|---|
|
0.1 |
Annual discount rate |
|
|
-10000 |
Initial cost of investment one year from today |
|
|
3000 |
Return from first year |
|
|
4200 |
Return from second year |
|
|
6800 |
Return from third year |
|
|
Formula |
Description |
Result |
|
=NPV(A2, A3, A4, A5, A6) |
Net present value of this investment |
$1,188.44 |
Example 2
|
Data |
Description |
|
|---|---|---|
|
0.08 |
Annual discount rate. This might represent the rate of inflation or the interest rate of a competing investment. |
|
|
-40000 |
Initial cost of investment |
|
|
8000 |
Return from first year |
|
|
9200 |
Return from second year |
|
|
10000 |
Return from third year |
|
|
12000 |
Return from fourth year |
|
|
14500 |
Return from fifth year |
|
|
Formula |
Description |
Result |
|
=NPV(A2, A4:A8)+A3 |
Net present value of this investment |
$1,922.06 |
|
=NPV(A2, A4:A8, -9000)+A3 |
Net present value of this investment, with a loss in the sixth year of 9000 |
($3,749.47) |
Top of Page
Need more help?
NPV Function in Excel
NPV in Excel is also known as the net present value formula in Excel, which is used to calculate the difference between the current cash inflow and cash outflow for an investment. It is a built-in function in Excel. It is a financial formula that inputs the rate value for inflow and outflow.
The NPV (Net Present Value) function on Excel calculates the net present value for periodic cash flows based on a supplied discount rate and a series of payments. The NPV in Excel is generally leveraged under financial calculation.
In financial projects, the NPV in Excel is useful in finding the value of an investment or analyzing the feasibility of a project. Therefore, it is recommended that financial analysts should use the XNPV function over the regular NPV (Net Present Value) in the Excel function.
Table of contents
- NPV Function in Excel
- NPV Formula in Excel
- NPV Equation
- How to use the NPV Function in Excel? (with Examples)
- Example #1
- Example #2
- Things to note about the NPV in Excel
- NPV in Excel Video
- Recommended Articles
NPV Formula in Excel
The NPV in excel accepts the following arguments:
- Rate (argument required): It is the discount rate over the length of the period.
- Value1, Value2: Value1 is required. They are numeric values that represent a series of payments and income where:
- Outgoing payments are mentioned as negative numbers.
- Incoming payments are mentioned as positive numbers.
NPV Equation
The calculation of NPV (Net Present Value) of an Investment in the Excel’s NPV function is based upon the following equation:
How to use the NPV Function in Excel? (with Examples)
Let’s take a few NPV excel calculation examples before using the NPV function in the Excel workbook:
You can download this NPV Function Excel Template here – NPV Function Excel Template
Example #1
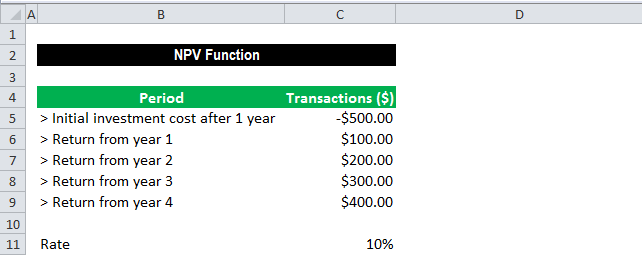
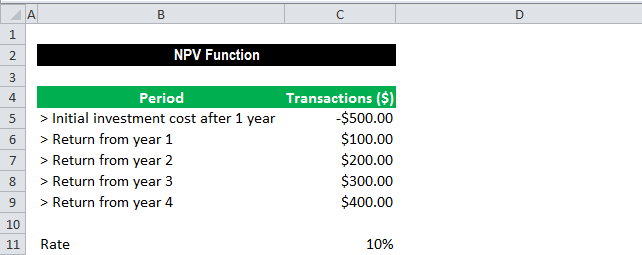
Suppose we are working on the following data set on cash inflows and outflows:
The below spreadsheet shows a simple example of the NPV function in excel.
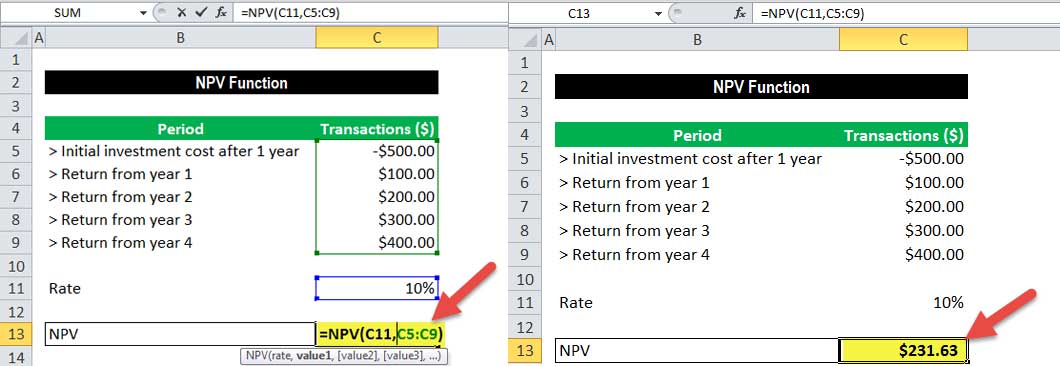
The rate arguments that are supplied to the function are stored in cell C11, and the value arguments have been stored in cells C5-C9 of the spreadsheet. The NPV in Excel is entered in the cell C13.
This function gives the result of $231.63.
In this example, we made the initial investment of $500 (shown in cell C5) at the end of the first period. This value is considered the first argument (value1) to the NPV function in Excel.
Example #2
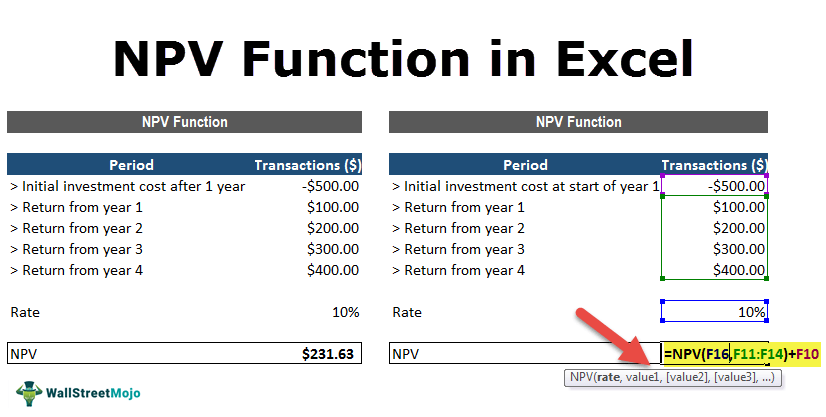
The below spreadsheet shows a further example in which the first payment is made at the start of the first period and how this payment should be considered in the NPV function in Excel.
Again, the rate of 10% is stored in cell C11, and cash flow value arguments of the transactions are held between the range C5-C9 of the spreadsheet. NPV in Excel is inserted in cell C11.
The function gives the result of $2,54.80.
Note that, as the initial investment of $500 (shown in cell C5) was done at the start of the first period, this value is not included in the arguments to the NPV function in Excel. Instead, the first cash flow is added to the NPV Excel result.
As described in example # 2, the NPV formula in excelThe NPV (Net Present Value) of an investment is calculated as the difference between the present cash inflow and cash outflow. It is an Excel function and a financial formula that takes rate value for inflow and outflow as input.read more is established on future cash flows. Therefore, if the first cash flow happens at the start of the first period, we must add the first cash flow value to the NPV Excel result. We should not include it in the values arguments.
Things to note about the NPV in Excel
- The NPV investment begins one period ahead of the date of the value1 cash flow and ends with the last cash flow in the list. The NPV calculation in Excel is based upon future cash flows. Therefore, if the first cash flow is made at the beginning of the first period, the first value must be explicitly added to the NPV Excel result, excluded in the values arguments. For more information, see the examples below.
- Let us say n is the number of cash flows in the list of values; the formula for NPV (Net Present Value) in Excel would be:
- If the arguments are supplied individually, numbers, logical values, blank cells, and text representations of numbers are evaluated as numeric values. At the same time, the function ignores other values of cells in text and error form.
- If the arguments are supplied in a range, all non-numeric values in the range are ignored.
- We need to enter transactions, payments, and income values in the right sequence as NPV functions use the order of the 2nd argument, i.e., value1, value2, …, to evaluate the ranking of cash flows.
- The key difference between NPV functions and PV function is that PV allows cash flows to begin either at the beginning or at the end of the period.
- NVP (Net Present ValueNet Present Value (NPV) estimates the profitability of a project and is the difference between the present value of cash inflows and the present value of cash outflows over the project’s time period. If the difference is positive, the project is profitable; otherwise, it is not.read more)function in the latest versions of Excel can accept up to 254 value arguments, but with Excel 2003, only up to 29 values can be supplied.
NPV in Excel Video
Recommended Articles
This article is a guide to NPV Function in Excel. We discuss the NPV formula in Excel and how to use NPV in Excel, along with practical examples and downloadable Excel templates.
- Examples of NPVNet Present Value (NPV) refers to the dollar value derived by deducting the present value of all the cash outflows of the company from the present value of the total cash inflows. For example, if the present value of all the company’s cash outflows is $100,000 and the present value of the total cash inflows is $120,000, the net present value will be $20,000 ($120,000 – $100,000).read more
- NPV Profile DefinitionA net present value (NPV) profile is a graph that depicts the relationship between the project’s net present value and various discount rates. The NPV of the project is plotted on the Y-axis, and the discount rate is plotted on the X-axis.read more
- PV Function in ExcelPV, or present value, is a function that is used to calculate the current present value of any investment. It is determined by the investment rate and the number of payment periods, with the future value as an input.read more
- PMT Function
- Linear Programming in ExcelLinear programming in excel helps implement this applied mathematics aspect to excel worksheet for solving business problems through resource optimization. For this purpose, the user can opt for the «Excel Solver».read more
Download Article
Download Article
This wikiHow teaches you how to calculate the Net Present Value (NPV) of an investment using Microsoft Excel. You can do this on both the Windows and the Mac versions of Excel.
-
1
Make sure that you have the investment information available. To calculate NPV, you need to know the annual discount rate (e.g., 1 percent), the initial amount invested, and at least one year of investment return.[1]
- Having three or more years of investment return is ideal, but not necessary.
-
2
Open Microsoft Excel. Its app icon resembles a green box with a white «X» on it.
Advertisement
-
3
Click Blank workbook. It’s in the upper-left side of the Excel window.
-
4
Enter your investment’s discount rate. Select a cell (e.g., A2), then type in the decimal equivalent of your investment’s annual discount percentage.
- For example, if the discount rate is 1 percent, you’d enter 0.01 here.
-
5
Enter the initial investment amount. Select an empty cell (e.g., A3) and type in the amount that you initially invested.
-
6
Enter each year’s return amount. Select an empty cell (e.g., A4), enter the first year’s return amount, and repeat for each subsequent year for which you have a return number.
-
7
Select a cell. Click a cell in which you want to calculate the NPV.
-
8
Enter the NPV formula beginning. Type in =NPV() here. Your investment data will go in between the parentheses.
-
9
Add values to the NPV formula. Inside of the parentheses, you’ll need to add the cell numbers that contain discount rate, investment amount, and at least one return value.
- For example, if your discount rate is in cell A2, the investment amount is in A3, and the return value is in A4, your formula would read =NPV(A2,A3,A4).
-
10
Press ↵ Enter. This will prompt Excel to calculate the NPV and display it in the selected cell.
- If the NPV displays in red, the investment’s value is negative.
Advertisement
Add New Question
-
Question
What is the NPV for investments using assumed cost of capital or discount rate?
if the interest rate is not given, then cost of capital will be the assumed discount rate.
Ask a Question
200 characters left
Include your email address to get a message when this question is answered.
Submit
Advertisement
-
NPV can be used to forecast for future investments if you’re confident in the current returns.
Thanks for submitting a tip for review!
Advertisement
-
If you don’t have at least one year of investment return, you won’t be able to calculate NPV.
Advertisement
About This Article
Article SummaryX
1. Enter the investment’s discount rate into a cell.
2. Enter the initial investment amount below it.
3. Enter each year’s return amount below.
4. Select a blank cell.
5. Type «=NPV( )».
6. Put each cell address in the parentheses separated by commas.
7. Press Enter.
Did this summary help you?
Thanks to all authors for creating a page that has been read 526,806 times.
Is this article up to date?
Net present value (NPV) is a core component of corporate budgeting. It is a comprehensive way to calculate whether a proposed project will be financially viable or not.
The calculation of NPV encompasses many financial topics in one formula: cash flows, the time value of money, the discount rate over the duration of the project (usually the weighted average cost of capital (WAAC)), terminal value, and salvage value.
Key Takeaways
- Net present value (NPV) can help companies determine the financial viability of a potential project.
- It’s especially useful when comparing more than one potential project or investment.
- NPV is an essential tool for corporate budgeting.
- You can use Excel to calculate NPV instead of figuring it manually.
- An NPV of zero or higher forecasts profitability for a project or investment; projects with a negative NPV forecast loss.
Click Play to Learn the Net Present Value Formula
How to Use Net Present Value
To understand NPV in the simplest forms, think about how a project or investment works in terms of money inflow and outflow.
Say, you are contemplating setting up a factory that needs initial funds of $100,000 during the first year. Since this is an investment, it is a cash outflow that can be taken as a net negative value. It is also called an initial outlay.
You expect that after the factory is successfully established in the first year with the initial investment, it will start generating the output (products or services) by the second year and onwards. That will result in net cash inflows in the form of revenues from the sale of the factory output.
The factory generates $100,000 during the second year. That amount increases by $50,000 each year over five years. The actual and expected cash flows of the project are as follows:
Year-A represents actual cash flows while Years-P represent projected cash flows over the mentioned years. A negative value indicates cost or investment, while a positive value represents inflow, revenue, or receipt.
Now, how do you decide whether this project is profitable or not? The challenge is that you are making investments during the first year and realizing the cash flows over a course of many future years.
When multi-year ventures need to be assessed, NPV can assist the financial decision-making, provided the investments, estimates, and projections are accurate.
NPV calculations bring all cash flows (present and future) to a fixed point in time in the present. Hence, the term present value. NPV essentially works by figuring what the expected future cash flows are worth at present. Then, it subtracts the initial investment from that present value to arrive at net present value. If this value is positive, the project may be profitable and viable. If this value is negative, the project may not be profitable and should be avoided.
In the simplest terms:
NPV = (Today’s value of expected future cash flows) – (Today’s value of invested cash)
NPV
An NPV of greater than $0 indicates that a project has the potential to generate net profits. An NPV of less than $0 indicates a losing proposition. Usually, NPV is just one metric used along with others by a company to decide whether to invest.
2 Ways to Calculate NPV in Excel
There are two methods to calculate net present value in Excel. You can use the basic formula, calculate the present value of each component for each year individually, and then sum all of them up. Or, you can use Excel’s built-in NPV function.
1. Using Present Value to Calculate NPV
Using the figures from the above example, assume that the project will need an initial outlay of $250,000 in year zero. From the second year (year one) onwards, the project starts generating inflows of $100,000. They increase by $50,000 each year till year five when the project is completed.
The WACC is used by the company as the discount rate when budgeting for a new project. For this project, it’s 10%.
The present value formula is applied to each of the cash flows from year zero to year five. For example, the cash flow of -$250,000 results in the same present value during year zero. Year 1’s inflow of $100,000 during the second year results in a present value of $90,909. Year 2’s inflow of $150,000 is worth $123,967, and so on.
Calculating present value for each of the years and then summing those up produces an NPV of $472,169, as shown above.
2. Using the NPV Function to Calculate NPV
The second Excel method uses the built-in NPV function. It requires the discount rate (again, represented by WACC), and the series of cash flows from year 1 to the last year. Be sure that you don’t include the Year zero cash flow (the initial outlay) in the formula.
The result using the NPV function for the example comes to $722,169. Then, to compute the final NPV, subtract the initial outlay from the value obtained by the NPV function. NPV = $722,169 — $250,000, or, $472,169.
This computed value matches that obtained using the first method.
excel
While Excel is a great tool for making rapid calculations with precision, errors can occur. Since a simple mistake can lead to incorrect results, it’s important to take care when inputting data.
Pros and Cons of the 2 Methods
Analysts, investors, and economists can use either of the methods, after assessing their pros and cons.
Method 1
Pro
The present value method is preferred by many for financial modeling because its calculation and figures are transparent and easy to audit.
Con
Unfortunately, it requires multiple manual steps. This takes time and has the potential for input errors.
Method 2
Pro
Method Two’s NPV function method can be simpler and involve less effort than Method One.
What’s more, although it assumes unrealistically that all cash flows are received at the end of the year, cash flows can be discounted at mid-year, as needed (the XNPV function can help here). This presents a better view of after-tax cash flows over the course of the year.
Con
On the downside, the initial cash outlay must be netted out manually, a need that can be overlooked by Excel users.
Also, for financial modeling and audit purposes, it’s harder with Method Two than with Method One to determine the calculations, figures used, what’s hardcoded, and what’s input by users.
What Is Net Present Value?
Net present value is the difference between the present value of cash inflows and the present value of cash outflows over a certain period of time. It’s a metric that helps companies foresee whether a project or investment will be profitable. NPV plays an important role in a company’s budgeting process and investment decision-making.
How Do I Interpret NPV?
A net present value of $0 or higher is a good sign. It indicates that a project will be profitable. A net present value that’s less than $0 means a project isn’t financially feasible and perhaps should be avoided.
Can I Calculate NPV Using Excel?
Yes. While you could calculate NPV by hand, you can use an NPV formula in Excel or use the NPV function to get a value more quickly. There’s also an XNPV function that’s more precise when you have various cash flows occurring at different times.
The Bottom Line
Net present value can be very useful to companies for effective corporate budgeting. Excel can also be useful in helping a business calculate NPV.
Whichever Excel method one uses, the result obtained is only as good as the values inserted in the formulas. Therefore, be sure to be as precise as possible when determining the values to be used for cash flow projections before calculating NPV.
Net Present Value (NPV) is a method to analyze projects and investments and find out whether these would be profitable or not.
It’s widely used in the financial world and is considered a robust way to make accurate investment decisions.
To give you an example, if you’re considering an investment plan, where you invest $100 every month for the next 10 years and get $20,000 at the end of 10 years, you can use the NPV method to find out whether this is a profitable investment decision or not.
Don’t worry, things will get a lot clearer as I cover some examples later in the tutorial.
In this tutorial, I will show you different examples of calculating NPV in Excel. I’ll also cover two formulas to calculate NPV in excel – NPV and XNPV function.
So let’s get started!
What is NPV – An Easy Explaination
Before I get into calculating the NPV value next cell, let me quickly explain what it really means.
NPV (short for Net Present Value), as the name suggests is the net value of all your future cashflows (which could be positive or negative)
For example, suppose there’s an investment opportunity where you need to pay $10,000 now, and you will be paid $1000 per year for the next 20 years.
If you know what is the current discount rate (also called the cost of capital or the interest rate), you can use that in the NPV formula in Excel to calculate the net present value of all the future inflows that you will have in the next 20 years with this investment.
If that value is more than $10,000, then this is a profitable investment and you should go ahead and do it. And in case it is less than 10,000, then you end up with a loss and you shouldn’t do this investment (and instead invest the money at the current discount rate in government bonds or index funds).
NPV value is also used when comparing different projects or investment opportunities.
If you have 3 different projects with expected outflow and inflow values, you can use the net present values of all these to see which project has the best profitability.
Now that you have a decent understanding of what NPV is, let’s see a couple of examples on how to calculate in Excel.
Excel NPV Function
Excel has an in-built NPV function with the following syntax:
=NPV(rate, value1, [value2],...)
The above formula takes the following arguments:
- rate – this is the discount rate for one time period. For example, if your cashflows are happening every year, this would be the annual discount rate. If these are quarterly, this would be quarterly discount rate
- value1, value2… – these are the cashflow values and could be positive (inflow/income) or negative (outflow/payment). You can have a maximum of 254 values
Some important things to know when using the NPV function in Excel:
- The NPV function considers all the these values are evenly spaced out (i.e., have the same time interval between each value).
- The order of the values matter, so if you change the order and keep the same values, the final result would be different
- The formula considers that the inflow/outflow takes place at the end of the period
- It only considers the numeric values, and if there are blanks or text values, these would be ignored
The most important thing to keep in mind is that you can only use this formula when your regular flow of inflows and outflows. For example, if the inflow/outflow happens at the end of the year, it should be the same for all the values.
In case you have a dataset where the inflow/outflow happens on specific dates (and is not evenly spaced), you can not use the NPV formula. In that case, you need to use the XNPV formula.
Now that we know about the syntax of the NPV function, let’s have a look at some practical examples.
Calculating Net Present Value (NPV) in Excel
When working with the NPV formula in Excel, there could be two scenarios:
- The first outflow/inflow happens at the end of the first period
- The first outflow/inflow happens at the beginning of the first period
For example, if I am evaluating a project which would need an initial outlay of $100,000 and then yearly returns, the two scenarios would be:
- Outflow of $100,000 at the end of Year 1, and then inflows from end of Year 2 onwards
- Outflow of $100,000 at the beginning of Year 1, and then inflows from end of Year 1 onwards
You can use the NPV function in both scenarios with a minor adjustment.
Let’s have a look at each example!
First Outflow/Inflow Happens at the End of the First Period
Suppose I need to evaluate a project where the cash flows are as follows and the discount rate is 5%:

In this example, the first outflow of $100,000 happens at the end of year 1.
You can use the below formula to calculate the NPV value for this data:
=NPV(D2,B2:B7)

The above formula gives the NPV value of $15,017, which means that based on these cash flows and the given discount rate (also called the cost of capital), the project will be profitable and generate profit worth $15,017.
This is the straightforward use of the NPV function, but in most cases, you will be dealing with cases where the inflow happens in the beginning.
So let’s see an example of that.
First Outflow/Inflow Happens at the Beginning of the First Period
Below I have the data to evaluate a project where the cash flows are as follows and the discount rate is 5%:

You can use the below formula to calculate the NPV value for this data:
=B2+NPV(D2,B3:B7)

In the above formula, I have excluded the initial outflow, as it happens at the beginning of the first year.
Since the NPV function is programmed in such as way that it considers each value as an inflow/outflow at the end of each period, I excluded the initial outflow and calculated the NPV for all the other future cash flows.
And then the result of the NPV function is then added back to the initial outflow.
This gives us a value of $15,768, which is the profit we will make by investing in this project.
So in case you need to evaluate projects/investments where the first cash flow happens at the beginning of the first period, exclude it from the formula and add it back to the result.
Comparing Projects Using NPV to Find the Best One
In real life, it often happens that you need to analyze multiple projects/investment opportunities and see which ones are the best for you or your company.
NPV is often the best and most accepted way to compare different projects where you can the cashflows.
Suppose you have the dataset as shown below and you want to find out which project(s) are worth investing in.

For the purpose of this example:
- I am considering that the first cashflow happens at the end of first year
- The initial outflow for each project is $100,000
- The discount rate for evaluating all the projects is 5%
Below are the formulas that will give me the NPV value for each project.
Project 1:
=NPV(5%,B2:B7)
Project 2:
=NPV(5%,C2:C7)
Project 3:
=NPV(5%,D2:D7)

Based on the results, we can see that the return on Project 3 is the highest, and if you have to choose between one of these, you should choose Project 3.
Similarly, if you need to choose any two, you should choose Project 3 and 1, as these have a higher NPV.
When evaluating projects using the NPV method is that it works on projected future cash flows. With projections, there is always a risk that it may not turn out as we expected (could be higher or lower). Also, the risk of error in forecasting increases as the duration increases. We can forecast income in the next two years with far more accuracy than that of the income in the year 19 and 20.
Calculating NPV for Irregular Interval – Using XNPV Formula
NPV formula works great if you have regular cash flows (i.e., the time period between the cash flow is the same).
But in case it’s not, you can’t use the NPV function.
For such cases, Excel gives you the XNPV function.
The XNPV function is similar to the NPV function, with one improvement, you can specify dates for cashflows and it will calculate the present value for each cash flow based on it.
Below is the syntax of the XNPV formula:
=XNPV(rate, values, dates)
The above formula takes the following arguments:
- rate – this is the discount rate for one time period. For example, if your cashflows are happening every year, this would be the annual discount rate. If these are quarterly, this would be quarterly discount rate
- value1, value2… – these are the cashflow values and could be positive (inflow/income) or negative (outflow/payment).
- dates – these are the dates for each cashflow
One important thing to remember when using the XNPV formula in Excel is that the first date is considered as the beginning of the time period.
Suppose you have a dataset as shown below and you want to calculate the net present value for this data:

Below is the formula that will give us the net present value:
=XNPV(D2,B2:B7,A2:A7)

In the above example, the formula considers the first transaction (outflow of $100,000 on 01-01-2021) as the starting point and then calculates the overall net present value.
So in cases where you have cash flows/investments happening at irregular time intervals, you should use the XNPV formula.
NPV vs IRR – Which One Should you Use?
When analyzing project and investment decisions, NPV and IRR are the two most used methods.
Where NPV is Net Present Value and IRR is Internal Rate of Return.
While both the methods would give you similar results in most cases, NPV is considered a superior method when it comes to calculating the present value and viability of projects and investments.
IRR has a few shortcomings that make it less accurate, and in some cases, the NPV method and the IRR method will give you different results.
In case of different results, the NPV method is considered right.
In this tutorial, I have covered how to calculate net present values in Excel using NPV and XNPV methods.
In case you have evenly spaced-out cash flows, you can use the NPV method. And in case you have irregular cash flows then you can use the XNPV method (which also uses the dates of the cash flow for the calculation).
I hope you found this tutorial useful!
Other Excel tutorials you may also like:
- How to Calculate Average Annual Growth Rate (AAGR) in Excel
- How to Calculate Compound Interest in Excel + FREE Calculator
- How to Calculate Correlation Coefficient In Excel
- How to Calculate Standard Deviation In Excel
- Calculating Moving Average in Excel [Simple, Weighted, & Exponential]
- How to Calculate Compound Annual Growth Rate (CAGR) in Excel
Learn how Net Present Value works
What is the NPV Formula?
The NPV formula is a way of calculating the Net Present Value (NPV) of a series of cash flows based on a specified discount rate. The NPV formula can be very useful for financial analysis and financial modeling when determining the value of an investment (a company, a project, a cost-saving initiative, etc.).
Below is an illustration of the NPV formula for a single cash flow.
Screenshot of CFI’s Corporate Finance 101 Course.
NPV for a Series of Cash Flows
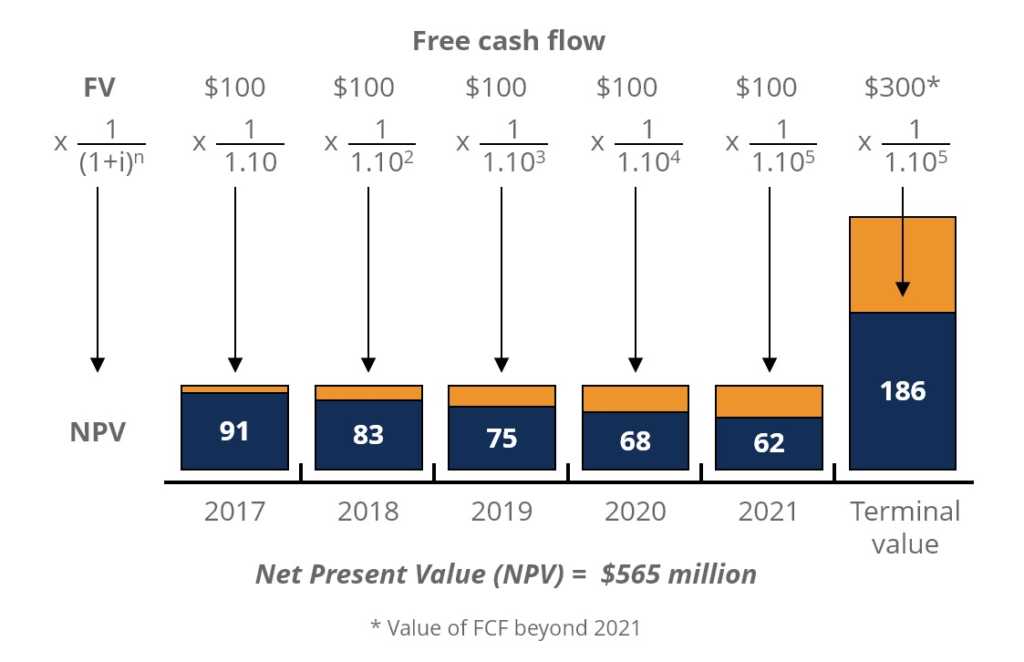
In most cases, a financial analyst needs to calculate the net present value of a series of cash flows, not just one individual cash flow. The formula works in the same way, however, each cash flow has to be discounted individually, and then all of them are added together.
Here is an illustration of a series of cash flows being discounted:
Source: CFI’s Free Corporate Finance Course.
What is the Math Behind the NPV Formula?
Here is the mathematical formula for calculating the present value of an individual cash flow.
NPV = F / [ (1 + i)^n ]
Where,
PV = Present Value
F = Future payment (cash flow)
i = Discount rate (or interest rate)
n = the number of periods in the future the cash flow is
How to Use the NPV Formula in Excel
Most financial analysts never calculate the net present value by hand nor with a calculator, instead, they use Excel.
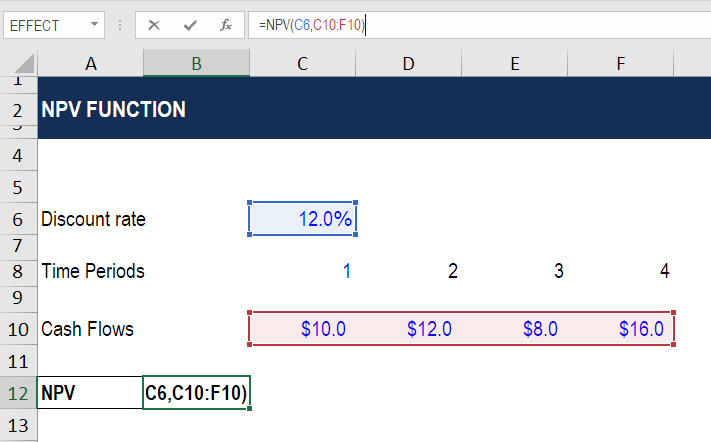
=NPV(discount rate, series of cash flow)
(See screenshots below)
Example of how to use the NPV function:
Step 1: Set a discount rate in a cell.
Step 2: Establish a series of cash flows (must be in consecutive cells).
Step 3: Type “=NPV(“ and select the discount rate “,” then select the cash flow cells and “)”.
Congratulations, you have now calculated net present value in Excel!
Download the free template.
Source: CFI’s Free Excel Crash Course.
If you need to be very precise in your calculation, it’s highly recommended to use XNPV instead of the regular function.
To find out why, read CFI’s guide to XNPV vs NPV in Excel.
Video Explanation of the NPV Formula
Below is a short video explanation of how the formula works, including a detailed example with an illustration of how future cash flows become discounted back to the present.
DCF Modeling
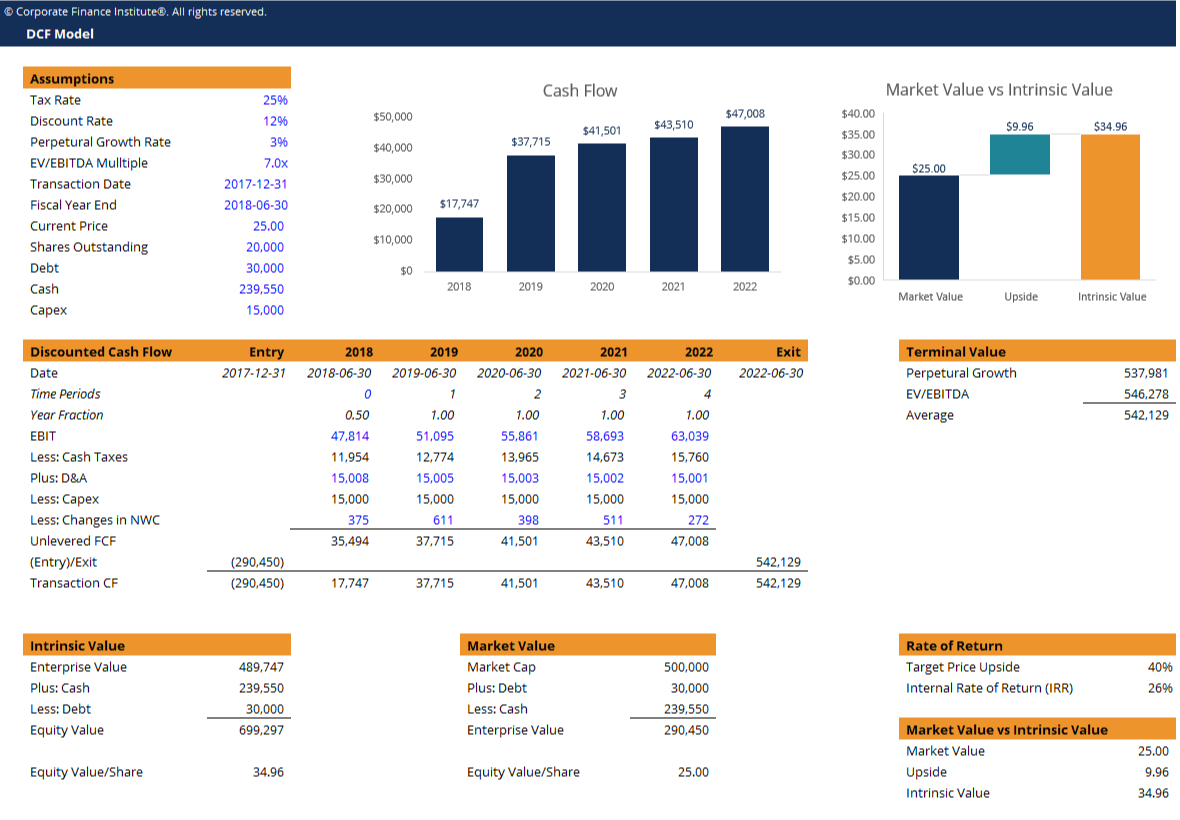
The main use of the NPV formula is in Discounted Cash Flow (DCF) modeling in Excel. In DCF models an analyst will forecast a company’s three financial statements into the future and calculate the company’s Free Cash Flow to the Firm (FCFF). Additionally, a terminal value is calculated at the end of the forecast period. Each of the cash flows in the forecast and terminal value are then discounted back to the present using a hurdle rate of the firm’s weighted average cost of capital (WACC).
Below is an example of a DCF model from one of CFI’s financial modeling courses.
Screenshot: CFI financial modeling courses.
Содержание
- Расчет чистого дисконтированного дохода
- Пример вычисления NPV
- Вопросы и ответы
Каждый человек, который серьезно занимался финансовой деятельностью или профессиональным инвестированием, сталкивался с таким показателем, как чистый дисконтированный доход или NPV. Этот показатель отражает инвестиционную эффективность изучаемого проекта. В программе Excel имеются инструменты, которые помогают рассчитать это значение. Давайте выясним, как их можно использовать на практике.
Расчет чистого дисконтированного дохода
Показатель чистого дисконтированного дохода (ЧДД) по-английски называется Net present value, поэтому общепринято сокращенно его называть NPV. Существует ещё альтернативное его наименование – Чистая приведенная стоимость.
NPV определяет сумму приведенных к нынешнему дню дисконтированных значений платежей, которые являются разностью между притоками и оттоками. Если говорить простым языком, то данный показатель определяет, какую сумму прибыли планирует получить инвестор за вычетом всех оттоков после того, как окупится первоначальный вклад.
В программе Excel имеется функция, которая специально предназначена для вычисления NPV. Она относится к финансовой категории операторов и называется ЧПС. Синтаксис у этой функции следующий:
=ЧПС(ставка;значение1;значение2;…)
Аргумент «Ставка» представляет собой установленную величину ставки дисконтирования на один период.
Аргумент «Значение» указывает величину выплат или поступлений. В первом случае он имеет отрицательный знак, а во втором – положительный. Данного вида аргументов в функции может быть от 1 до 254. Они могут выступать, как в виде чисел, так и представлять собой ссылки на ячейки, в которых эти числа содержатся, впрочем, как и аргумент «Ставка».
Проблема состоит в том, что функция хотя и называется ЧПС, но расчет NPV она проводит не совсем корректно. Связано это с тем, что она не учитывает первоначальную инвестицию, которая по правилам относится не к текущему, а к нулевому периоду. Поэтому в Экселе формулу вычисления NPV правильнее было бы записать так:
=Первоначальная_инвестиция+ ЧПС(ставка;значение1;значение2;…)
Естественно, первоначальная инвестиция, как и любой вид вложения, будет со знаком «-».
Пример вычисления NPV
Давайте рассмотрим применение данной функции для определения величины NPV на конкретном примере.
- Выделяем ячейку, в которой будет выведен результат расчета NPV. Кликаем по значку «Вставить функцию», размещенному около строки формул.
- Запускается окошко Мастера функций. Переходим в категорию «Финансовые» или «Полный алфавитный перечень». Выбираем в нем запись «ЧПС» и жмем на кнопку «OK».
- После этого будет открыто окно аргументов данного оператора. Оно имеет число полей равное количеству аргументов функции. Обязательными для заполнения является поле «Ставка» и хотя бы одно из полей «Значение».
В поле «Ставка» нужно указать текущую ставку дисконтирования. Её величину можно вбить вручную, но в нашем случае её значение размещается в ячейке на листе, поэтому указываем адрес этой ячейки.
В поле «Значение1» нужно указать координаты диапазона, содержащего фактические и предполагаемые в будущем денежные потоки, исключая первоначальный платеж. Это тоже можно сделать вручную, но гораздо проще установить курсор в соответствующее поле и с зажатой левой кнопкой мыши выделить соответствующий диапазон на листе.
Так как в нашем случае денежные потоки размещены на листе цельным массивом, то вносить данные в остальные поля не нужно. Просто жмем на кнопку «OK».
- Расчет функции отобразился в ячейке, которую мы выделили в первом пункте инструкции. Но, как мы помним, у нас неучтенной осталась первоначальная инвестиция. Для того, чтобы завершить расчет NPV, выделяем ячейку, содержащую функцию ЧПС. В строке формул появляется её значение.
- После символа «=» дописываем сумму первоначального платежа со знаком «-», а после неё ставим знак «+», который должен находиться перед оператором ЧПС.
Можно также вместо числа указать адрес ячейки на листе, в которой содержится первоначальный взнос.
- Для того чтобы совершить расчет и вывести результат в ячейку, жмем на кнопку Enter.
Результат выведен и в нашем случае чистый дисконтированный доход равен 41160,77 рублей. Именно эту сумму инвестор после вычета всех вложений, а также с учетом дисконтной ставки, может рассчитывать получить в виде прибыли. Теперь, зная данный показатель, он может решать, стоит ему вкладывать деньги в проект или нет.
Урок: Финансовые функции в Excel
Как видим, при наличии всех входящих данных, выполнить расчет NPV при помощи инструментов Эксель довольно просто. Единственное неудобство составляет то, что функция, предназначенная для решения данной задачи, не учитывает первоначальный платеж. Но и эту проблему решить несложно, просто подставив соответствующее значение в итоговый расчет.
NPV calculates the net present value (NPV) of an investment using a discount rate and a series of future cash flows. The discount rate is the rate for one period, assumed to be annual. NPV in Excel is a bit tricky, because of how the function is implemented. Although NPV carries the idea of «net», as in the present value of future cash flows less initial cost, NPV is really just the present value of uneven cash flows.
As Timothy R. Mayes, author of Financial Analysis with Microsoft Excel, says on his website TVMCalcs.com:
Net present value is defined as the present value of the expected future cash flows less the initial cost of the investment…the NPV function in spreadsheets doesn’t really calculate NPV. Instead, despite the word «net,» the NPV function is really just a present value of an uneven cash flow function.
One simple approach is to exclude the initial investment from the values argument and instead subtract the amount outside the NPV function.
In the example shown, the formula in F6 is:
=NPV(F4,C6:C10)+C5
Note the initial investment in C5 is not included as a value, and is instead added to the result of NPV (since the number is negative).
Notes
- values must be equally spaced in time and occur at the end of each period.
- values must be in chronological order.


