
Облако тегов или облако слов — популярный способ визуализации текста с помощью наиболее частотных в нем слов.
Столкнулась с тем, что большинство обзоров уже устарели, поэтому предлагаю свой ТОП-5 лучших бесплатных сервисов, с помощью которых можно создать облако слов онлайн. Для чистоты эксперимента тестировать будем на одном и том же тексте по журналистике.
Этот сервис умнее всего анализирует текст: он позволяет создать облако частотных слов текста, при этом приводя все слова к начальной форме. Это значит, вы не получите, например, в облаке кот, коту, кота и т.д., а посчитаются сразу все формы слова кот. Полученный набор слов можно настроить, например, убрать фамилии или цифры. Красивые цветовые палитры, минимум функций, отсутствие регистрации. Кроме русского поддерживаются другие языки. Главный минус — отсутствие более сложных форм облака.
Огромный плюс этого простого сервиса — настройка формы облака и возможность задать любой цвет. Из минусов — отсутствие нормализации текста и стоп-слов, из-за этого могут вылезать ненужности типа огромных местоимений и предлогов, а также отсутсвие возможности задать цветовую палитру, потому что в одном и том же оттенке облако смотрится скучновато.
Международный бесплатный сервис, много трафаретов и возможностей кастомизации шрифтов, цветов. Приятные палитры и стили. Из минусов — тоже не хватает приведения слов к начальной форме, далеко не все шрифты красивы для русского языка.
Обязательная регистрация и плата за базовые функции типа изменения цвета — сразу жирный минус. С другой стороны, встроенные трафареты и палитры неплохие. Возможности выбирать слова из текста я не нашла, поэтому довольно долго колдовала с разными формами, чтобы местоимения и особенно слово «это» не были такими огромными.
Старый добрый WordArt (в прошлом Тагул). Изменять можно вообще все: шрифт и размер каждого слова, формы, цвета, вообще все. Но готовьтесь к долгому и кропотливому труду в англоязычном и абсолютно не интуитивном интерфейсе. Главные плюсы: собственно обилие функций. Минусы — обязательная регистрация, если хочешь скачать результат, и на мой вкус устаревшие трафареты, как из 2000х.
Итоги: первые два сервсиса я бы однозначно рекомендовала для быстрой и симпатичной визуализации текста, например для занятий или презентации. Остальные сервисы с более сложным интерфейсом и обилием функций стоит рассмотреть, если вы создаете облако слов более основательно, например, для постера или кружки.
They say that a picture is worth a thousand words.
Guess what?
A Word Cloud Chart with a hundred words is enough. We’re sure you’ve seen these charts everywhere, including the business settings. A Word Cloud is a form of visualization for textual data. You only need texts to create this chart.


This blog will show some examples about how to create a Word Cloud. So keep reading to avoid missing valuable tips.
A picture is worth a thousand words. But when that image consists of a hundred or so words, it becomes super-effective. You can use Word Cloud visualizations to create a compelling data story for your audience. And this is because they are amazingly easy to read and understand.
You can use a Word Cloud Chart to visualize all sorts of data, from customer and employee surveys to keyword analysis.
In this blog, we’ve rounded up valuable tips and strategies you can use to create easy-to-read Word Cloud Charts for your data story. Besides, you’ll also uncover how you can leverage this visualization to stay ahead of your competitors. We will discuss following things in this blog:
- What is a Word Cloud Chart?
- How to Create a Word Cloud Chart? Step by Step Guide with Example
- What are the Uses of a Word Cloud?
- Why Create a Word Cloud?
- What is the Best Word Cloud Generator?
- How to Install ChartExpo In Google Sheets To Access the Word Cloud Chart For Free
- Practical uses of Word Cloud Chart
- What are the Benefits of Using Word Cloud Chart?
These tips and strategies are tested and proven by thousands of seasoned data visualization experts across the world.
So you won’t be wasting your valuable time reading this blog in its entirety.
What is a Word Cloud Chart?
Definition: A Word Cloud also known as tag clouds or text clouds, is a cluster of words in different sizes, colors, and orientations.
So how can you read this chart?
The more often a word occurs in the source text, the larger and more important the word appears. You can use Word Cloud images in multiple scenarios. For instance, if you’re a content writer, you need to create a Word Cloud to identify the search terms overused by competition to bump your SEO rankings.

This visualization chart breaks down bulky text data into high-level insights. Essentially, the larger a word’s size in the cloud, the more regularly it is used.
A Word Cloud Chart is a proven visualization that can engage, educate, and quickly capture your audience’s attention. Besides, it can empower audiences to assess swiftly which text is the most popular.
One of the most appealing characteristics of Word Cloud Chart is that they provide insights effortlessly from a large amount of data. So you don’t have to waste your time counting or poring textual notes for answers.
Now that you’re familiar with the Word Cloud: let’s check out its benefits. Why does this visualization matter to you?
How to Create a Word Cloud Chart? Step by Step Guide with Example
Examples are the best way to learn about ways to create a chart. Following Word Cloud example will help you learn how to create this chart in few clicks without any coding.
Let’s assume you’ve hired a transcriber to decode the audio interviews into a written narrative. Let’s use the tabular data below for our scenario.
The count is the frequency a particular word was mentioned by the hotel guests in a particular context.
| Tag | Count |
| Staff | 1240 |
| Restaurant | 576 |
| Well | 1133 |
| Crowded | 571 |
| Comfortable | 756 |
| Information | 897 |
| Carpets | 1052 |
| Distance | 1254 |
| Reception | 859 |
| Clean | 377 |
| Unfriendly | 493 |
| Wi-Fi | 1769 |
| Parking | 984 |
| best | 426 |
| Dirty | 1055 |
| Line | 718 |
| Polite | 545 |
| Hall | 1163 |
| Responding | 775 |
| Bars | 1296 |
| Grand | 819 |
| Recipe | 648 |
| Cafe | 602 |
| Kitchen | 1045 |
| Party | 784 |
| Eating | 2060 |
| Plate | 1193 |
| Modern | 733 |
| Flower | 399 |
| Lifestyle | 840 |
| Knife | 1952 |
| Chef | 1722 |
| Shop | 1877 |
| Gourmet | 1070 |
| Occupation | 271 |
| Traditional | 1360 |
| Romance | 679 |
| Menu | 196 |
| Chair | 498 |
| Interior | 1616 |
| Dish | 1583 |
| Furniture | 2116 |
| Crystal | 1688 |
| Lunch | 380 |
| Meal | 1216 |
| Luxury | 83 |
| Drink | 1719 |
| Grinder | 1393 |
| Table | 1615 |
| Romantic | 282 |
| Decoration | 2055 |
| Seafood | 592 |
| Decoration | 589 |
| Vacation | 1534 |
| Glass | 1981 |
| Business | 474 |
| Wine | 812 |
| Customer | 1117 |
| Light | 1633 |
| Cocktail | 863 |
| Beautiful | 773 |
| Sitting | 1139 |
| Order | 915 |
| Dinning | 458 |
| Dinner | 518 |
| Food | 986 |
| Cutlery | 2230 |
| Fork | 1091 |
| Eat | 815 |
| Coffee | 717 |
| Set | 1921 |
| Couple | 2063 |
| Elegant | 109 |
| Dating | 1055 |
Now prepare the data in the sheet and select Word Cloud Chart from the list.

- Now Select Sheet Name (sheet holding your data).
- Click Add new metric and select the column with a numerical value (Count).
- Click Add New Dimension button and select the column with textual data (Tag)
- Click on Create Chart
Check out the resulting Word Cloud Chart.

Insights
-
- The issue of hygiene should be dealt with to avoid customer churning. You need to figure out to know why customers are using the words Dirty and Carpets to describe the poor hygiene levels of the hotel brand.

-
- Parking problems need to be sorted out by hiring more valets to ease congestion and reduce waiting times of the guests.

- The reception and staff professionalism of the hotel seems to satisfy the hotel guests. Besides, guests find the employees informational. There’s a need to build on this strength further.

There seem to be feedback about Cutlery and Decoration of the hall, which might be positive and liked by the guests.

What are the Uses of a Word Cloud?
Following are few uses of a word cloud.
-
Survey Results Visualization
You can use a Word Cloud Chart to visualize the recurring words from survey data. In other words, it’s one of the quickest ways of getting high-level insights from survey results.
For instance, you can use this chart to visualize the words that your target market uses to describe your brand. Recurring negative opinions and sentiments associated with your brand are a bad sign.
Besides, this is a cue that you need to take action before things get out of hand.
Next time you’re conducting a survey to create a data story, use a Word Cloud Chart. You’ll be surprised by the high-level insights you’ll uncover using this cutting-edge visualization.
-
Competitor Keyword Research
One of the smartest ways of using a Word Cloud is spying on the SEO game of your competitors. All you need is to copy all the textual information from their websites and visualize it using a Word Cloud Chart.
Ideally, the most recurring words are the keywords you should consider depending on their performance.
If keywords already work for your rivals, why don’t you leverage them as well?
There are tools with a Word Cloud chart that’s designed to separate noise from your data, such as emojis, punctuations, etc. Next time you think of conducting surveillance on your close competition’s search engine optimization (SEO) game, use a Word Cloud.
-
Content Creation
Every content writer has words they like to use repeatedly.
When you edit your words, it’s immensely difficult to see terms you’ve used repeatedly. Remember, overusing certain words can cause your whole content to sound redundant.
This is where a Word Cloud Chart comes in to help you identify the redundant words in your content. This chart shows you the most overused words by highlighting them by size and color. It’s incredibly easy to spot recurring words in your content without wasting time or breaking a sweat.
Do you have too many dialogue tags in your writing?
If so, the term “said” will show up as a larger word. Do your personas smirk or shrug all the time? A Word Cloud Chart can help you find the actions you repeat too often.
Use this chart to ensure you’re focusing on the right characters, themes, and plot points.
For instance, if your content is about Jane, but Jack’s name is three times bigger, you might need to re-evaluate everything. If you’re curating content about war, but the words “war” and “battle” are tiny on your Word Cloud: you’ll need to develop that plot more.
The Word Cloud Chart has a special place for copywriters and bloggers. Why?
Search engine optimization (SEO) is really a bane of copywriters and bloggers everywhere. And this is because algorithms are constantly changing. But with a Word Cloud Chart, SEO doesn’t have to be a mystery. Remember, the most essential part of SEO is keywords.
Yes, the words people input in search engines when they want to sort out a need or want. Run your copy or blog post through a Word Cloud tool.
Are your target keywords huge or tiny?
What words have you inadvertently turned into SEO keywords? This chart can help you figure out precisely what edits you need to make to bump up your search engine rankings and resonate more with the target market.
Bonus! You can use a Word Cloud Chart generator to preview how your content appears to Google crawlers. While it won’t reveal the more technical elements of SEO, such as headers, backlinks, and alt tags, it does help you see the general message that your page conveys.
This is important because when Google “looks” at your page, it does so by scanning its content and code. You might think you’re getting the right points across.
But do your keywords really dominate?
The Word Cloud Chart can reveal if you’re giving enough attention to the keywords that matter.
-
Employee Sentiment
When you ask employees to share their feedback and opinions about the workplace, what do you do with those responses?
Remember, it’s difficult to turn this kind of unstructured data into meaningful action if you don’t know where to start.
This is where the Word Cloud Chart comes in.
If you can see which points your employees are discussing frequently, you can make valuable and meaningful changes that can:
- Boost morale
- Strengthen company culture
- Improve performance
-
Spotting Technical Jargons
How can you present highly technical researching findings to a non-technical audience, such as a board of directors?
You guessed right.
You should use a data story that’s free of technical jargon. How can you spot and remove jargon from your data story or presentation? Use a Word Cloud chart to separate jargon words that may confuse your audience and render your data narrative ineffective.
Why Create a Word Cloud?
Data visualizations (like charts, graphs, infographics, and more) give you a valuable medium to communicate important information at a glance.
But what if your raw data is text-based?
If you want a stunning visualization format to highlight significant textual data points, use a Word Cloud Chart. It can make dull data sizzle and immediately convey crucial insights.
If you’ve stared blankly at lengthy data or long pages of text, you can relate.
With so many insights to comprehend, how do you know where to begin?
Word Cloud Chart can help simplify this process. If you’ve ever looked at a jumble of disparate words that seem to not correlate until you investigate further: You know the benefit of this chart.
Let’s check out how you can best deploy this visualization to uncover in-depth insights from your data.
-
Uncover Patterns in Textual Data
Charts, graphs, and other data visualizations can help you identify key patterns. However, pulling these same insights from qualitative data can prove cumbersome at best and impossible at worst.
A Word Cloud generator makes this process easy peasy. The words you see overpowering the others in this chart are your salient points and overlapping themes.
-
Supercharge your Content Creation Strategy
This chart can help you spot redundant words that spoil the flow and impact of your writing. Besides, you can easily know whether your content is aligned with your target themes, topics, and most importantly, relevant keywords.
-
Uncover Your Target market’s Pain Points with Ease
Word Cloud Charts can help you find your customers’ pain points. If you collect feedback from your customers, generate a Word Cloud using their language to identify what matters the most to them.
For instance, if “long wait time” is highlighted by a Word Cloud, then this is your target market’s pain.
-
Eliminate Jargon in Your Texts for Smooth and Engaging Communication
If you’re a business-to-consumer content marketer, this chart can help you fine-tune your sales messages by highlighting technical jargon. Use this chart to ensure your language is accessible, understandable, and resonates with your target market.
Essentially, if you want visualization that lends clarity to your data story effortlessly, use the Word Cloud Chart.
So far, you’ve learned about Word Cloud, its application, and most importantly, why you should use it for your data story.
Now let’s head to the practical part of the blog: the actual tools for generating this chart.
What is the Best Word Cloud Generator?
Let’s talk about Google Sheets because it’s one of the most used tools for data analysis and visualizing data besides Excel.
This spreadsheet app is top-rated because it’s easy to use. Besides, it has been there for years, making it familiar to almost anyone who works with data.
So how can you use Google Sheets to create Word Cloud Charts that are easy to read and interpret?
Remember, for a data story to be compelling to your target audience, it should have charts that lend clarity. You don’t want critical insights to be obscured by unnecessary stuff, such as heavy colors.
Well, Google Sheets has no templates for Word Cloud. We understand that this is very disappointing, but it’s the reality. So if you have bulks of textual information from a survey or a rival’s blog, Google Sheets is not the go-to tool.
So What’s The Solution?
The solution is not to ditch Google Sheets. No, we’re not advocating you to do away with the spreadsheet tool you’ve known for years.
You just need to supercharge it with an add-on to make it a reliable partner for data visualization.
Google knew very well it’s impossible to cater to all the data visualization needs you may have. And that’s why they came up with a store where you can access third-party add-ons to get various specialized tasks done with ease.
Well, there’s a reliable and incredibly easy-to-use add-on called ChartExpo. And it comes jam-packed with Word Cloud templates and other cutting-edge 50-plus charts.


What is ChartExpo?
The ChartExpo is a cloud-hosted add-on that transforms your Google Sheets into a highly responsive data visualization tool.
Wait! That’s not all.
This highly affordable data visualization tool comes with over 50 chart templates to grant you a broader choice of visuals to select. With ChartExpo, you don’t need to know programming or coding. Yes, it’s that easy peasy to use.
So when you’re curating a data story, feel confident you have a reliable data visualization buddy on your side. ChartExpo provides you unlimited freedom to customize your Word Cloud diagram.
Remember, you can highlight the key insights you want your audience to take in with ease. You just need a few mouse clicks to access a Word Cloud Chart that fits seamlessly within your data narrative.
Let’s head to the meaty part of the blog: the section where you get to practice what you’ve learned. Follow the simple steps below in preparation for the next section.
How to Install ChartExpo In Google Sheets To Access the Word Cloud Chart For Free
You need to install ChartExpo for Google Sheets Add-on.

Then follow the simple and easy steps below.
-
- Open your Google Sheets desktop application.
- Open the worksheet and click on the ‘Add-ons’ menu.
- You’ll see the ‘ChartExpo’ option in the dropdown menu.
- Click on ‘ChartExpo’ to install your Add-on.

-
- If you don’t, please click on the ‘Refresh’ button.
- Again select ChartExpo add-on and click on the ‘Insert’ button
- The add-on will be added to the Google Sheets application, as shown in the screenshot below.

-
- You’ll see an extensive library of visual charts categorized into 6 different groups.
- Click the PPC Charts Tab, as shown below.

- After clicking on the PPC Charts tab, you’ll see all the charts and Word Cloud Chart is one of them.
Practical uses of Word Cloud Chart
Imagine you’ve just conducted a survey for a hotel brand.
You’ve conducted personal interviews and recorded opinions from hotel guests regarding brand perception in various key areas, namely:
- Employees
- Restaurant
- Customer service
- Bars
- Hygiene
- Hotel facilities
- The general atmosphere, etc.
What are the Benefits of Using Word Cloud Chart?
ChartExpo (add-on for Google Sheets) is an interactive Word Cloud generator designed to ensure the most repeated keywords stand out without much highlighting using colors. Unlike other tools, you don’t need to code using python to access Word Cloud Charts that are easy to read and interpret.
Besides, this easy-to-use Word Cloud template automatically detects the collocations (words that often go together) in sentences, paragraphs, and documents, to offer you more context than other Word Cloud tools.
Guess what?
You have total freedom to customize and edit your Word Cloud Chart to align with your data story. Yes, you heard that right. More so, you can customize fonts, layouts, and color.
Lastly, it has a super-cool interface to help you discover the most frequent and profitable keywords your competition is hoarding.
Wait! There’s more for you.
We’ve only covered about one chart (Word Cloud) in ChartExpo. Well, the ChartExpo add-on is a visualization juggernaut you can rely on to create compelling data stories for your audiences.
So what are the benefits of ChartExpo besides being a Word Cloud Generator for seasoned data experts?
ChartExpo comes with an incredibly user-friendly interface to ensure you don’t have to waste time visualizing complex data. Besides, the cost of accessing over 50-plus chart templates is only $10 a month. And this is not to mention a 7-days FREE trial you get once you sign up.
Note, you’re not installing anything on your computer. So you don’t have to worry about viruses and malware because Google Sheets is cloud-hosted.
- ChartExpo add-on for Google Sheets comes with a free 7-days trial.
- So if you’re not satisfied with the tool within a week, you can opt-out as quickly as signing up for a trial.
- ChartExpo add-on is ONLY $10 a month after the end of the trial period.
- You have a 100% guarantee that your computer or Google Sheets won’t be slowed down.
- You can export your insightful, easy-to-read, and intuitive charts in JPEG and PNG, the world’s most-used formats for sharing images.
FAQs:
How do you explain word clouds?
Word clouds (also known as text clouds) work in a simple way: the more a specific word appears in a source of textual data (such as a speech, blog post, or database), the bigger and bolder it appears in the word cloud. A word cloud is a group, or cluster, of words depicted in different sizes.
What is word cloud good for?
Word cloud presents a low-cost alternative for analyzing text from any source e.g. surveys, plus it’s much faster than coding. Essentially, word clouds work by breaking the text down into component words and counting how often they appear in the body of text.
How do you visualize text analysis?
The simplest and most familiar form of text visualization is a word cloud. They depict tags arranged in space varied in size, color, and position based on the frequency, categorization, or importance. Font size is the important thing to consider as it mentions the frequency or value of the word.
Wrap Up
It’s crystal clear that the Word Cloud Charts are among the best visualizations to use for your data story. And this is because they are easy to read and interpret.
Essentially, if you use these charts in your data narrative, your audience will find them easy to read and interpret.
This you might have got the idea by having example of how to create a Word Cloud.
If you have textual data and want quick and high-level insights without wasting time, use ChartExpo library for creating Word or Word Cloud.
Posted on: Oct, 2021
By: Judd Albrecht
Get Started Creating Word Clouds
This video explains how to customize a word cloud using our word cloud generator. After watching this tutorial on how to create word clouds, you will be ready to dive in and start building your personalized word cloud art.
ADVANCED TUTORIAL
How to Combine Your Created Word Clouds with Customizable Graphics.
This wordcloud tutorial video shows a powerful technique for taking the word cloud you create from our online wordcloud generator and adding them to our customizable graphics. The result of doing this will give you a new spin on creating word clouds that your viewers will love.
After you make a word cloud, open a customizable graphic in the online customizer app, then load the word art you made into the custom graphic word area. Once in place, click build custom graphic, and it will output the custom graphic with your word cloud embedded in it.
How to Create a Word Cloud from Scratch.
Starting from scratch is another option as you begin to create a word cloud. There will be no design loaded in when you open the word cloud creator and start from scratch. At first, this can seem a little overwhelming as you think; where do I begin. No worries, check out this quick video tutorial below to see how you can quickly start creating a design scratch.
Add your word clouds to PowerPoint slides.
So what do you do once you have your word cloud created? Well, if you are using presentation software like PowerPoint, Google Slides, Keynote, or Prezi, you can easily insert it into your slides as an image. Using our animated PowerPoint templates is a great way to call attention to essential points or concepts in the presentation you create.
Have fun, be creative, and start creating some awesome word cloud art.


By: Judd Albrecht
Judd enjoys anything creative. As a content designer at PresenterMedia, he gets to put that creative desire to use everyday. «Every day I’m excited to come into work and start creating great content for our subscribers». He has degree in computer animation with over 15 years of graphic design experience, which has given him the skills to design quality graphic content. When he’s not at work, he finds time enjoying the great outdoors, jamming on the bass guitar and playing with his kids.
Download PC Repair Tool to quickly find & fix Windows errors automatically
Microsoft Word is not only useful for typing or editing, but it can also be used for photo editing too. It might not be as advanced as Photoshop and other advanced photo editing programs, but it can create posters, brochures, greeting cards, and Word Clouds. A Word Cloud is a cluster of words portrayed in different sizes. It is also known as a text cloud or tag cloud. The bigger the word is, the more it is important. Word Cloud is used in textual data such as Blog posts, speeches, databases, interviews, and other texts. In this tutorial, we will explain how to create a Word Cloud in Microsoft Word.

Follow the steps below to create a Word Cloud in Microsoft Excel:
- Launch Microsoft Word.
- Go to the Insert tab and click Get Add-ins.
- In the search engine, type Word Cloud, then press Enter.
- Select the Pro Word Cloud option.
- Click Continue.
- Highlight the paragraph you have in your document.
- In the pane, you can customize the Font, Colors, Layout, and Cases.
- You can also select the Maximum Words, increase or decrease the size or remove common words by unchecking its check box.
- Then click Create Word Cloud.
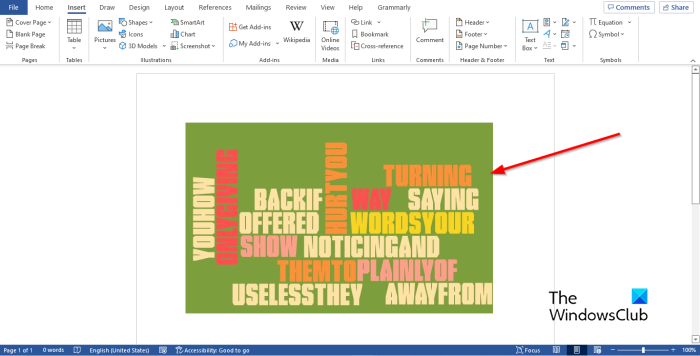
- Right-click the Word Cloud display in the Pro Word Cloud pane and select Copy image and paste it into the document and remove the original text.
Let’s see this in detail.
Launch Microsoft Word.
In your Word document, you can type a paragraph or copy a paragraph from a digital book or off the internet.
Go to the Insert tab and click Get Add-ins in the Add-ins group.
An Office Add-ins dialog box will open.
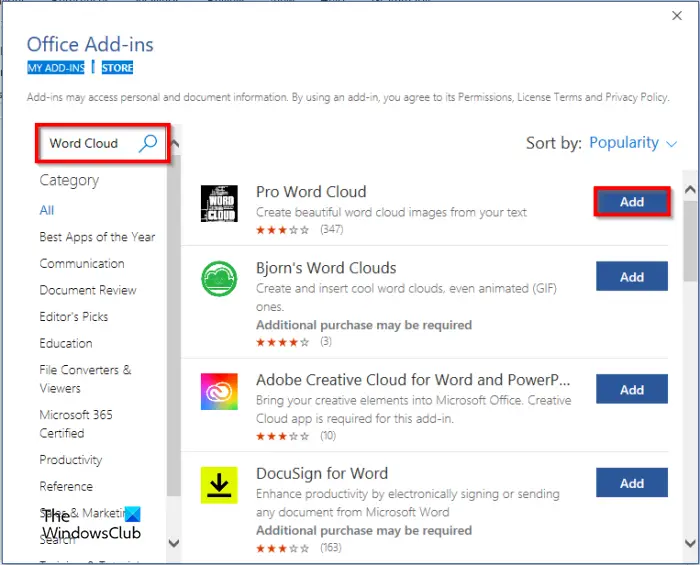
In the search engine, type Word Cloud, then press Enter.
A list of Word Cloud apps will pop up, choose Pro Word Cloud, and click the Add button.
A window will pop up displaying the License Term and Policy, then click Continue.
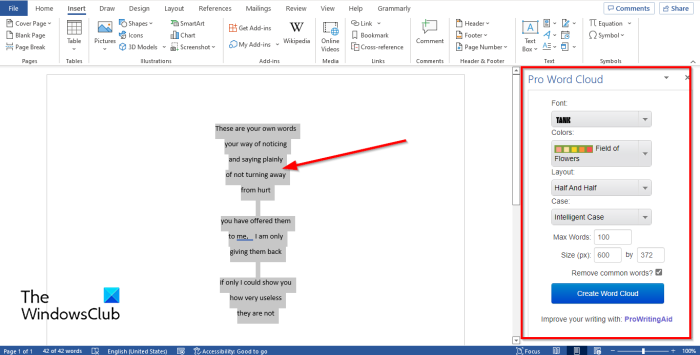
A Pro Word Cloud pane will appear on the right with some settings.
Highlight the paragraph you have in your document.
In the Pane, you can customize the Font, Colors, Layout, and Cases by clicking their drop-down arrows and selecting an option.
You can also change the Maximum Words, increase or decrease the Size or Remove common words by unchecking its check box, if desired.
Then select the Create Word Cloud button.
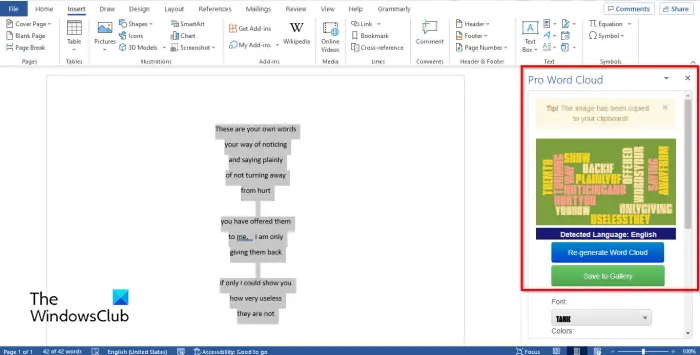
You will then see a display of the Word Cloud on the right; you can choose to Re-generate Word Cloud, it means to switch to a different display of the Word Cloud.
You can also choose to save your Word Cloud by clicking Save to Gallery if desired.
To add the Word Cloud to your document, right-click the Word Cloud display in the Pro Word Cloud pane and select Copy image and paste it into the document and remove the original text.
Close the Pro Word Cloud pane.
Now we have a Word Cloud in Microsoft Word.
We hope this tutorial helps you understand how to create Word Cloud in Microsoft Word.
READ: How to make Font blurry in Microsoft Word
Where can I create a Word Cloud?
You can create a Word Cloud using Microsoft Office, so you do not have to use some advanced programs. You can use Microsoft Word and PowerPoint, which can create some great Word Clouds by using the Word Cloud add-in apps offered by Microsoft.
READ: How to insert Text in Circle OR Circle Text in Microsoft Word
How do I make a Word Cloud for free?
Word Cloud is a cluster of words, and you can make one for free online. You can make Word Clouds on a website called wordclouds.com, where you can paste text and open a document or a URL to generate a Word.

Shantel has studied Data Operations, Records Management, and Computer Information Systems. She is quite proficient in using Office software. Her goal is to become a Database Administrator or a System Administrator.
Variety and novelty in English lessons encourage learners to be more engaged. On the contrary, monotonous tasks, no matter how useful they are, cause boredom. How to bring variety without too many changes in the process of learning vocabulary? Use word clouds.
Word clouds are a graphical representation of words and words combinations. They can be used for:
- vocabulary revision
- presenting lexis
- practicing new words
- student’s projects.
It is just a more visually appealing way to teach vocabulary. Instead of using lists, which students are probably fed up with, make clouds. You can utilize them for word searches, making monologues and dialogues, word games, writing tasks, etc.
Here are some examples of the tasks.
Task 1
Make a story about a detective investigating a case using all the words and tell your partner (the teacher).

Task 2
Work in pairs. Ask and answer five questions using the words.
Task 3
Give a definition of one of the words. Can your partner guess the word? Swap roles.
There are some services for creating word clouds:
Word Art
Wordle
Word clouds
I personally prefer to use Word art because it’s possible to create clouds containing collocations. As we know teaching collocations is more effective for learners. Other services just break the word pairs into single words.
Let’s see how to create word clouds using Word art. It’s quick and easy, no registration is required. So click ‘Create’ and make your cloud.
Step 1
Fill in the words or word combinations. You can type as many words as you need, even 30 or even 50. It’s possible to Capitalize letters, use the UPPER or lower case. Click ‘Options’ and opt for repetition of the words as you see in one of the pictures above or choose no repetition.

Step 2
Choose the shape of your cloud: animals, nature, people or some holidays themes. If you want to see the changes, click the red button ‘Visualize’.
For example, this charming ladybird will definitely catch kids’ interest.
 Step 3

Choose a font which you like. There are more than 50 fonts to select.
Step 4
Pick out a layout: horizontal, vertical, crossing words, dancing words, slopes and random. The layout will depend on the task and the learners. Teens prefer something less ordinal and more creative. For adults, I usually make more conservative things like a horizontal layout.
Step 5
Choose a style: colours of the words and the background. If you want to change a colour of the words, click ‘Words colours’ and ‘Custom’ and add more colours to the pallette.

Step 6
To apply all the changes, press ‘Print’ or ‘Download’ your cloud and enjoy it in your lessons.