
Use Excel to run your regression analysis
Updated on March 11, 2021
What to Know
- Calculate Variance: Type =VAR.S( in the cell where you want the variance to appear and enter the range of cells to include. Type ).
- Calculate Regression Analysis: Install Analysis TookPack Add-in. Go to the Data tab and select Data Analysis > Regression > OK.
- Enter the cell range with the Y variables in Input Y Range field. Enter the cell range of X variables in Input X Range. Select output location.
This article explains how to calculate Variance and run a Regression Analysis in Excel for Windows and Mac. It includes information on running a regression analysis in Excel Online. These variance functions work in Excel 2019, Excel 2016, and Excel 2010 on Windows; Excel 2016 and Excel 2011 on macOS; and Microsoft Excel on Android and iOS as well as Microsoft 365.
Calculate Sample or Population Variance
Excel provides functions to calculate variance and supports add-ins that enable regression analysis.
Variance indicates how widely a set of numbers diverges from the average of the numbers. When comparing variance calculations, the higher the variance, the more widely distributed are the numbers in a data set. A variance of 0, for example, indicates that all the numbers in the selected data set are the same. (Standard deviation is the square root of the variance and also measures how to spread out a data set is.) You can run a variance on any set of numbers in Excel.
-
In the cell where you want to calculate variance, type: =VAR.S(
The VAR.S function assumes that the data set is a sample, not the entire population.
-
Then enter the range of cells to include, such as B2:B11. (If you prefer, you may click or tap to select a cell range.)
-
Then type: )
The result displays in the cell. The equation should look something like: =VAR.S($B$2:$B$11)
If you are certain you are working with a complete population data set, you may alternatively use the VAR.P function. That would look like: =VAR.P($B$2:$B$11)
Run a Regression Analysis in Excel on Windows or macOS
Regression analysis helps you understand the relationship between variables. It provides analysis that mathematically identifies if and how one variable affects another in a statistically significant way. To run a regression in Excel, you need two sets of numbers, with one set that serves as the Y variable and the other as the X variable. Most often, these numbers are entered in two adjacent columns.
To run regressions on Windows or macOS systems, you need to install the Analysis ToolPak add-in for Excel. The ToolPak works on Excel 2007 or newer on Windows systems and on Excel 2016 or newer on macOS systems.
On recent versions of Microsoft Excel on Windows, type add-in in the search box in Excel and press enter. Then select the result with the gear to the left of the words Add-in that displays. (For other versions of Excel on Windows, select File > Options > Add-Ins. Then in the Manage box, choose Excel Add-ins and Go.) Next, select the check box next to Analysis ToolPak, then select OK.
On macOS versions of Excel, select Tools > Excel Add-ins. Then select the check box next to Analysis ToolPak, and choose OK.
For additional ways to install the Analysis ToolPak, follow Microsoft’s Load the Analysis ToolPak in Excel help page. Once installed, the ToolPak gives you access to data analysis tools.
-
Select the Data tab, then look for the Analysis area and select Data Analysis.
-
Select Regression from the list and then choose OK.
-
In the Input Y Range field, enter (or select) the range of cells that contain the Y variables. For example, this might be $B$2:$B$10.
-
In the Input X Range field, enter (or select) the range of cells that contain the X variables. For example, this might be $A$2:$A$10.
-
Optionally, select the box for Labels or make any other adjustments desired to the regression calculation options displayed.
-
In the Output options section, select the output location. Most often, you’ll want to choose the New Worksheet Ply: button, while also leaving the box unfilled.
-
Choose OK.
The regression results display in a new sheet.
Run a Regression Analysis in Excel Online
In a browser, including the Safari browser on an iPad, you can do a linear regression in Excel online with the help of an add-on.
-
Open the Excel spreadsheet with your data in a browser using Excel Online.
-
Choose Insert > Office Add-ins.
-
In the search box that displays, type “XLMiner Analysis ToolPak” and press enter.
-
Select Add on the XLMiner Analysis ToolPak screen to add several potential data tools on the right side of the screen.
-
Select Linear Regression in the XLMiner Analysis ToolPak menu.
-
In the Input Y Range field, enter (or select) the range of cells that contain the Y variables. For example, this might be B2:B11.
-
In the Input X Range field, enter (or select) the range of cells that contain the X variables. For example, this might be A2:A11.
-
Optionally, select the box for Labels or make any other adjustments desired to the regression calculation options displayed.
-
For Output Range, select a cell location far enough to the right or bottom of your sheet to ensure that it is outside the range of other data in your Excel document. For example, if all of your data is in columns A through C, you might enter F2 in the output range box.
-
Choose OK.
The regression results display in your Excel sheet, starting at the cell you selected.
Thanks for letting us know!
Get the Latest Tech News Delivered Every Day
Subscribe
Calculating variance allows you to determine the spread of numbers in a data set against the mean. This is a great tool for data analysts, who can use Excel to calculate the variance using functions like VAR.S and VAR.P. We’ll explain how to use variance functions in this step-by-step tutorial.
In mathematical terms, variance is the calculation of how far a set of values is from the average value (the mean). If the variance is zero, there isn’t any variety—all numbers are likely to be the same. As this number grows, the variance grows with it.
This has all kinds of uses for analysts, from determining the different ages in a group to working out the spread of returns in different investment portfolios. Excel allows you to calculate variance like this by using functions aimed at entire data sets (population variance) or a small subset of a larger group of data (sample variance).
This is an important distinction, as the way Excel calculates variance will differ depending on the size of your data set. If you’re working with a smaller sample, you’ll need to use VAR, VAR.S, or VARA functions to calculate variance. For population variance, you’ll need to use VARP, VAR.P, or VARPA instead.
While there are similarities between these functions, there are some important things to consider before you use them. In this article, we’ll explain:
- What are variance functions in Excel and what are they used for?
- How do variance functions work in Microsoft Excel?
- Things to consider before using variance functions in Excel
- How to calculate variance in Excel: A step by-step guide
How do variance functions work in Excel? To help you, let’s run through the basics.
1. What are variance functions in Excel and what are they used for?
Variance works by determining the spread of values against the mean. If you have a set of exam results for a group of students, you might end up with wildly different values in two separate exams, but with the same average. By determining the variance, you can determine how well the group performed as a whole.

You can calculate this spread (the variance) using Excel’s variance functions. As we’ve mentioned, there are two main forms of variance that you can calculate in Excel: population variance and sample variance. In this context, population is the entire set of data, rather than a sample (or smaller subset) of it.
To calculate these values, you can use one of six variance functions in Excel. For sample variance, you can use the VAR, VAR.S or VARA functions. VAR is the original function, while VAR.S is the newer replacement, offering some speed enhancements over the original.
VAR and VAR.S only support numerical values, but if you want to use text strings or logical tests for a sample set, you’ll need to use VARA instead.
For population variance, you’ll need to use the VARP, VAR.P or VARPA functions. As with the sample variance functions, VARP is the original, while VAR.P is the newer (and recommended) replacement, with both functions working only with numerical values. To work with text strings or logicals, use VARPA instead.
If you’re thinking that this sounds a lot like standard deviation, that’s because it (almost) is. Standard deviation calculates, on average, how far your values are from the mean. Variation is simply the standard deviation value squared, which gives you an idea of how far all of your numbers are spread from the average.
2. How do variance functions work in Excel?
As we’ve already mentioned, there are six variance functions that you can use in Excel, split into two categories to deal with either population or sample variation.
These are:
- VAR, VAR.S or VARA for sample variance, and
- VARP, VAR.P or VARPA for population variance.
Of these six, two functions (VAR and VARP) are considered outdated, having been replaced with VAR.S and VAR.P. These are interchangeable for the time being, but could be removed from Excel in the future.

Four of these functions (VAR, VARP, VAR.S and VAR.P)focus on numerical data. That means that, if you’re a budding data analyst trying to work out the variance from a set of numbers using either a sample of a data set or the entire data set, you’d want to use these functions.
Should your data be mixed, however, you’ll need to use VARA or VARPA instead. These functions support text, numbers, and logical values (TRUE, FALSE, 1 or 0).

By support, we mean that text strings and logical results are converted to the numerical equivalent, where a text string is counted as a 0 (or FALSE). Logical values are counted as their numerical equivalent (0 for FALSE or 1 for TRUE). This can have an impact on your overall results, so choose your functions carefully.
If you want to create a formula using any of these variance functions, you’ll need to use a set structure. The structure remains the same for each six functions:
- =VAR(value1,value2, …)
- =VAR.S(value1,value2, …)
- =VARP(value1,value2, …)
- =VAR.P(value1,value2, …)
- =VARA(value1,value2, …)
- =VARPA(value1,value2, **…)**

The only required argument in a variance formula using these functions is the reference to the data you use (value1). This can be referenced as a range of cells or as values directly (where value1 is your first value, value2 is your second value, etc).
Only one value (value1) is required for a variance function to work. For cell ranges, this is considered as a single value (value1) for the purpose of creating your formula.
3. Things to consider before using variance functions in Excel
There are plenty of considerations to make before you decide to calculate variance in Excel using these functions. In particular, you’ll need to consider:
- While VAR and VAR.S are technically interchangeable, VAR.S is the replacement Excel function for sample data sets and should be used in the first instance. Likewise, VAR.P should be used over VARP for population data sets as the newer function.
- VAR, VAR.S, VARP and VARP only support numerical values. Other values (text strings, logical values, etc.) are ignored and won’t count towards your result.
- If you want to count text or logical values as you calculate variance, you’ll need to use VARA (for samples) or VARPA (for population sets).
- You can use references to cell ranges (eg. =VAR.S(A1:D10)) in your variance formulas, or reference each value separately (eg. =VAR.S(1,2,3,4)).
- If you reference each value separately, you can use up to 254 different values. This is an Excel limitation and can’t be increased. If you require more, fill out your spreadsheet first, then use a reference to the cell range containing those cells instead.
- Only a single argument (value1) is required, which can contain a single value or a reference to a range of cells. However, to calculate variance from a single value is redundant, so you’ll need to use more arguments if you’re typing these into your formula directly.
- If you’re adding a text string as a value in a variance formula, you’ll need to reference it in another cell for the formula to work, as directly adding a text string as a value argument will cause a #VALUE error to appear.
If you have a small sample from a larger data set, you can use the VAR, VAR.S or VARA functions to calculate the variance. If you’re trying to calculate variance in Excel using the population data set (that is, the entire set of data, rather than the smaller sample), you can do this using VARP, VAR.P or VARPA instead.
For the purpose of this guide, references to VAR and VAR.S are interchangeable. We’ve used VAR.S, which is the newer and recommended function, but the older VAR can be used (for the time being) in older workbooks. If you can, however, use VAR.S.
Likewise, references to VARP and VAR.P are also interchangeable, but you should use VAR.P in the first instance. VARA and VARPA remain available for all Excel users, regardless of the version used.
Step 1: Select an empty cell
To insert a variance function into a new formula, start by opening the Excel workbook containing your data and selecting an empty cell. Alternatively, you can open a new workbook, making sure that the sheet containing your data remains open and minimized.
With the cell selected, press the formula bar at the bottom of the ribbon bar until you see the blinking cursor.

When the blinking cursor is visible, you’re ready to begin inserting your new formula.
Step 2: Insert your data set directly or using cell references
As we explained earlier, all variance functions in Excel use the same structure to create new formulas. To insert a new variance function using a sample data set (a smaller sample of a larger population set), start by typing =VAR.S( or =VARA( into the formula bar at the top.
If you’re working with a population data set (the entire data set), type =VAR.P( or =VARPA( instead.

With your formula opened, you’ll need to insert your data next. Most users will likely prefer to reference data elsewhere in your current workbook (or in a minimized workbook) using a cell range.
For instance, =VAR.S(C2:C10) or =VAR.P(C2:C20) completes the formula, using the numerical data in a cell range between cells C2 and C10 (for the sample set) or C2 and C20 (for the population set). Make sure to replace these references with your own.
If you’re working with data that contains numbers, text, and/or logical values, =VARA(C2:C10) or =VARPA(C2:C20) will work best. Rather than ignoring text or logical values (as VAR, VAR.S, VARP or VAR.P would), the values in a VARA or VARPA formula will count towards your overall result.
You could also reference each cell individually. For example =VARA(C2:C10) and =VARA(C2,C3,C4,C5,C6,C7,C8,C9,C10) will return the same result.
If you’re adding numerical values directly to your formula, you’ll need to add the values one by one. Each value needs to be separated using commas. For instance, =VAR.S(1,2,3,4,5,6) or =VAR.P(1,2,3,4,5,6,7,8,9,10) will give you the variance between the numbers 1 and 6 (or 1 and 10 for a population set) directly.

You can also do the same with VARA or VARPA. For example, =VARA(1,2,TRUE,3) would work, with the TRUE value counting as its numerical equivalent (1). Likewise, =VARPA(1,2,TRUE,3,4,10,8) would count these values in the same way, with TRUE counting as 1.
VARA and VARPA support text, but to use these, you’ll need to use a cell reference or cell range. For instance, =VARA(1,2,TRUE,D5,3,4,10,8) or =VARA(D2:D9) would work, where D5 contains text that counts as a FALSE value (0). If you try to add a text string directly, however, Excel will return a #VALUE error.

If you’ve added a reference to a cell range, make sure to close your formula with a closing parenthesis afterwards, then press enter to view the results (or click on another empty cell). For values added directly, place a closing parenthesis after the final value is inserted into your formula.
Final thoughts
By calculating the variance, you can learn a lot about the data you’re working with. This makes the life of a typical data analyst even easier, allowing you to prove theories and hypotheses using a single Excel formula. Variance functions are among the many Excel formulas that data analysts use on a regular basis to find results.
Excel makes mathematical functions like variance and standard deviation easier to handle, especially for beginners. There are also scripts on the internet that make it a little easier, such as this variance calculator—but it’s way more rewarding to learn how to calculate variance on your own!
If you’re new to the field and you want to learn more, try this free, five-day introductory data analytics course. And, if you’re keen to get to grips with more Excel formulas, check out the following:
- How to convert text to numbers in Excel
- How to use the SUMIF function in Excel
- How to use the VLOOKUP function in Excel

What is Variance?
We use the variance of data to estimate the range of future value in series. The variance tells how much data can vary from the mean of the data set. Variance is often referred to as error value. It is not the most trusted statistic and we don’t use it alone to predict future value.
If speaking mathematically, Variance is an average of squared difference of data points from the mean of the data. Variance is the squared value of standard deviation. Below are the two formulas of variance.
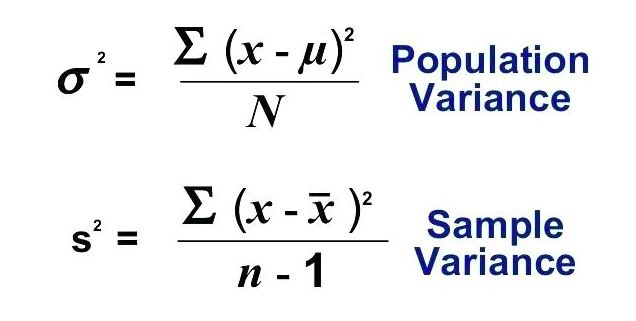
We won’t need to use these formulas to calculate variance in Excel. Excel has two formulas VAR.P and VAR.S to do so. If you just want to know how to calculate variance in Excel use the formulas as described below. If you want to know what is variance and when to use which variance formula, read the whole article.
How to find Variance in Excel?
Let’s take an example.
I launched my website in Jan 2019. Here I have data of new users joined in every month on my website. I want to know the variance of this data.
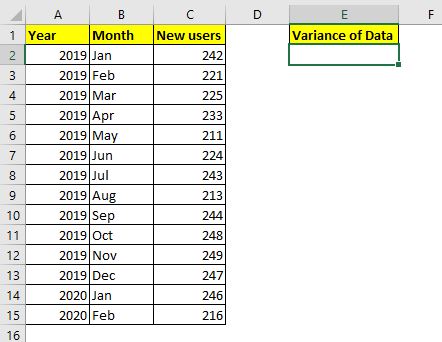
This is complete data. When we capture complete data (entire population) we calculate the variance of population (why? I’ll explain it later in the article). The Excel function for calculating Variance of population is VAR.P. The syntax of VAR.P is
=VAR.P(number1,[number2],…)
Number1, number2,…: these are the numbers of which you want to calculate variance.
The first number is compulsory.
Let’s use this formula to calculate the variance of our data. We have data in cell C2:C15. So the formula will be:
This returns a value 186.4285714, which is quite a large variance given our data.

Since my website was launched in from Jan 2019, I have all the data. Assuming I launched my website long ago but the data that I have is only from Jan 2019 to Feb 2020. I don’t have complete data. It is only a sample data then. In that case, I will not use VAR.P instead I will use the VAR.S function to calculate the Variance.
The VAR.S function returns a larger variance than VAR.P. It returns 200.7692308.
How Variance is Calculated Manually in Excel?
So yeah, this is how you calculate Variance in Excel. But how do these variance functions calculate these numbers? If you know it you can understand these numbers more and use it wisely. Otherwise these numbers are just random numbers. To understand it, we need to calculate the variance manually.
Calculate Variance of Population Manually in Excel
We will use the same data that we used in the above example. The mathematical formula for Variance of Population is:
To calculate variance we need to calculate mean (AVERAGE) of data, difference of each value from mean, sum them up and finally divide that sum with the total number of observations.
Step 1. Calculate Mean of Data
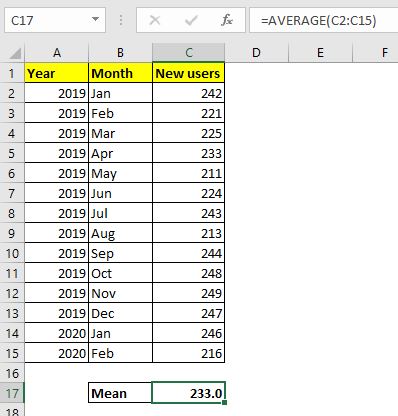
To calculate mean of data in Excel we use the AVERAGE function.
Use this formula in cell C17 (or wherever you like).
This returns 233.0.
Step 2: Find the difference of each data point from mean
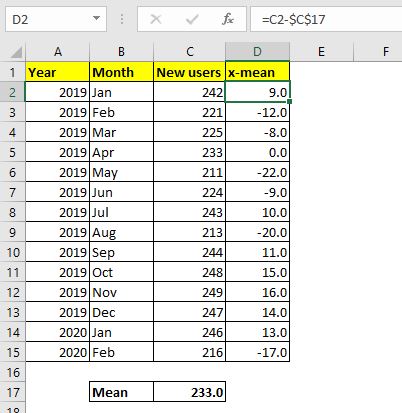
Now go to cell D2 and subtract mean (C17) from C2 (x). Use this formula in D2 and drag it down to D15.
Step 3: Squire Each Difference.
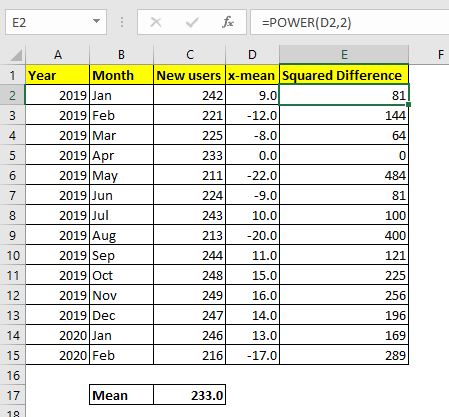
Now we need to square each difference we got here. In cell E2 write the formula below and drag down to E15:
Step 4: Sum The Squares
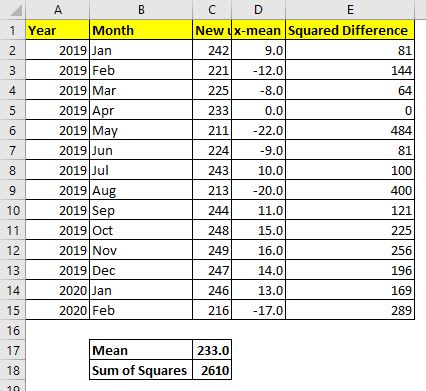
Now we need to sum up these squared differences. So use this formula in cell C18:
Final Step: Divide the Sum of Squares with number of observations.
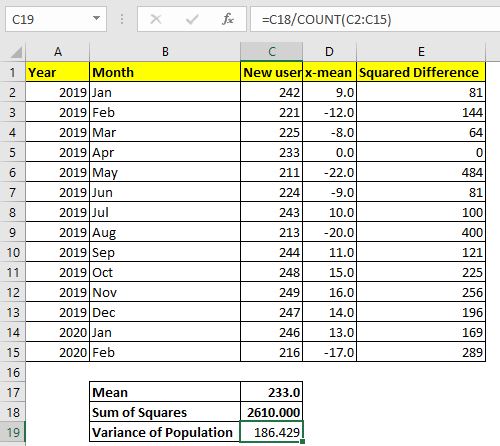
I have 14 observations. You can calculate using the COUNT function if you want.
Use this formula in Cell C19 to calculate the Variance of population.
This returns the value 186.429… which is exactly the same as the variance returned by the Excel variance formula VAR.P above.
Now that you know how variance of population is calculated manually in Excel you will be able to know how to use it in actual analysis.
Calculate Variance of Sample Manually in Excel
In most of the cases it is impossible to capture all the data for analysis. We usually pick a random sample from the data and analyse it to interpret the nature of data. In that case we if we use the variance of population it can be destructive analysis. To be on the safe side, we use the Variance of Sample formula. The formula for the Variance of Sample is:

The only difference in sample and population variance is the denominator. In sample variance, we subtract one from the number of observations (n-1). This is called unbiased analysis. This ensures that the data is not underestimated and the possible error range is a bit wider.
To calculate the variance of sample manually in Excel, we need to repeat steps 1 to 4 of variance of population. In the final step use the below formula:
This returns 200.769. This is exactly the same as the variance returned by the function VAR.S. It takes a larger error range than VAR.P to ensure less chance of mistakes in prediction.
The variance of data is not that trusted for prediction. We calculate standard deviation which is the square root of variance and many other statistics to minimize the chances of error in prediction.
So yeah guys, this is how you can calculate variance in excel. I hope it was explanatory and helpful. If you have any doubts about this variance in excel or any other statistics, the comments section is all yours.
Related Articles
How to Calculate Standard Deviation in Excel : To calculate the standard deviation we have multiple formulas. The standard deviation is simply the square root of the variance. It tells more about the data than variance.
How to use the VAR.P function in Excel : Calculate the variance for the population data numbers in excel using the VAR.P function
How to use the STDEV.P function in Excel : Calculate the standard deviation for the population data numbers in excel using the VAR.P function
How to use the DSTDEVP function in Excel : Calculate the standard deviation for the sample data numbers having multiple criteria in excel using the DSTDEVP function
How to use the VAR function in Excel : Calculate the variance for the sample data numbers in excel using the VAR function.
Regressions Analysis in Excel : Regression is an Analysis Tool, which we use for analyzing large amounts of data and making forecasts and predictions in Microsoft Excel.
How to Create Standard Deviation Graph : The standard deviation tells how much the data is clustered around the mean of the data.
Popular Articles:
50 Excel Shortcuts to Increase Your Productivity | Get faster at your task. These 50 shortcuts will make you work even faster on Excel.
The VLOOKUP Function in Excel | This is one of the most used and popular functions of excel that is used to lookup value from different ranges and sheets.
COUNTIF in Excel 2016 | Count values with conditions using this amazing function. You don’t need to filter your data to count specific values. Countif function is essential to prepare your dashboard.
How to Use SUMIF Function in Excel | This is another dashboard essential function. This helps you sum up values on specific conditions.