
Create an organization chart in Office by using SmartArt
Excel for Microsoft 365 Word for Microsoft 365 Outlook for Microsoft 365 PowerPoint for Microsoft 365 Excel 2021 Word 2021 Outlook 2021 PowerPoint 2021 Excel 2019 Word 2019 Outlook 2019 PowerPoint 2019 Excel 2016 Word 2016 Outlook 2016 PowerPoint 2016 Excel 2013 Word 2013 Outlook 2013 PowerPoint 2013 Excel 2010 Word 2010 PowerPoint 2010 Excel 2007 Word 2007 PowerPoint 2007 More…Less
If you want to illustrate the reporting relationships in your company or organization, you can create a SmartArt graphic that uses an organization chart layout, such as Organization Chart.
Tip: An alternative way to draw an org chart is with Visio, the Microsoft diagramming app. If you have Visio, read about how to use it to make an org chart in Create an organization chart in Visio.
Overview of creating an organization chart
Use a SmartArt graphic to create an organization chart in Excel, Outlook, PowerPoint, or Word to show the reporting relationships in an organization, such as department managers and non-management employees.

If you’re unfamiliar with using SmartArt graphics, you might want to read the following articles before getting started on an organization chart:
-
Learn more about SmartArt Graphics
-
Choose a SmartArt graphic
Create an organization chart
-
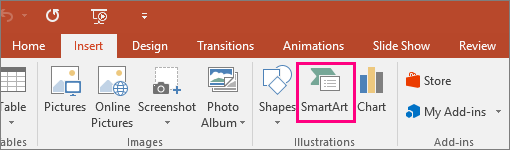
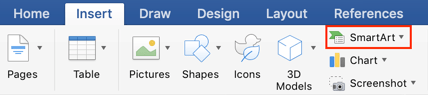
On the Insert tab, in the Illustrations group, click SmartArt.

Example of the Illustrations group on the Insert tab in PowerPoint 2016 -
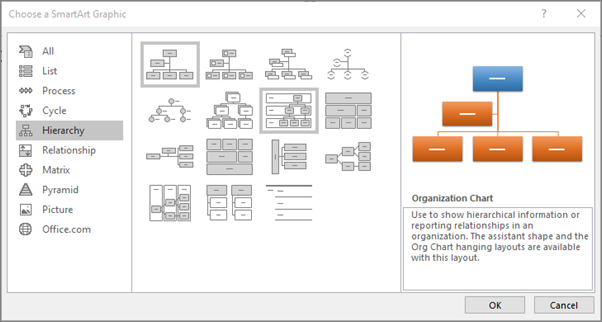
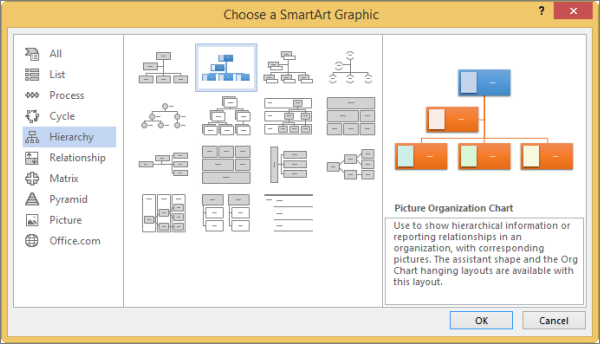
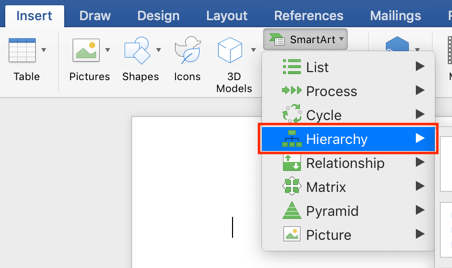
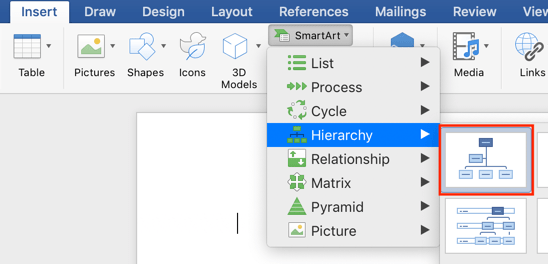
In the Choose a SmartArt Graphic gallery, click Hierarchy, click an organization chart layout (such as Organization Chart), and then click OK.
-
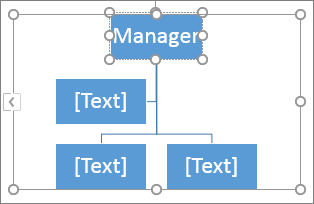
To enter your text, do one of the following:
-
Click in a box in the SmartArt graphic, and then type your text.
Note: For best results, use this option after you add all of the boxes that you want.
-
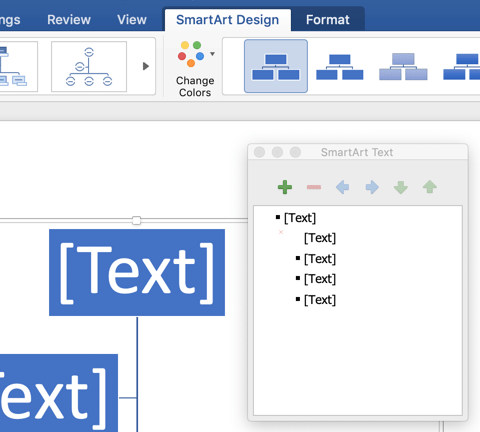
Click [Text] in the Text pane, and then type your text.
-
Copy text from another location or program, click [Text] in the Text pane, and then paste your text.
Notes:
-
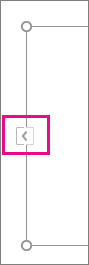
If the Text pane is not visible, click the control on the edge of the SmartArt graphic.
-
-
-

What else would you like to do?
Important: This feature is not available in Outlook or in Office 2007.
-
In your document, presentation, or spreadsheet, on the Insert tab, in the Illustrations group, click SmartArt.
Example of the Illustrations group on the Insert tab in PowerPoint 2016 -
In the Choose a SmartArt Graphic gallery, click Hierarchy, click Picture Organization Chart or Circle Picture Hierarchy, and then click OK.
-
To add a picture, in the box where you want to add the picture, click the picture icon, locate the folder that contains the picture that you want to use, click the picture file, and then click Insert.
-
To enter your text, follow the instructions in step 3 of Create an organization chart.
Add a box
-
Click the existing box that is located closest to where you want to add the new box.
-
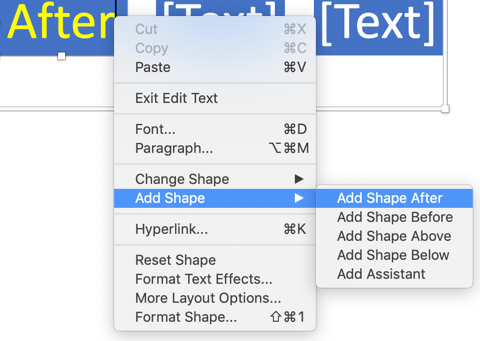
Under SmartArt Tools, on the Design tab, in the Create Graphic group, click the arrow next to Add Shape, and then do one of the following:
Note: If you do not see the SmartArt Tools or Design tabs, make sure that you have selected the SmartArt graphic. You may have to double-click the SmartArt graphic to select it and open the Design tab.
-
To insert a box at the same level as the selected box but following it, click Add Shape After.
-
To insert a box at the same level as the selected box but before it, click Add Shape Before.
-
To insert a box one level above the selected box, click Add Shape Above.
The new box takes the position of the selected box, and the selected box and all the boxes directly below it are each demoted one level.
-
To insert a box one level below the selected box, click Add Shape Below.
-
To add an assistant box, click Add Assistant.
The assistant box is added above the other boxes at the same level in the SmartArt graphic, but it is displayed in the Text pane after the other boxes at the same level.
Add Assistant is available only for organization chart layouts. It is not available for hierarchy layouts, such as Hierarchy.
-

Delete a box
To delete a box, click the border of the box you want to delete, and then press Delete.
Notes:
-
When you need to add a box to your relationship graphic, experiment with adding the shape before or after the selected shape to get the placement you want for the new shape.
-
To add a shape from the Text pane:
-
At the shape level, place your cursor at the end of the text where you want to add a new shape.
-
Press Enter, and then type the text that you want in your new shape.
-
To add an assistant box, press Enter while an assistant box is selected in the Text pane.
-
-
Although you cannot automatically connect two top-level boxes with a line in the organization chart layouts, such as Organization Chart, you can imitate this look by adding a box to the top level to your SmartArt graphic and then drawing a line to connect the boxes. (On the Insert tab, in the Illustrations group, select Shape, select a line, and then draw a line between the two boxes.) Learn more about drawing lines by reading Draw or delete a line or connector.
-
To move a box, click the box that you want to move and then drag the box to its new location. To move or «nudge» the box in very small increments, hold down Ctrl while you press the arrow keys on your keyboard.
To show a dotted-line reporting relationship between two boxes, change the style of the line between the two boxes.
-
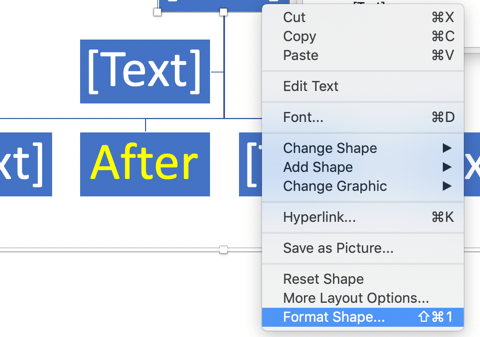
Click the SmartArt graphic whose line you want to change.
-
Right-click the line, and then click Format Shape on the shortcut menu.
-
Click Line or Line Style, and then click the Dash type that you want.
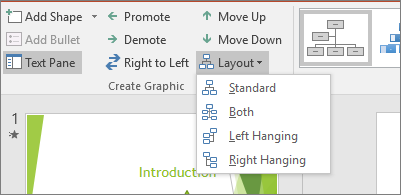
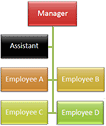
A hanging layout affects the layout of all boxes below the selected box. Although you can use other hierarchy layouts to create an organization chart, hanging layouts are available only with organization chart layouts.
-
Click the box in the organization chart that you want to apply a hanging layout to.
-
Under SmartArt Tools, on the Design tab, in the Create Graphic group, click Layout, and then do one of the following:
Note: If you do not see the SmartArt Tools or Design tabs, make sure that you have selected a SmartArt graphic. You may have to double-click the SmartArt graphic to select it and open the Design tab.
-
To center all of the boxes below the selected box, click Standard.
-
To center the selected box above the boxes below it and arrange the boxes below it horizontally with two boxes in each row, click Both.
-
To arrange the selected box to the right of the boxes below it and left-align the boxes below it vertically, click Left Hanging.
-
To arrange the selected box to the left of the boxes below it and right-align the boxes below it vertically, click Right Hanging.
-
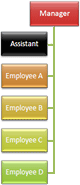
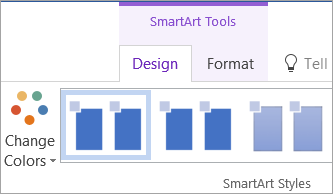
You can apply color combinations that are derived from the theme colors to the boxes in your SmartArt graphic.
-
Click the SmartArt graphic whose color you want to change.
-
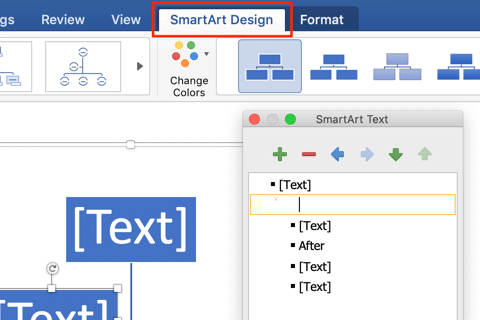
Under SmartArt Tools, on the Design tab, in the SmartArt Styles group, click Change Colors.
If you don’t see the SmartArt Tools or Design tabs, make sure that you’ve selected a SmartArt graphic.
-
Click the color combination that you want.
Tip: When you place your pointer over a thumbnail, you can see how the colors affect your SmartArt graphic.
-
Right-click the border of a box, and then click Format Shape on the shortcut menu.
-
Under Fill, click Solid fill.
-
Click Color, and then click the color that you want.
-
To specify how much you can see through the background color, move the Transparency slider, or enter a number in the box next to the slider. You can vary the percentage of transparency from 0% (fully opaque, the default setting) to 100% (fully transparent).
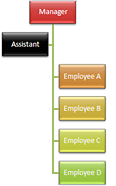
A SmartArt Style is a combination of various effects, such as line style, bevel, or 3-D, that you can apply to the boxes in your SmartArt graphic to create a unique and professionally designed look.
-
Click the SmartArt graphic whose SmartArt Style you want to change.
-
Under SmartArt Tools, on the Design tab, in the SmartArt Styles group, click the SmartArt Style that you want.
To see more SmartArt Styles, click the More button
.If you don’t see the SmartArt Tools or Design tabs, make sure that you’ve selected a SmartArt graphic.
 .
.Tip: For even more effect options, such as shadow, glow, and reflection, under SmartArt Tools, on the Format tab, in the Shape Styles group, click Shape Effects, and then choose the effect that you want.
See Also
Create an organization chart (video)
Animate charts and SmartArt (video)
Show or hide information in a Visio organization chart
Need more help?
The organizational chart, or organigram, is a diagram of the structure and
relationships of the company or other organization. If you have Visio, you can build
a huge organization histogram up to 1000 shapes with a very complex structure. SmartArt
diagrams are much simple and recommended for smaller organizations, but you can add many
visual effects and use Office theming for your organization diagrams. Using Microsoft
Word built-in tools, you can easily create and share functional, divisional, or matrix
org charts. A killer feature of SmartArt graphics templates is that you simply type and
paste the text and the template positions and re-arranges the blocks automatically.
To create an organizational chart in Microsoft Word 2016, do the following:
1. On the Insert tab, in the Illustrations group, click
SmartArt:

2. In the Choose a SmartArt Graphic gallery, click
Hierarchy, click an organizational chart layout (such as Organization Chart), and then
click OK:

There are several useful chart types for building company organization diagrams:
- Organization Chart, Picture Organization Chart, and Name and Title Organization Chart
- Half Circle Organization Chart, Circle Picture Hierarchy, and Hierarchy
- Labeled Hierarchy and Table Hierarchy
- Horizontal Organization Chart, Architecture Layout, Horizontal Multi-level Hierarchy,
Horizontal Hierarchy, and Horizontal Labeled Hierarchy - Hierarchy List and Lined List charts.
Word will also open the SmartArt Tools toolbars:

3. To enter your text, do one of the following:
- Click inside the shape of the SmartArt graphic, and type your text.
NOTE: For best results, use this option after you add all of the shapes that you
want. - Click [Text] in the Text pane, and then type your text:

- Copy text from another location or program, click [Text] in the Text pane,
and then paste your text.

4. To add a shape to your organizational chart, under SmartArt
Tools, on the Design tab, in the Create Graphic group, click the Add Shape
button, and then choose one of the following:

- To insert a shape at the same level as the selected shape, but following it, click Add Shape
After. - To insert a shape at the same level as the selected shape, but before it, click Add Shape
Before. - To insert a shape one level above the selected shape, click Add Shape Above.
The new shape
takes the position of the selected shape, and the selected shape and all of the shapes directly
below it are each demoted one level. - To insert a shape one level below the selected shape, click Add Shape Below. The new shape
takes the position after the other shapes at the same level. - To add an assistant shape, click Add Assistant. The assistant shape is added above the other
shapes at the same level in the SmartArt graphic, but it is displayed in the Text pane
after the other shapes at the same level.
Add Assistant is available only for
organizational chart layouts. It is not available for hierarchy layouts, such as Hierarchy.
5. To change the hanging layout of your organizational chart, under
SmartArt Tools, on the Design tab, in the Create Graphic group, click
Layout, and then do one of the following:

- To center all of the shapes below the selected shape, click Standard.
- To center the selected shape above the shapes below it and arrange the shapes below it horizontally
with two shapes in each row, click Both. - To arrange the selected shape to the right of the shapes below it and left-align the shapes below it
vertically, click Left Hanging. - To arrange the selected shape to the left of the shapes below it and right-align the shapes below it
vertically, click Right Hanging.
To change the format (the colors, line styles, and so on), under SmartArt Tools, on the
Design tab, in the SmartArt Styles group, click the Change Colors:

Example:

Before you change a layout, we recommend you save the document. The Undo might not work
properly here; so, if you don’t like the results of your changes, you can close the file and reopen to
get back to the previous layout.
See also this tip in French:
Utilisation de l’outil Organigramme.
An organizational chart (also called an organization chart, and usually shortened to org chart) is a visual representation of the roles and reporting structure of a team, department, division, or an entire company. In this tutorial, you’ll learn to easily create and modify org charts using Microsoft Word in a few minutes.
What Is an Organizational Chart?
An organizational chart, also called an org chart or organization chart, is a visual representation of the hierarchy within an organization. Employees use org charts to visualize the reporting structure of a company’s many roles and departments.
Managers can also use org charts to evaluate the responsibilities of different roles before and after a period of restructuring. Org charts are also useful for mapping groups beyond departments in large corporations, from volunteer organizations to family trees.
Besides the obvious use of visualizing the reporting structure, org charts can be a practical tool to use in many situations, including the following:
-
Evaluating the functions of departments and of employees
-
Planning cross-department projects
-
Planning and evaluating restructuring efforts
-
Tracking workloads of individual employees and of managers to determine who has too much or too little work
The easiest way to read an organizational chart is from the top to bottom. Most org charts are pyramid shaped, with the highest-ranking person at the top. Each row is a level of management, so the chart widens as it maps the lower levels of the organization. Lines connect shapes to show reporting relationships.
How to Make an Org Chart in Word
The easiest way to create an org chart from scratch in Microsoft Word is with the SmartArt tool, which is included in all versions since 2010. SmartArt provides a variety of shape tools to create and customize your chart.
Along with step-by-step instructions, which you’ll find below, we also have a quick video walking you through each of the steps to create the most effective org chart for your organization.
Here are the steps to create your org chart. You may also consider using a free organizational chart template to save time.
Note: All screenshots in this article are from Microsoft Word for Mac 2011. Other versions of Word will have variations in how the items appear, but the steps are similar. You can also use the SmartArt feature in Excel to create an org chart.
- Open a blank Microsoft Word document and click the Insert tab, click SmartArt, click Hierarchy, and then click Organization Chart.
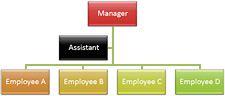
- The top shape (a rectangle in this example) is for the head of the organization. Click the shape (you may need to move or hide the text pane) and enter the name of the person. Hit return or shift+return to start a new line to enter a title or other information. The text will automatically resize to fit inside the shape.
- The shape just below the top position is for an assistant. Click the shape and enter their information.
- The next row of shapes are for people reporting to the leader of the organization. Click each one and enter each person’s information.
Using the Text Pane
In addition to adding or editing text in a shape (which are also called autoshapes), you can add or edit text in the text pane.
In the text pane, the L-shaped icon represents an assistant. Bullet points correspond to all other positions.
The text pane is the easiest way to add or delete new shapes, as well as move shapes up or down levels. If the text pane isn’t visible, click the text pane tab (marked in red in the image below).
How to Make Changes to an Organizational Chart in Word
Once you create your org chart in Microsoft Word, use SmartArt to easily change shapes, colors, and fonts. We’ll guide you through how to change shapes, add or change colors and pictures, and modify report lines below:
Add a Shape: Select a shape (the default shape is a rectangle) and click the plus button on the text pane. The new shape will be added on the same row as the selected shape. A couple things to note:
- If no shape is selected, the new shape will not be connected to the other shapes, and will appear on the same level as the top shape in the chart.
- If a direct report is selected when adding a shape, the new shape will also be a direct report to the same position.
Add an Assistant: If the org chart already has an assistant, select that shape and follow the directions above to add a shape in the text pane.
If the assistant box has been removed, or if an assistant is needed for another position, click the shape where you add the new assistant shape, then click SmartArt in the ribbon, click Org Chart, and click Add Assistant.
Resize a Shape: Click the shape, then drag the handles on the corners or sides to make the shape larger or smaller.
Add a Direct Report: Right-click a shape and click Add Shape and choose Add Shape Below. The new shape will be in a subordinate position.
Delete a Shape: Click the shape (in an area that doesn’t include text), and then click the minus button on the text pane.
Change the Text: This is no different than changing other text in Word: Highlight the text, and then change the font, the color, the size, or any other aspect using the options in the Home tab.
Change a Shape’s Background: Right-click on a shape, click Format shape, click Fill, and choose an option.
Change the Layout: Click the Hierarchy menu on the SmartArt ribbon to change the layout of your org chart.
Change the Design: Select the chart, then choose an option from SmartArt Graphic Styles. These options will differ based on the selected layout.
Add Pictures: If you want to include pictures of the people in each position, you can add them as background images (see “Change a Shape’s Background” above).
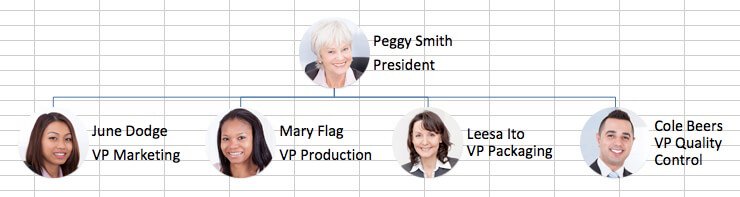
Another option is to select the Circle Picture Hierarchy layout, then add a picture for each position by clicking on the placeholder and inserting an image.
After you add the pictures, it’ll look something like this:
Modify a Relationship: The easiest way to change a relationship (e.g. if a person moves to a new manager) is to delete the shape from under the former manager and add a new shape under the new manager. Follow the steps for deleting a shape and adding a shape outlined above.
Adding a Line: You can include connector lines by adding a shape that’s linked to another shape.
Some Org Chart Design Considerations
The default design works well for many situations, but you may also customize the appearance of each element in the chart. To keep the org chart easy to read, it’s best to keep the design consistent and simple.
Not all charts include titles, but it’s common to list the person’s name, followed by their title on a separate line. If you want the titles first, enter the information in that order.
What You Can Do with an Org Chart Once It’s Complete
Once you have completed your chart, finalize the layout and share it with others. You can save it as an online document and send or share it, or print it out to use as a handout in meetings or new hire onboarding.
-
Save the Chart as a Picture: Right-click the chart, and then click Save as picture. It’s easy to include the picture as part of a web page, or import it into documents.
-
Print the Chart: If the chart isn’t too big, try to fit it onto a single page. Play around with print settings and page margins to see if that’s applicable. Then you can print and distribute the chart.
-
View in Landscape Mode: Some charts will be easier to read in landscape mode. Change the orientation by selecting Page Setup from the Word File menu, and click Landscape.
How Do I Create an Organogram in Word?
Organogram is another word for an organizational chart, and is used primarily in the United Kingdom. To create an organogram in Microsoft Word, follow the same instructions to create an organizational chart using the SmartArt tool.
Org Charts FAQs
There are many commonly asked questions about organizational charts, including the best programs to create them in and the situations for which they are most useful. We’ve outlined answers to these questions below.
What are some other programs you can use to create org charts?
Microsoft Excel, PowerPoint, and Outlook all use the same SmartArt tool as Word and so you can use those programs to create org charts, as well. Outside of the Microsoft Office family, you can use Visio, LucidChart, OrgPlus, OrgWeaver, Pingboard, OrgChart4U, and others. But the ubiquity of Microsoft Office and the ease of use of the SmartArt feature makes creating org charts in Word or other Microsoft Office products the easiest choice for most people.
Where did the org chart originate?
Engineer Daniel McCallum and artist George Holt Henshaw are credited with creating the modern form of the organizational chart. Their chart showed the organization of the New York and Erie railroad, and included both the position each person held and the location where each worked.
The term “organization chart” made its way into the English vocabulary in the first part of the 20th century and peaked in use in the 1960s. The term continues to be in regular use today.
When are org charts not helpful?
Org charts don’t contain information related to budgeting, track informal communication channels, or map out the complexity of daily operations. Organizations that use a lot of temporary or contract employees with a high turnover rate may find maintaining an org chart to be taxing. An employee list may work better in this situation.
Make Better Decisions, Faster by Creating Org Charts in Smartsheet
Empower your people to go above and beyond with a flexible platform designed to match the needs of your team — and adapt as those needs change.
The Smartsheet platform makes it easy to plan, capture, manage, and report on work from anywhere, helping your team be more effective and get more done. Report on key metrics and get real-time visibility into work as it happens with roll-up reports, dashboards, and automated workflows built to keep your team connected and informed.
When teams have clarity into the work getting done, there’s no telling how much more they can accomplish in the same amount of time. Try Smartsheet for free, today.
How to Build Organizational Charts in Word
Microsoft Word makes the initial build of an organizational chart simple with SmartArt. The line between boxes is automatically aligned, and you can quickly create subordinates and assistants for any position.
Instructions
-
Insert SmartArt
In the Insert tab, click on the SmartArt dropdown.
-
Choose a SmartArt style
Scroll down through the SmartArt options, and hover over the Hierarchy flyout.
-
Choose organizational structure
Choose a layout that works for you. Our favorite is the first one, Organizational Chart.
-
Add employee descriptions
Once you click the Organizational Chart image, Word will automatically generate the org chart template pictured below. The SmartArt Text dialog will also open up. You can edit the content in each of the boxes in the SmartArt Text box or directly in the boxes. To add another line of text within the box, hit enter.
-
Add a new shape
Once you click the Organizational Chart image, Word will automatically generate the org chart template pictured below. The SmartArt Text dialog will also open up. You can edit the content in each of the boxes in the SmartArt Text box or directly in the boxes. To add another line of text within the box, hit enter.
-
Update organizational chart format
To update the format of your org chart right click (control + click on Macs) into the editing plane and click on the dropdown option Format Object.
-
Additional organizational chart formatting options
Another way of editing the color and format of the org chart boxes is by clicking into the editing plane and choosing SmartArt Design in the top ribbon. You can edit the text within the org chart boxes by clicking into the org chart editing plane and choosing Format.
-
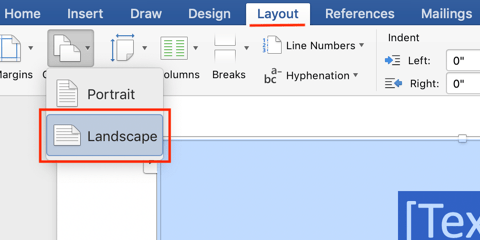
Change organizational chart layout
If you have more of a horizontal organizational structure, switch the orientation of your document to the landscape layout. To do this, first click the Layout tab. You can then click the Orientation button and select the Landscape option.
-
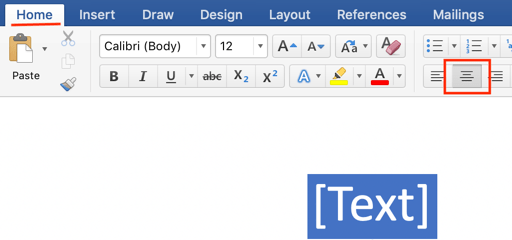
Center organizational chart
You can center your org chart with these steps. Click outside the SmartArt section to exit the editing function. Then click to the left of the org chart so your curser will be right before the org chart. Choose the Home tab, and then click the Center Text button.
Create an org chart that updates automatically
Build Org Chart in Pingboard
Creating an Org Chart in Word with Templated Information
-
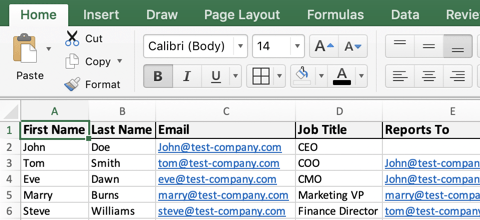
Download the organizational chart template for Excel
This file will contain all of the common data points found in org charts. You will be able to quickly add your staff info to this template and edit the information displayed in your org chart.
-
Add employees to the org chart template
Add data points for employees like first name, last name, and title. This org chart template can serve as the master document for your employee database.
-
Copy/paste employee data into the org chart
Copy all of the data you’d like to display in your org chart, then clear the information in the SmartArt text box and paste in your employee data.
If there’s data in the employee database that you don’t want, you can hide columns before copying the data; this will exclude any unwanted employee data points.
-
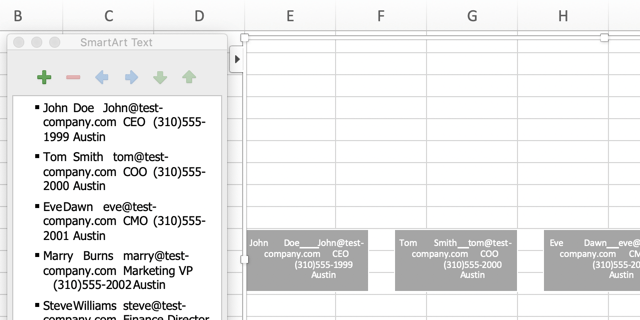
Style employee data in the org chart
The information copied over from the org chart template will be in one long line. Click into each shape where the employee data was pasted and organize the information into separate lines.
To get your organizational structure to line up like the example below, start with the employee on the far right—or the most junior employee—and demote people until they’re under their manager

Free org chart templates for Word
Need some examples for different organizational structures in Word? Download templates for hierarchical, functional, matrix, and geographic org charts.
 Hi! In this post I will show you how to group and ungroup picture or charts in MS Word, grouping means it will convert all the images or chart into a single picture and ungroup means it will separate each images, lets see how to do this.
1. Open word file select multiple picture by using and “Shift” and “mouse cursor”
2. After all selected right click and navigate on “grouping” and than click on “Group” for ungroup do this and select “ungroup”
Watch video tutorial… Please like, share & subscribe