
You can use a group box or a frame control to group related controls (such as option buttons, check boxes, or closely related contents) into one visual unit.
Group boxes and frame controls are rectangular objects with optional labels. Use a group box or a frame control to visually organize related items on a form. For example, in a customer order application, group the name, address, and account number of a customer. Or in an order form, group a list of available items.
|
Group box (Form control)
|
Frame control (ActiveX control)
|
What type of control do you want to use?
-
Make sure the Developer tab is available.
Display the Developer tab
-
Click File > Options > Customize Ribbon.
-
Under Customize the Ribbon, click Main tabs from the dropdown list.
-
Select the Developer checkbox, and then click OK.
-
Make sure that you are in design mode. On the Developer tab, click Design Mode
 .
.
-
-
On the Developer tab, click Insert, and then under ActiveX Controls, click More Controls
.
-
In the More Controls dialog box, select Microsoft Forms 2.0 Frame from the list of available controls on your computer.
-
Click the worksheet location where you want the upper-left corner of the frame control to appear.
-
To specify the control properties, on the Developer tab, click Properties
.Tip: You can also right-click the control, and then click Properties.
The Properties dialog box appears. For detailed information about each property, select the property, and then press F1 to display a Visual Basic Help topic. You can also type the property name in the Visual Basic Help Search box.
This table summarizes by functional categories the properties available.
 .
. .
.
 .
.|
If you want to specify |
Use this property |
|---|---|
|
General: |
|
|
Whether the control is loaded when the workbook is opened. (Ignored for ActiveX controls.) |
AutoLoad (Excel) |
|
Whether the control can receive the focus and respond to user-generated events. |
Enabled (Form) |
|
Whether the control can be edited. |
Locked (Form) |
|
The name of the control. |
Name (Form) |
|
The way the control is attached to the cells below it (free floating, move but do not size, or move and size). |
Placement (Excel) |
|
Whether the control can be printed. |
PrintObject (Excel) |
|
Whether the control is visible or hidden. |
Visible (Form) |
|
Text: |
|
|
Font attributes (bold, italic, size, strikethrough, underline, and weight). |
Bold, Italic, Size, StrikeThrough, Underline, Weight (Form) |
|
Descriptive text on the control that identifies or describes it. |
Caption (Form) |
|
Size and position: |
|
|
The height or width in points. |
Height, Width (Form) |
|
The distance between the control and the left or top edge of the worksheet. |
Left, Top (Form) |
|
Formatting: |
|
|
The background color. |
BackColor (Form) |
|
The color of the border. |
BorderColor (Form) |
|
The foreground color. |
ForeColor (Form) |
|
Whether the control has a shadow. |
Shadow (Excel) |
|
The visual appearance of the border (flat, raised, sunken, etched, or bump). |
SpecialEffect (Form) |
|
Image: |
|
|
The bitmap to display in the control. |
Picture (Form) |
|
The location of a background picture (top left, top right, center, and so on). |
PictureAlignment (Form) |
|
How to display the background picture on the control (crop, stretch, or zoom). |
PictureSizeMode (Form) |
|
Whether you want to tile multiple copies of the picture in the control. |
PictureTiling (Form) |
|
Keyboard and mouse: |
|
|
A custom mouse icon. |
MouseIcon (Form) |
|
The type of pointer that is displayed when the user positions the mouse over a particular object (for example, standard, arrow, or I-beam). |
MousePointer (Form) |
|
Specific to frame: |
|
|
The type of border used, either a single-line or none. |
BorderStyle (Form) |
|
Whether the control has vertical scroll bars, horizontal scroll bars, or both. |
ScrollBars (Form) |
|
The action to take when the user leaves the last control on a frame or page (all forms or current form). |
Cycle (Form) |
|
Whether scroll bars remain visible when not required. |
KeepScrollBarsVisible (Form) |
|
The height or width, in points, of the total area that can be viewed by moving the scroll bars. |
ScrollHeight, ScrollWidth (Form) |
|
The distance, in points, of the left or top edge of the logical form from the left or top edge of the frame. |
ScrollLeft, ScrollTop (Form) |
|
How much to change the size of an image in the frame. |
Zoom (Form) |
Notes:
-
If you plan to use the frame control frequently, add it to a «Saved controls» worksheet, and then save the worksheet for reuse. The next time that you need the frame control, open that worksheet, and then copy the frame control to the worksheet form that you are editing.
-
All option buttons in a frame are mutually exclusive by default.
-
You can also use a toggle button inside a frame to select one or more items from a related group. For example, you can create an order form that contains a list of available items with a toggle button preceding each item.
What type of control do you want to use?
-
Make sure the Developer tab is available.
Display the Developer tab
-
Click the Microsoft Office Button
, and then click Excel Options. -
In the Popular category, under Top options for working with Excel, select the Show Developer tab in the Ribbon check box, and then click OK.
-
-
On the Developer tab, in the Controls group, click Insert, and then under Form Controls, click Group box
.
-
Click the worksheet location where you want the upper-left corner of the group box to appear.
-
Place related controls inside the boundary of the Group box.
For example:
-
Check boxes, such as a list of related products for purchase.
-
Labels and text boxes, such as name and address information.
-
Option buttons that indicate a set of mutually exclusive choices, such as Small, Medium, or Large.
-
-
To specify the control properties, right-click the control, and then click Format Control.
 , and then click Excel Options.
 .
.-
If the Developer tab is not available, display it.
Display the Developer tab
-
Click the Microsoft Office Button
, and then click Excel Options. -
In the Popular category, under Top options for working with Excel, select the Show Developer tab in the Ribbon check box, and then click OK.
-
-
On the Developer tab, in the Controls group, click Insert, and then under ActiveX Controls, click More Controls
.
-
In the More Controls dialog box, select Microsoft Forms 2.0 Frame from the list of available controls on your computer.
-
Click the worksheet location where you want the upper-left corner of the frame control to appear.
-
To edit the ActiveX control, make sure that you are in design mode. On the Developer tab, in the Controls group, turn on Design Mode
. -
To specify the control properties, on the Developer tab, in the Controls group, click Properties
.Tip: You can also right-click the control, and then click Properties.
The Properties dialog box appears. For detailed information about each property, select the property, and then press F1 to display a Visual Basic Help topic. You can also type the property name in the Visual Basic Help Search box.
This table summarizes by functional categories the properties available.
|
If you want to specify |
Use this property |
|---|---|
|
General: |
|
|
Whether the control is loaded when the workbook is opened. (Ignored for ActiveX controls.) |
AutoLoad (Excel) |
|
Whether the control can receive the focus and respond to user-generated events. |
Enabled (Form) |
|
Whether the control can be edited. |
Locked (Form) |
|
The name of the control. |
Name (Form) |
|
The way the control is attached to the cells below it (free floating, move but do not size, or move and size). |
Placement (Excel) |
|
Whether the control can be printed. |
PrintObject (Excel) |
|
Whether the control is visible or hidden. |
Visible (Form) |
|
Text: |
|
|
Font attributes (bold, italic, size, strikethrough, underline, and weight). |
Bold, Italic, Size, StrikeThrough, Underline, Weight (Form) |
|
Descriptive text on the control that identifies or describes it. |
Caption (Form) |
|
Size and position: |
|
|
The height or width in points. |
Height, Width (Form) |
|
The distance between the control and the left or top edge of the worksheet. |
Left, Top (Form) |
|
Formatting: |
|
|
The background color. |
BackColor (Form) |
|
The color of the border. |
BorderColor (Form) |
|
The foreground color. |
ForeColor (Form) |
|
Whether the control has a shadow. |
Shadow (Excel) |
|
The visual appearance of the border (flat, raised, sunken, etched, or bump). |
SpecialEffect (Form) |
|
Image: |
|
|
The bitmap to display in the control. |
Picture (Form) |
|
The location of a background picture (top left, top right, center, and so on). |
PictureAlignment (Form) |
|
How to display the background picture on the control (crop, stretch, or zoom). |
PictureSizeMode (Form) |
|
Whether you want to tile multiple copies of the picture in the control. |
PictureTiling (Form) |
|
Keyboard and mouse: |
|
|
A custom mouse icon. |
MouseIcon (Form) |
|
The type of pointer that is displayed when the user positions the mouse over a particular object (for example, standard, arrow, or I-beam). |
MousePointer (Form) |
|
Specific to frame: |
|
|
The type of border used, either a single-line or none. |
BorderStyle (Form) |
|
Whether the control has vertical scroll bars, horizontal scroll bars, or both. |
ScrollBars (Form) |
|
The action to take when the user leaves the last control on a frame or page (all forms or current form). |
Cycle (Form) |
|
Whether scroll bars remain visible when not required. |
KeepScrollBarsVisible (Form) |
|
The height or width, in points, of the total area that can be viewed by moving the scroll bars. |
ScrollHeight, ScrollWidth (Form) |
|
The distance, in points, of the left or top edge of the logical form from the left or top edge of the frame. |
ScrollLeft, ScrollTop (Form) |
|
How much to change the size of an image in the frame. |
Zoom (Form) |
Notes:
-
If you plan to use the frame control frequently, add it to a «Saved controls» worksheet, and then save the worksheet for reuse. The next time that you need the frame control, open that worksheet, and then copy the frame control to the worksheet form that you are editing.
-
All option buttons in a frame are mutually exclusive by default.
-
You can also use a toggle button inside a frame to select one or more items from a related group. For example, you can create an order form that contains a list of available items with a toggle button preceding each item.
In this Excel tutorial, you will learn how to create and configure a frame in Excel.
When you use many controls in your controls, the group box could be quite important for you. A group box groups controls such as radio button or checkbox.
A Group Box in Excel is a container that can be used to group related controls, such as check boxes, option buttons, or other controls, together. You can use a Group Box to help organize your data and improve the usability of your spreadsheet.
Inserting Group Box
To insert a group box into the spreadsheet in Excel, first go to the Developer tab, in the Controls group. Click Insert, and then, under Form Controls, click Group Box.

Click on the worksheet location where you want to insert the group box. Draw the Group Box on the worksheet by clicking and dragging to the size you want.

To set the control’s properties, right-click the icon, and then click Format Control. In the Properties section, you can change the name, caption, and other properties of the Group Box.

Example of group boxes in Excel
To add controls to the Group Box, you can use the other control options from the «Developer» tab, such as «Option Button», «Check Box», or others.
Group Box with a check box.

Group Box with option buttons.

To change the properties of the controls inside the Group Box, you can right-click on the control and select «Properties».
By using a Group Box, you can better organize your data and provide a more user-friendly interface for your users.
The “Group” is an Excel tool which groups two or more rows or columns. With grouping, the user has an option to minimize and maximize the grouped data. The rows or columns of the group collapse on minimizing and expand on maximizing. The “group” option is available under the “outline” section of the Data tab.
Contents
- 1 How do you use grouping in Excel?
- 2 What is grouping and ungrouping in Excel?
- 3 What is the benefit of grouping in Excel?
- 4 What does it mean to group columns in Excel?
- 5 How do I separate groups in Excel?
- 6 What do you understand by the term grouping?
- 7 What is grouping in pivot table?
- 8 What is grouped and ungrouped data?
- 9 What is Pivot in Excel?
- 10 What is consolidate in Excel?
- 11 How do you group top in Excel?
- 12 How do you group adjacent columns or rows separately?
- 13 What is an example of grouping?
- 14 Why is grouping done?
- 15 What is the need of grouping?
- 16 Why won’t excel group my dates?
- 17 How do I get a group dialog box in Excel?
- 18 How do I filter grouped rows in Excel?
- 19 What is the difference between group and ungroup data?
- 20 What are the difference between group and ungroup objects?
How do you use grouping in Excel?
On the Data tab, in the Outline group, click Group. Then in the Group dialog box, click Rows, and then click OK. Tip: If you select entire rows instead of just the cells, Excel automatically groups by row – the Group dialog box doesn’t even open.
What is grouping and ungrouping in Excel?
To ungroup data in a list in Excel: Select the rows or columns you wish to ungroup. On the Data tab, in the Outline group, click the Ungroup command. In the Group dialog box, select Rows or Columns and click OK .
What is the benefit of grouping in Excel?
Grouping rows and columns enables you to hide and unhide those rows and columns easily and quickly. The advantage with using grouping to do the hiding is that icons are added to the sheet to make it obvious that rows or columns are hidden. Those icons also make it easy to hide and unhide the rows and columns.
What does it mean to group columns in Excel?
Group Column in excel means bringing one or more columns together in an excel worksheet, this gives us option to contract or expand the column and excel provides us a button to do so, to group columns we need to select two or more columns and then from data tab in the outline section we have the option to group the
How do I separate groups in Excel?
A shortcut way to group rows or columns is to highlight the rows/columns you wish to group and use ALT+SHIFT+RIGHT ARROW to group the rows/columns, and ALT+SHIFT+LEFT ARROW to ungroup them.
What do you understand by the term grouping?
Definition of grouping
1 : the act or process of combining in groups. 2 : a set of objects combined in a group a furniture grouping.
What is grouping in pivot table?
Grouping data in a PivotTable can help you show a subset of data to analyze. For example, you may want to group an unwieldy list of dates or times (date and time fields in the PivotTable) into quarters and months, like this image. Note: The time grouping feature is new in Excel 2016.
What is grouped and ungrouped data?
What is grouped data and ungrouped data? Grouped data means the data (or information) given in the form of class intervals such as 0-20, 20-40 and so on. Ungrouped data is defined as the data given as individual points (i.e. values or numbers) such as 15, 63, 34, 20, 25, and so on.
A pivot table in Excel is an extraction or resumé of your original table with source data. A pivot table can provide quick answers to questions about your table that can otherwise only be answered by complicated formulas.
What is consolidate in Excel?
To summarize and report results from separate worksheets, you can consolidate data from each sheet into a master worksheet. The sheets can be in the same workbook as the master worksheet, or in other workbooks. When you consolidate data, you assemble data so that you can more easily update and aggregate as necessary.
How do you group top in Excel?
You can change the direction of grouping in Excel.
- Go to the Data ribbon.
- Click on the tiny arrow in the bottom corner of the outline section.
- Set the ticks according to your desired direction, for example “Summary rows below detail”.
How do you group adjacent columns or rows separately?
How to group adjacent columns or rows separately or independently in Excel?
- Group adjacent two columns or rows separately with shortcut keys.
- Just select column A, and then hold Shift + Alt + Right arrow as following screenshot shown:
- And the first two columns are grouped immediately, see screenshot:
What is an example of grouping?
For example, an example of two sparse groups would be birds and fish: crow, dolphin, dove, shark, pigeon. non-sparse – Non-sparse grouping means that the items in the group are very close together on the page and are usually encapsulated in a single list. For example: crow, dove, pigeon.
Why is grouping done?
Materials are grouped together on the basis of similarities and differences in their properties. Materials are grouped together for convenience and to study their properties. Grouping materials saves our time, energy and makes our work easier.
What is the need of grouping?
Grouping the objects helps us to arrange them in a systematic manner. The objects when grouped are easy to handle. When grouped, it is easy to know the properties of an object clearly. Grouping also makes easy to compare two objects.
Why won’t excel group my dates?
The simple rule for the enabling the Group Field feature for dates is: All cells in the date field (column) of the source data must contain dates (or blanks). If there are any cells in the date field of the source data that contain text or errors, then the group feature will NOT work.
How do I get a group dialog box in Excel?
On the Analyze tab, click Group Field in the Group option. When your field contains date information, the date version of the Grouping dialog box appears. By default, the Months option is selected. You have choices to group by Seconds, Minutes, Hours, Days, Months, Quarters, and Years.
How do I filter grouped rows in Excel?
Grouping in Excel | Filters in Excel
- Click on the data tab.
- Choose the cells.
- Choose groups from the menu.
- A box appears with the option of rows and columns.
- Choose the ones you wanted to group either rows or columns.
- Click ok.
What is the difference between group and ungroup data?
Grouped data is data that has been organized in classes after its analysis. Examples include how many bags of maize collected during the rainy season were bad. On the other hand, ungrouped data is data which does not fall in any group. It is still raw data.
What are the difference between group and ungroup objects?
You can combine several objects into a group to treat them as a single one. For example, you might group objects laying on a table with the table to in order move them together. When you ungroup the bigger group, objects in a nested group will remain grouped.
Ever worked on a cluttered spreadsheet, spending the whole night figuring out why your calculations are off, only to realize that some of the rows had been hidden and not updated? Some of us have.
And what about organizing data? What if your spreadsheets were more organized and readable? Wouldn’t it make you that much more efficient while making your work more presentable and understandable to a third party?

Maybe you want to train your juniors on working on the model you built or present the outputs of your model to your boss, who has no interest in looking at the raw data used to arrive at those outputs. Well everyone has at some point in their career, wished that Excel had some functionality to organize data without having to keep track of where and what rows and columns have been hidden.
Worry not, as the people behind Excel know this too and have been generous to provide us with a powerful tool to organize data called the «Group» function, which is also known as the «Outline» function. This comprehensive guide provides you with the knowledge you need to use this powerful function with ease and make it a part of your financial modeling toolkit.
The appeal of using spreadsheets such as Excel was due to their ability to make the results from analyzing data beautiful and meaningful. As time passed, the most analytical industry, when it comes to number crunching and presenting to outsiders who may not like or understand technical lingo (i.e., finance), started heavily leveraging this powerful tool. However, as with any flexible solution, it comes with its own problems that arise when the flexibility is misunderstood and misused.
Hide is one such tool that Excel provides, which is probably the most misused tool among new Excel users. There is a better tool that performs the same function but without its shortcomings called Group. In the next section, we briefly talk about why hide should never be used, at least not in financial modeling, before going on to talk about the Group function.
While building and working on modeling financial statements, there are a lot of rows and columns that, once filled and used to calculate an output, are better off «hidden» to have a cleaner worksheet with less clutter.
However, hiding rows or columns in Excel is considered bad practice, as it makes it very difficult for reviewers and future users to notice and account for the hidden cells. This can and often will eventually lead to errors, especially when data from hidden cells are used as inputs to calculate output data in the non-hidden cells and are not updated.
For such situations, where we want to summarize the data and hide it when not in use, while providing an indicator of such hidden rows and columns, Excel gives us a handy tool called «Group.» This function allows us to summarize data into a maximum of 8 levels (it is uncommon to see more than 2 or 3 levels used; hence eight is more than enough). Furthermore, the grouped cells can be collapsed to hide the data until it is required, in which case, you would expand on it.
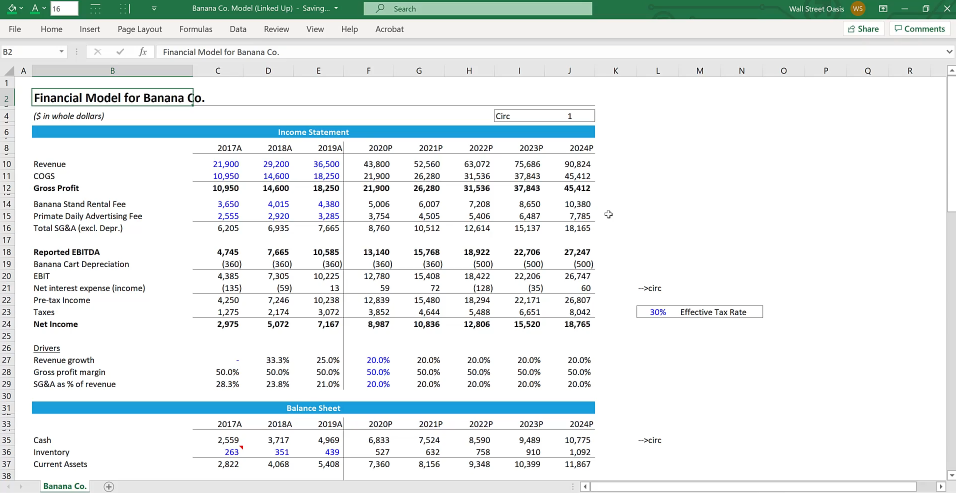
Source: A snapshot of a financial model from our Elite Modeling Package.
The Group function in Excel is among the most powerful functions that top analysts use to improve productivity while improving the presentation of their models. Financial models generally include complex and detailed information that makes reading and analyzing difficult. There is no reason why you shouldn’t be using this tool to summarize your financial models and make the most of what Excel provides to come up on top.
Few of the most compelling reasons for summarizing data using this tool in your financial models are:
- To keep the data organized for future reference
- To avoid creating new sheets for every instance of similar data
- To hide or minimize data and calculations that are not needed by others
- To avoid the confusion that comes with using the default «hidden» function that Excel provides
- To expand and contract data as and when the need arises
How to Group Rows in Excel?
Below is a detailed explanation (changed for application in financial modeling) for creating an outline of rows in Excel as provided by Microsoft on their Excel guide.
- Make sure that:
- Each column of the data that you want to outline has a label in the first row, for example, EV/ EBITDA
- Each column you want to outline in the range contains similar data
- The range you want to outline has no blank rows or columns.
- If you want to add a subtotal row summarizing the data in the selected range, you can add it using two methods:
- Insert summary rows by using the Subtotal command
Use the Subtotal command from the outline ribbon, which inserts the SUBTOTAL function immediately below or above each group of rows and automatically creates the outline for you. Check out this guide provided by Microsoft for more information on the SUBTOTAL function. - Insert your own summary rows
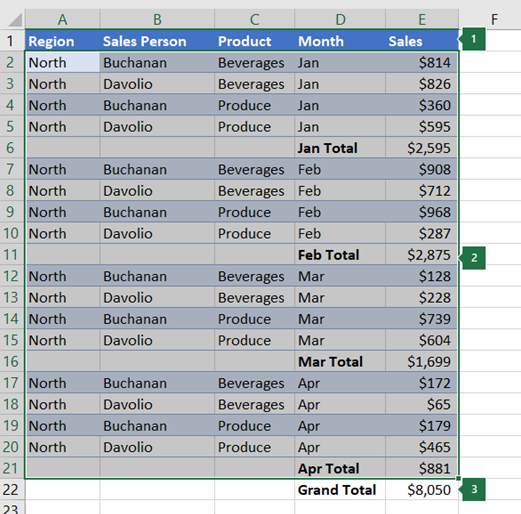
If you are not comfortable using the SUBTOTAL function, you can insert a row for subtotal and manually enter the sum for each subgroup using the SUM function. For example, under the rows for Cost of Goods Sold (COGS) in the snapshot from earlier, use the SUM function to subtotal and arrive at the Gross Profit. The table later in this topic will show you another example of this.
- Insert summary rows by using the Subtotal command
- Now you have to outline the data you want to summarize. To do this, Excel provides you with a couple of options:
- Automatically outline data
- Select a cell in the range of cells you want to outline.
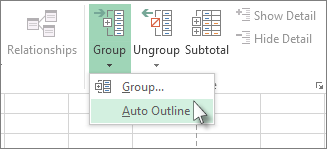
- Go to the Data tab, and in the Outline group, click the arrow under Group, and then click Auto Outline.

- Manually outline data
- To outline the data, select all the rows as well as any summary rows you have added to it.

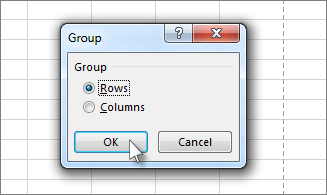
- Go to the Data tab, and click Group in the Outline group. Then, in the Group dialog box, click Rows. Finally, confirm by clicking OK.
Tip: If you select entire rows instead of just cells, Excel groups automatically by row, without the Group dialog box appearing.
- Optionally, to outline inner, nested rows, select the rows adjacent to the ones that contain the summary row and proceed to step iv below.
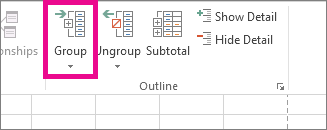
- On the Data tab, in the Outline group, click Group.
 Then in the Group dialog box, click Rows, and then click OK. The outline symbols appear alongside the group.
Tip: If you select entire rows instead of just the cells, Excel automatically groups by row — the Group dialog box doesn’t even open. - Continue selecting and grouping inner rows until you have created all the levels you want in the outline.
- To ungroup rows, select them, and then on the Data tab, in the Outline group, click Ungroup.
- You can also ungroup sections of the outline without removing the entire level. First, hold down SHIFT while you click
 or for the group, and then on the Data tab, in the Outline group, click Ungroup.
- To outline the data, select all the rows as well as any summary rows you have added to it.
- Automatically outline data
 Then in the Group dialog box, click Rows, and then click OK. The outline symbols appear alongside the group.
Summarized (Grouped) Data: How to Show or Hide?
Once you have created outlines from the important rows in your financial model, you would most likely want to hide or show the data as you please, depending on which part of the sheet you are working on.
Your margin should now display outline symbols ‘+’, ‘-‘, ‘1’, ‘2’, and so on. If you do not see these, go to File > Options > Advanced. Then, under Display options for this worksheet, enable Show outline symbols if an outline is applied. Finally, click OK to apply the change.
Clicking on the «+» button reveals hidden data used for the outline, while clicking on the «-» button hides the displayed outline. However, using the mouse is not something top analysts do as it makes them slow and less efficient. To ensure that all WSO readers have a cutting edge in the industry, we provide and encourage you to use shortcuts for both functions. The shortcut to reveal the summarized data is «ALT + SHIFT + =» while the shortcut to hide the displayed outline data is «ALT + SHIFT + —«.
Since not all models are created alike or for the same audience, we recommend you go ahead and practice using these on your financial models to understand where and how to summarize data in a way that provides the best benefits to your specific use case.
Summarizing (Grouping) vs. Hiding data
There are many benefits to summarizing data in Excel. Think of the function «hide» as a subset of «group.» It provides a small implementation of the «group» but without all its benefits. Very often, hidden data is the cause of most errors while modifying or reusing spreadsheets.
While it is very annoying to deal with data you don’t need currently (yes, we know the frustration!), it is more annoying when your model throws out wrong outputs while presenting it to your seniors. Not being able to find what’s going wrong in high-pressure situations doesn’t usually help with finding a solution. Hence, you should never use the «hide» function to hide data in any spreadsheet.
Instead, using the «group» function, which can be used easily with the shortcut we have provided, should be your priority. It may be tempting to use «hide» when the amount of data required to be hidden is small, but remember, the fewer cells you hide, the bigger the problem. This is because finding one number missing in a sequence that runs to a few hundred is not easy and is the stuff of nightmares.
The video below from our Excel modeling course provides good instructions on how to use «group» like a pro and helps demonstrate the standards we help you achieve in your modeling journey.
In this tutorial, you will learn, how to make a group box and add option button for excel form controls.
Below is the sheet, i’ll be using for interest calculator.
Step 1:
We will use form controls. Form controls are advanced level features in excel that are hidden from normal users. So, we need to show developer tab in Ribbon. For that, we’ll right click in the blank area.

And select “Customize the Ribbon…” You’ll see the following window dialog.

You’ll find everything ticked except “Developer” option. Tick this option and Click “OK” to add Developer features to Ribbon.

Step 2:
Under Developer Tab, you’ll find insert option, that’ll be holding two types of controls.

Form Controls are used in excel forms, while ActiveX Controls are used with Visual Basic. I’ll use Form Controls here.
HOW TO USE COMBO BOX FROM EXCEL FORM CONTROL
I’ll use Group options for “Rate” and “Amount of Periods”. So, i’ll remove the row holding “Rate”. And insert two rows for Group Box.
Select Group box, and Move cursor to Row 6. Press Alt and Click & Hold mouse button and drag it to row 6 and 7 under Column A & B.

Change “Group box 4” Caption of group box by double tap on it and Write text to “Rate”.
Step 3:
Now we need to add Option button from Form Controls again. So i’ll select and insert them into Group box.

After Selecting Option Button from Form Control, Move mouse Cursor into Group Box, Press Ctrl and Draw with mouse button. It is the best practice and more professional to start from left side aligned.

Step 4:
To change the caption of Option box, Press Ctrl and Click on option to get focus and Click on Text to edit.

After changing caption of Option boxes, you need to check that clicking on one option box should diminish the other selection of option box. It means one option box should be selected at one time.
Step 5:
Now, you see the option boxes are not of same size. We can resize them equally by focusing and moving there edges with Mouse. But that is not so professional way to do as there will be some difference left. So we need to resize it using Format tool. Move cursor to any option button and get focus. Right click on it and select “Format Control”. You’ll get a window Dialog in front.

Note Height and Width of one Option button.
Step 6:
Now, Get focus of one option button and Press Ctrl and click on all Option buttons to select.

And Right click on “Format Object” option.

Enter those values you found in Step 5, in Height and Width. And you’ll see all option buttons in same size.
Step 7:
We need to align all the option buttons. So, again i’ll select all by selecting them by pressing Ctrl and Mouse click. And then Move to “Format” tab. And select “Aling Middle” in “Align” Option.

And then we’ll relocate them with equal gaps in between them by selecting “Distribute Horizontally” in “Align” Option.

You’ll get this group like

Step 8:
Same Steps to follow for “Amount for Periods”. You’ll get it like:

Share your reviews in the comment section and let me know