
Помогает получить текущие или архивные данные о ценных бумагах из сервиса «Google Финансы».
Пример использования
GOOGLEFINANCE("NASDAQ:GOOG"; "price"; ДАТА(2014;1;1); ДАТА(2014;12;31); "DAILY")
GOOGLEFINANCE("NASDAQ:GOOG"; "price"; СЕГОДНЯ()-30; СЕГОДНЯ())
GOOGLEFINANCE(A2; A3)
Синтаксис
GOOGLEFINANCE(код; [атрибут]; [дата_начала]; [дата_окончания|количество_дней]; [интервал])
-
ticker(тикер) – уникальный идентификационный код для ценных бумаг. Чтобы получать более точные результаты, обязательно указывайте название биржи и код. Например, вместо GOOG введите NASDAQ:GOOG.-
Если биржа не указана, при использовании функции
GOOGLEFINANCEоптимальный вариант будет подобран автоматически. -
Примечание. RIC-коды (Reuters Instrument Codes) больше не поддерживаются. Пример: используйте TSE:123 или ASX:XYZ вместо 123.TO и XYZ.AX.
-
-
attribute(атрибут) [ НЕОБЯЗАТЕЛЬНО, по умолчанию цена] – атрибут, значение которого требуется получить от Google Финансов.-
Параметр
attributeпринимает одно из следующих значений для данных реального времени:-
"price"(цена) – котировка цены в реальном времени. Возможна задержка до 20 минут. -
"priceopen"(цена_открытия) – цена на момент открытия торгов. -
"high"(макс_цена) – самая высокая цена за текущий день. -
"low"(мин_цена) – самая низкая цена за текущий день. -
"volume"(объем) – объем торгов за текущий день. -
"marketcap"(капитализация) – рыночная капитализация акций. -
"tradetime"(время_сделки) – время последней сделки. -
"datadelay"(задержка) – величина задержки при получении данных. -
"volumeavg"(средний_объем) – средний дневной объем торгов. -
"pe"(цена_прибыль) – соотношение цена/прибыль. -
"eps"(прибыль_на_акцию) – прибыль на одну акцию. -
"high52"(макс_цена_52) – максимальная цена за 52 недели. -
"low52"(мин_цена_52) – минимальная цена за 52 недели. -
"change"(изменение) – изменение цены со времени закрытия предыдущего торгового дня. -
"beta"(бета) – значение «бета». -
"changepct"(изменение_процент) – процентное изменение цены со времени закрытия предыдущего торгового дня. -
"closeyest"(цена_закрытия) – цена на момент закрытия предыдущего дня. -
"shares"(акции) – количество акций в обращении. -
"currency"(валюта) – валюта, в которой объявлена стоимость ценной бумаги. Валюты не имеют торговых периодов, поэтому аргумент не будет получать значенияopen,low,highиvolume.
-
-
Параметр
атрибутпринимает одно из следующих значений для ретроспективных данных:-
"open"(цена_открытия) – цена открытия для указанных дат. -
"close"(цена_закрытия) – цена закрытия для указанных дат. -
"high"(макс_цена) – максимальная цена для указанных дат. -
"low"(мин_цена) – минимальная цена для указанных дат. -
"volume"(объем) – объем для указанных дат. -
"all"(все) – все вышеперечисленное.
-
-
Параметр
атрибутпринимает одно из следующих значений для данных фонда взаимных инвестиций:-
"closeyest"(цена_закрытия) – цена на момент закрытия предыдущего дня. -
"date"(дата) – дата, когда стала известна стоимость чистых активов. -
"returnytd"(прибыль_за_год) – прибыль за год до текущей даты. -
"netassets"(чистые_активы) – чистые активы. -
"change"(изменение) – последнее и предпоследнее изменение величины чистых активов, о которых стало известно. -
"changepct"(изменение_процент) – процентное изменение стоимости чистых активов. -
"yieldpct"(доходность_процент) – сумма распределения доходов за последние 12 месяцев (от дивидендов по акциям и процентных платежей с фиксированным доходом) и доходов от стоимости чистых активов, поделенная на стоимость чистых активов за предыдущий месяц. -
"returnday"(доход_за_день) – общий доход за один день. -
"return1"(доход_1) – общий доход за одну неделю. -
"return4"(доход_4) – общий доход за четыре недели. -
"return13"(доход_13) – общий доход за тринадцать недель. -
"return52"(доход_52) – общий доход за 52 недели (1 год). -
"return156"(доход_156) – общий доход за 156 недель (3 года). -
"return260"(доход_260) – общий доход за 260 недель (5 лет). -
"incomedividend"(распределенные_средства) – объем последнего распределения денежных средств. -
"incomedividenddate"(дата_распределения) – дата последнего распределения денежных средств. -
"capitalgain"(распределение_капитала) – объем последнего распределения доходов от прироста капитала. -
"morningstarrating"(рейтинг_morning_star) – рейтинг Morningstar. -
"expenseratio"(коэффициент_расходов) – коэффициент расходов фонда.
-
-
-
start_date(дата_начала) – [НЕОБЯЗАТЕЛЬНО] – начальная дата при выборке ретроспективных данных.- Если указан параметр
дата_началаи не указан параметр дата_окончания|количество_дней, возвращаются данные только за один день.
- Если указан параметр
-
end_date|num_days(дата_окончания|количество_дней) – [НЕОБЯЗАТЕЛЬНО] – конечная дата для загрузки ретроспективных данных или количество дней от даты_начала, для которых нужно загрузить данные. -
interval(интервал) – [НЕОБЯЗАТЕЛЬНО] – периодичность загрузки данных; может принимать значения «DAILY» (ЕЖЕДНЕВНО) или «WEEKLY» (ЕЖЕНЕДЕЛЬНО).- Параметр
intervalтакже может быть задан при помощи чисел 1 или 7. Иные числовые значения не допускаются.
- Параметр
Примечания
Описанные данные не предназначены для профессионального использования специалистами сферы финансов и для использования сотрудниками фирм, занимающихся деятельностью другого рода. Это ограничение также распространяется на государственные органы. Если использовать функцию в профессиональных целях, сторонние поставщики данных могут взимать дополнительную плату за лицензию.
-
Все параметры должны быть заключены в кавычки или являться ссылками на ячейки с текстом.
Примечание. Исключением является случай, когда параметрintervalзадается при помощи чисел или параметрend_date|num_daysзадается в виде количества дней. -
Данные реального времени возвращаются в виде значений, расположенных в одной ячейке. Ретроспективные данные всегда возвращаются в виде раскрытого массива с заголовками столбцов.
-
Некоторые атрибуты могут не показывать результаты для всех символов.
- Если в функции уточнены даты, в ней могут использоваться только ретроспективные значения атрибутов.
-
Функция
GOOGLEFINANCEдоступна только на английском языке и не работает с большинством международных бирж. -
Статистику нельзя скачать и посмотреть, используя Sheets API или скрипт Apps Script. При попытке выполнить эти действия вы увидите ошибку #N/A в соответствующих ячейках.
-
Возможна задержка котировок до 20 минут. Информация предоставляется по принципу «как есть» исключительно в ознакомительных целях и не предназначена для использования в ходе торгов или для проведения консультаций.
-
Даты, заданные для функции
GOOGLEFINANCE, считаются указанными относительно полудня по всемирному координированному времени (UTC). Если биржа закрывается раньше, ее данные могут сместиться на один день.
Примеры
Создать копию
Примечание. Каждый пример приведен в отдельной вкладке.
Общее использование
Получение информации из Google Финансов о состоянии финансовых рынков.
Общие атрибуты
Ретроспективные данные о состоянии финансовых рынков
Получение ретроспективной информации из Google Финансов о состоянии финансовых рынков.
Паевые инвестиционные фонды
Общие атрибуты для паевых инвестиционных фондов.
Тенденции на рынке обмена валют
С помощью функции GOOGLEFINANCE в ячейке можно создавать диаграмму, отображающую тенденции на рынке обмена валют за последние 30 дней.
Эта информация оказалась полезной?
Как можно улучшить эту статью?
The GOOGLEFINANCE function is an amazing tool used to make Google Sheets stock formulas for people who need to work with real-time finance data. This single function gives you not only the current prices of stocks and conversion rates of currencies, but also historical data of these securities over days, weeks, months or years.
In this tutorial, we will show you how to use the GoogleFinance function to work with stocks as well as financial currency.
What Does the GOOGLEFINANCE Function do in Google Sheets?
The GOOGLEFINANCE function accepts a ticker symbol representing a particular security and returns the current or historical information relating to that security from Google Finance. You can use this function to fetch data about both stocks as well as currencies.
As such you can apply it to research investment opportunities, keep track of stock portfolio, convert between currencies, analyze and more. You can also use the fetched data to build visualizations, perform subsequent calculations and build dashboards.
A common use of this function is in computing the moving average for assets over a given time period. Similarly, you can use it to visualize trends in stock prices and make forecasts for the future in a Google finance spreadsheet.
Syntax for the GOOGLEFINANCE Function
The syntax to build a GOOGLEFINANCE formula goes as follows:
GOOGLEFINANCE(ticker, [attribute], [start_date], [end_date], [interval])
Here,
- ticker is the ticker symbol corresponding to the security that you want to fetch data for. It consists of initials that represent the security, along with the exchange symbol. For example, “NASDAQ:GOOG” represents Google stocks from the NASDAQ exchange. However, you could also simply use the symbol “GOOG” for this parameter. This is the only required Google finance syntax argument.
- The attribute parameter is a single string that specifies the data that you want to access relating to the given ticker. Some examples of attribute parameter strings include “price”, “high”, “low”, “volume”, etc. This is an optional parameter and its default value is “price”.
- start_date specifies the starting date from which you want your data fetched. This parameter is optional and you can use it when you want to fetch historical data relating to a ticker.
- end_date specifies the ending date up to which you want your data fetched. This parameter is also optional. Instead of a date, you can also specify the number of days from the start_date for which you want your data fetched.
- interval is also an optional parameter, and it is used when fetching historical data. This parameter specifies the intervals between dates fetched in your historical data. The parameter can be either “daily” or “weekly”. If you want the data in intervals of 2 days, 3 days, etc., you could specify a number between 1 and 7 for the interval parameter. Numbers other than these are not allowed.
GOOGLEFINACE Attributes
Google Finance in Google Sheets Standard Attributes
| “price” | The real-time price quote with up to 20 minutes delay. |
| “priceopen” | The opening price. |
| “high” | Current day’s high price. |
| “low” | Current day’s low price. |
| “volume” | Trading volume of the current day. |
| “marketcap” | Stock’s market capitalization. |
| “tradetime” | Time of the last trade. |
| “datadelay” | Shows the delay time of the real-time data. |
| “volumeavg” | This is the average daily trading volume. |
| “pe” | Price/earnings ratio. |
| “eps” | Earnings per share. |
| “high52” | The highest price over the past 52 weeks. |
| “low52” | The lowest price over the past 52 weeks. |
| “change” | The change in price since the end of the previous day’s trading. |
| “beta” | The beta value. |
| “changepct” | The percentage change in price since the end of the previous day’s trading. |
| “closeyest” | The closing price of the previous day. |
| “shares” | The number of outstanding shares. |
| “currency” | The currency in which the stock is priced in. |
Historical Data Attributes
| “open” | The opening price of a specific date. |
| “close” | The closing price of a specific date. |
| “high” | The high price of a specific date. |
| “low” | The low price of a specific date. |
| “volume” | The trading volume of a specific date. |
| “all” | Retrieves all the attributes above. |
GOOGLEFINANCE Attributes for Mutual Funds
| “closeyest” | The closing price of the previous day. |
| “date” | The net asset value’s reported date. |
| “returnytd” | The year-to-date return. |
| “netassets” | The net assets. |
| “change” | Change between the most recent and its previously reported net asset value. |
| “changepct” | The percentage change in the net asset value. |
| “yieldpct” | The distribution yield. |
| “returnday” | One-day total return. |
| “return1” | One-week total return. |
| “return4” | Four-week total return. |
| “return13” | Thirteen-week total return. |
| “return52” | Annual total return. |
| “return156” | 3-year total return. |
| “return260” | 5-year total return. |
| “incomedividend” | The most recent cash distribution amount. |
| “incomedividenddate” | The most recent cash distribution date. |
| “capitalgain” | The most recent capital gain distribution’s amount. |
| “morningstarrating” | The Morningstar “star” rating. |
| “expenseratio” | The fund’s expense ratio. |
How to Use the GOOGLEFINANCE Function
Now that we have explained the basic syntax of the GOOGLEFINANCE function, let us see how we can apply the function in different scenarios
Using the GOOGLEFINANCE Function to Work on Current Stocks Data
To use the GOOGLEFINANCE function. You just have to:
- Click on an empty cell
- Type =GOOGLEFINACE( into the cell
- Set the arguments you wish to use in the formula. You must at least include the ticker argument.
- Use a closing bracket and press enter
For example, let us apply the GOOGLEFINANCE functions to fetch the current price of a stock, say the Google stocks (from the NASDAQ exchange). The formula, in this case, will be:
=GOOGLEFINANCE(“NASDAQ:GOOG”)
Notice that the above formula has only the required parameter. We did not specify any of the optional parameters. This means the attribute parameter will have the default value of “price” and since all other parameters like start_date, end_date and interval are absent, the function understands that we only want the current price of the stock (no historical data).
Here’s the result we get:

Now let’s say you want to see other attributes relating to the stock, like the price, volume, highest and lowest rates for the current day. Then you have to mention the attribute you want in the second parameter, as shown in the screenshot below:

Here’s how we got the results for Price:
- Enter =GOOGLEFINANCE( into an empty cell E2 in this case
- Enter the ticker argument which is the cell reference $B$2″:”$B$3 in the example
- Enter a comma
- Enter attribute argument which is cell reference D2 in the example
So our total formula looks like this:
=GOOGLEFINANCE($B$2":"$B$3,D2)
Since we used absolute references for the ticker argument ($ symbols to indicate that reference doesn’t change when copying the formula), we can click and drag down the rest of the columns to make Google finance formulas with the fill handle.
Notice the first parameter in the formulae of the above screenshot. Since we are using two different cell references to compose the ticker parameter, we used a concatenation operator (&) to concatenate the reference containing the exchange (B2), followed by a colon (:), followed by the reference containing the security ticker symbol (B3).
In column D of the above screenshot, you can see some of the different attributes that can be used to fetch stock data for the current day used as cell references in the formula. But, you could also use the operator in the formula instead.
Using the GOOGLEFINANCE Sheets Function to Work on Historical Stocks Data
If you want historical data relating to a stock, you will need to mention the third and fourth parameters in the GOOGLEFINANCE function. Say you want the closing prices of 10 days starting from February 27, 2021. Your formula would then be:
=GOOGLEFINANCE(“NASDAQ:GOOG”,”close”,DATE(2021,2,27),10)
In the above formula, we specified the third parameter as the starting date, DATE(2021,2,27) and the fourth parameter as a number. So the GOOGLEFINANCE function knows that this is the number of days. If we specified a date value, GOOGLEFINANCE would take this as an ending date value rather than the number of days from the starting date.
When you press the return key, your result would look something like this:

Let’s use a more general-purpose version of the formula, so that you can customize it to your requirements:

Notice that we specified the attribute parameter as “all”, so the GOOGLEFINANCE function shows all 5 historical data attributes:
- Open
- High
- Low
- Close
- Volume
Moreover, since we specified the interval parameter as “daily”, the function returned daily data for 10 days starting from the given date (Feb 27, 2021), which makes 10 rows of data.
If instead of daily, you wanted to display the data in weekly intervals, you would get 2 rows of data, as shown below, since there are just 2 financial weeks in 10 days:

Using the GOOGLEFINANCE Function to Work with Currencies
The GOOGLEFINANCE function also lets you get current and historical conversion rates between a number of global currencies.
To get the conversion rate between two currencies, you need to specify this in the first parameter of the function as follows:
- The keyword “Currency”
- Followed by a colon (:)
- Followed by the ticker symbol of the currency you want to convert
- Followed by the ticker symbol of your target currency.
For example, the ticker symbol for US Dollars is USD while the ticker symbol for UK Pound is GBP (you can find these ticker symbols by searching on Google or by using a tool like Yahoo Finance).
To convert USD to GBP, your ticker symbol would be “Currency:USDGBP”. Note that the original currency should always come before the target currency.
The formula to get exchange rates to convert USD to GBP would then be:
=GOOGLEFINANCE(“Currency:USDGBP”)

If you want to use a more general-purpose version of the formula, you can customize it to your requirements as follows:

Notice we used two different cell references to compose the ticker parameter. We used a concatenation operator (&) to concatenate the keyword “Currency”, followed by a colon (:), followed by the reference containing the original currency symbol (B2) followed by the reference containing the target currency symbol (B3).
Now you have a formula that can fetch the conversion rate of any currency to any other currency.
If you want to use this formula to convert a value from one currency to another, or to build a simple currency converter, all you need to do is import the exchange rate and then multiply it with the value that you want to convert. An example of a currency converter is shown below:

Here, cell B5 contains the formula:
=B4*GOOGLEFINANCE("Currency:"&B2&B3)
This formula simply multiplies the original amount with the exchange rate of converting the currency in cell B2 to the currency in cell B3 (obtained by the GOOGLEFINANCE function).
You can replace the symbols in cells B2 and B3 with your required currency symbols.
Using the Google Sheets GOOGLEFINANCE Function to Import Historical Currency Exchange Rates
The GOOGLEFINANCE function can also help get historical exchange rates between two currencies over a period of time. This can give us information on how currencies have behaved in the past.
To get historical data about currency conversion rates, you will need to specify the second, third and fourth parameters too.
For example if you want to see historical exchange rates of converting US to GBP in the last 10 days, your formula would look like this:
=GOOGLEFINANCE(“Currency:USDGBP”,”price”,TODAY()-10,TODAY())

You can also generalize the formula as shown below:

You should now see two new columns returned by the function – dates and closing exchange rate for each day.
You could similarly see the data in weekly intervals, simply by adding the fifth parameter “weekly”:
Note: Currencies don’t have trading windows, so you will not get any data returned attributes open, low, high, and volume.
Google Fincance Functions Not Working?
The GOOGLEFINANCE function might sometimes not work and you might find it return an #N/A error. There is not much that you can do about this, as it is one of the limitations of the function.
In fact, this function is not meant for professional use. It is mainly targeted at casual Google Sheets users who want to simply track their portfolio stocks, do some simple market analysis, or convert between currencies.
In case you need market data for professional use (for example, if you are a financial industry professional or work for a government entity), you might need to purchase additional licensing from a third-party data provider.
Google Sheets Finance Functions FAQ
How Often Does the GOOGLEFINANCE Function Update in Google Sheets?
The GOOGLEFINANCE function updates approximately every 15 minutes.
Is the GOOGLEFINANCE Function Worth It?
It’s free tracking of your stock portfolio. Something that many people pay thousands of dollars a year for. While it may seem intimidating to use at first, once you know it, it’s a powerful tool.
Does GOOGLEFINANCE Have Crypto?
Yes you can pull data from the crypto market into Google Sheets with the GOOGLEFINANCE function. You just have to use the crpto pair name as the ticker argument. For example, for Bitcoin and USD you could use the following formula:
=GOOGLEFINANCE("BTCUSD")
Conclusion
In this tutorial, we showed you some examples of how to fetch current and historical market data using the GOOGLEFINANCE function. You can use the examples we used to build your own automated Google Finance Sheet. We tried to make this tutorial as detailed and clear as we could. We hope you find it useful.
Related Reading:
- How to Auto-Refresh Google Sheets Formulas (Updates Every 1-Minute)
- Free Google Sheets Ledger Template [and How to Use]
- 5 Useful Google Sheets Project Management Templates [Free]
- How to Convert Currency in Google Sheets (Google Finance Function)
- Google Sheets Notifications: How to Turn On, Edit & Remove
Here’s another method of getting stock prices into Excel. It’s part of a series: introduction and using MSN Money in Excel.
This time we’ll use the improved Query system in recent versions of Excel combined with data from Google Finance.
It’s a sad indictment of Microsoft Office that the best place to get stock data is Google.
Google’s version of Excel is Sheets and that has a nifty function that grabs stock prices right into the worksheet. Once you get the data into a Google Sheet, it can be automatically exported and grabbed by Excel.
It’s an indirect method but effective. Google’s GoogleFinance() function returns a lot of information about many global stocks and indexes. 18 different ‘attributes’ for each stock or index – too many to show in a single screen image (they’re listed later in this article).

To make this work, create a new Google Sheets from the online service (not the downloadable software). Go to Google Drive and make a new sheet.
Add to the sheet codes you want to look up, then a column with calls to GoogleFinance() to lookup those codes. For simplicity we’ll just lookup the price. We’ve added another column with the vital currency detail as well eg GoogleFinance(A3,’currency’)

Sheets works similarly to Excel for these operations. There’s an autocomplete in the function entry line and you can copy then paste to fill cells too.
Extra: you can view only the Sheet that Peter Deegan made for these examples at https://docs.google.com/spreadsheets/d/1ZPfVybR-8HNlo4qXjP14B5guXQiaFuw9iz3xOGgxdgY/edit?usp=sharing It’s a READ ONLY worksheet with editing not available, for obvious reasons. The usual 21st century disclaimers, use at your own risk etc.
Get full details on stock price integration with Excel in Real-Time Excel – get live stock prices, currency rates and more – less than US$12 or even a measly US$7 for Office-Watch.com subscribers (which is free).
Each column has a standard heading with the GoogleFinance() attribute in the 2nd row.
Once you have a simple sheet to start with, the next step is to publish it in a form that Excel can understand. Go to File | Publish to the Web
Choose the worksheet/tab you want to publish and select ‘Comma-separated values (.csv)’.

Make sure the ‘Automatically republish when changes are made’ option is on.
Copy the supplied link so you can use it in Excel. The link will download a .csv file with the data from the worksheet cells.
Switch to Excel (in this case Excel 2016 for Windows). Go to Data | New Query | From File | From CSV.

You’ll be presented with a standard File Open dialog but you don’t have to select a saved .csv file. Paste in the link from Google Sheets then click Open.

After a pause, Excel will show you what it’s downloaded and how it suggests dealing with the data. It should do an accurate job dealing with the incoming data.

Click Load and Excel will make a new worksheet for you.
Currency formatting
In the above example, you’ll see that the Sheets column was formatted with the correct symbols for each currency (Sterling and Euro).
Unfortunately, that doesn’t translate correctly. See the Sheets column on left and the Excel version on the right.

The solution is to change Sheets to Number format, with no currency symbols. Do any currency formatting in Excel.
Query Editor
The setup isn’t finished, right click on the query and choose Edit to fix a few things.

Make the first row of data into the column headings.

Change the sort order to put Symbols in alphabetical order. This makes them available for VLOOKUP() searches and a very welcome (ie overdue) inclusion in Excel.

Finally, go to Query | Properties and rename the query to something more helpful than the link text.
Click Close and Load to leave the Query Editor.
Now you have a ‘live’ data worksheet that you can use to lookup prices etc to insert into your own calculations.

Finding Stock Codes
Here’s how to find stock or index codes to use with the GoogleFinance() function.
Search Google Finance for companies across many different markets. The code will be in brackets after the company name.

For US companies, the market prefix (eg NYSE or NASDAQ) isn’t necessary. NYSE:WMT and WMT both work as do NASDAQ:MSFT and MSFT. But you might like to add it anyway, to distinguish the same company being listed on multiple exchanges.
International exchanges are also well represented. The exchange prefix is required.
London:

Frankfurt:

Hong Kong: number codes are used.

GoogleFinance()
If you just want the latest price, simply add the stock code eg GoogleFinance(“MSFT”) or GoogleFinance() function supports the following attributes to use with stock quotes. Use these in the second parameter of the function eg GoogleFinance(“MSFT”,”priceopen”):
- “price” – Realtime price quote, delayed by up to 20 minutes.
- “priceopen” – The price as of market open.
- “high” – The current day’s high price.
- “low” – The current day’s low price.
- “volume” – The current day’s trading volume.
- “marketcap” – The market capitalization of the stock.
- “tradetime” – The time of the last trade.
- “datadelay” – How far delayed the realtime data is.
- “volumeavg” – The average daily trading volume.
- “pe” – The price/earnings ratio.
- “eps” – The earnings per share.
- “high52” – The 52-week high price.
- “low52” – The 52-week low price.
- “change” – The price change since the previous trading day’s close.
- “beta” – The beta value.
- “changepct” – The percentage change in price since the previous trading day’s close.
- “closeyest” – The previous day’s closing price.
- “shares” – The number of outstanding shares.
- “currency” – The currency in which the security is priced.
Google Finance should have a ‘Long Name’ attribute so you can confirm that the stock code is returning the data you intend. That’s especially true for codes such as the Hong Kong bourse which are numbers, not letters.
The function also supports Mutual Funds and historical data check out the GoogleFinance() help page for full info.
The GOOGLEFINANCE function allows you to import real-time financial and currency market data straight into Google Sheets. As well as enabling you to track current stocks and shares information, it can also be used to retrieve historical securities data.
This function imports data from the Google Finance web application, which provides daily stock prices, news from the currency and financial markets, and other information on market trends. Google Finance can be accessed from the Google menu like all other Google applications, or simply by searching for a stock on Google, which will bring up the Google Finance information relating to that stock.
If an analyst wants to gather information on a stock, they would usually have to visit a financial market website or database to access a range of information. After carrying out research, the next step is to compile all that relevant stock information into a spreadsheet to prepare it for further number crunching or building financial models.
To do this, the analyst normally has to copy the stock information from the website and paste it into a spreadsheet or use customized scripts to pull in such information. The first approach is cumbersome, unreliable, and definitely not recommended. While the second method is faster, it also has drawbacks. Getting a coder to write a script is expensive and complex, and not very flexible if you need to make changes in the future.
A more reliable and economic alternative to both options is the GOOGLEFINANCE function. If you work with financial market data, this function can save you a serious amount of time, automating data retrieval for you.
Syntax
GOOGLEFINANCE(ticker, [attribute], [start_date], [num_days|end_date], [interval])
- ticker – This is an abbreviation used to uniquely identify publicly traded securities. It may consist of letters, numbers, or a combination of both. For example, AAPL and MSFT represent the tickers for Apple Inc. and Microsoft Corporation respectively. The ticker will tell the function which stock to provide information on. The exchange that the stock trades on can also be specified, which will help avoid discrepancies. For example, you could type “NASDAQ:AAPL”. Be sure to put quotation marks around the ticker (including the exchange if used).
- attribute – This is an optional parameter that specifies the type of information GOOGLEFINANCE function should fetch. There are a number of different outputs that are available such as price and earnings per share. Check out the full list below. The attribute input, like the ticker, is processed as text, so you’ll need to put quotation marks (“”) around the attribute you’re asking for. Please note, if you don’t enter any attribute, Google Sheets will retrieve Price information by default.
- start_date – This is used when accessing historical data on a stock, and it indicates the date from which the historical data needs fetching. This is an optional parameter – if you leave it blank, the function will provide information from today. If you specify the start_date but not the num_days|end_date parameter, then you’ll only receive data for that day.
- num_days|end_date – This optional parameter, along with the start_date, will indicate the time frame between which Google Sheets should fetch the stock information.
- interval – This is an optional parameter that indicates the frequency. The two possible inputs are “WEEKLY” and “DAILY”.
Attributes for the GOOGLEFINANCE function
| Attribute | Description |
|---|---|
| “price” | Stock price. In real-time but with a delay of up to 20 minutes. |
| “priceopen” | Opening price (price at market open). |
| “high” | High price of the current day. |
| “low” | Low price of the current day. |
| “volume” | The trading volume of the current day. |
| “marketcap” | The market capitalization of the stock. |
| “tradetime” | The time of the last trade of the stock. |
| “datadelay” | The delay time for the real-time data. |
| “volumeavg” | The average daily trading volume. |
| “pe” | Price-to-earnings ratio |
| “eps” | Earnings per share |
| “high52” | The highest price in the last 52 weeks. |
| “low52” | The lowest price in the last 52 weeks. |
| “change” | The stock price change since the end of yesterday’s trading. |
| “beta” | The beta value |
| “changepct” | The percentage change in price since the end of yesterday’s trading. |
| “closeyest” | Yesterday’s closing price. |
| “shares” | The number of shares outstanding. |
| “currency” | The currency that the stock is priced in. |
| Historical attribute | Description |
|---|---|
| “open” | Price at market open. |
| “close” | Price at market close. |
| “high” | The high price during the specified time period. |
| “low” | The low price during the specified time period. |
| “volume” | The volume during the specified time period. |
| “all” | Returns all of the above. |
For a complete list of all attributes including those for mutual fund data, head to Google’s GOOGLEFINANCE support page.
How to use the GOOGLEFINANCE function
1. Obtain stock information
Syntax: GOOGLEFINANCE(ticker, [attribute])
In the following examples, I have used “AAPL” (Apple Inc.) for the ticker.
Firstly, I visited the Google Finance website, and keyed in “AAPL” in the search box and hit the Enter key.
As a result, you can see all the current stock indicators for Apple Inc.

Here’s how that information looks in Google Sheets using the basic version of the function: GOOGLEFINANCE(ticker, [attribute]).
The GOOGLEFINANCE function pulls the corresponding information into the spreadsheet:

In the example above, I have listed the different attributes I want to look at in column A. I then reference these attributes in the formula, which allows me to quickly go down the list without having to change the formula every time.
Alternatively, I could also hardcode each attribute into the formula, for example by typing =GOOGLEFINANCE(“AAPL”,”Low”) to give me the low price of the day.

Note that I’ve fixed the location of the ticker reference cell B1 by putting the $ sign in front of the B and the 1 (using the F4 key on your keyboard is a shortcut).
By doing this, you can drag the formula down from cell D4 cell right down to D18, and the formula will keep this reference cell constant. I did not fix the location of the attribute cell, because I want this to change as I go down the list to get all the different attributes.
2. Obtain historical stock information for a single day
Syntax: GOOGLEFINANCE(ticker, [attribute], [start_date])
As listed in the table previously, Google Sheets provides a handful of historic data attributes like “open”, “close”, “high”, “low” etc.
While you could try them individually, I’ll explore the “all” attribute, which provides them all at once.
This will give the following result for the corresponding start_date:

Notice that the output of this historical attribute is more than one cell.
When calling up historical data, the formula will provide a Date column and an attribute column (in this case, because I used “all” to call up multiple attributes and I got 5 different attribute columns):
=GOOGLEFINANCE(“AAPL”,”all”,DATE(2017,2,27))
Please note: When calling up historical data you might see a #REF! error. This occurs when the GOOGLEFINANCE function encounters cells that already contain data. Here, the function would have to overwrite this data when it outputs its information over multiple cells.
To solve this error, just make sure there are enough empty cells below and beside the cell in which you’re entering the GOOGLEFINANCE formula, so that it has room to output its results over multiple cells.

The fact that the GOOGLEFINANCE formula fills multiple cells when providing historical information is usually helpful because it adds clarity to the information provided.
Sometimes, however, you may want the formula to only give you a single number.
For example, you might want the highest price of a stock on a given day, without the formula outputting a matrix including the date and the price. In this case, you would combine the GOOGLEFINANCE formula with the INDEX formula:
=INDEX(GOOGLEFINANCE(“AAPL”,”High”,date(2017,2,27)),2,2)

In this example, I have used the GOOGLEFINANCE formula to give me the highest price of Apple stock on February 27, 2017.
In the above screenshot, you can see that the output of the formula is a 2×2 matrix which gives the date and the high price.
If you want the formula to only give you the high price, without the cells that indicate the date and the headers, you can use the INDEX function and specify that you only want the formula to provide the information in the second row of the second column of the matrix that the GOOGLEFINANCE formula provides.
As you can see, I do this by adding INDEX to the start of the formula and then specifying cell 2,2 as the output I want.

3. Obtaining historical stock information over a period of time
Syntax: GOOGLEFINANCE(ticker, [attribute], [start_date], [end_date], [interval])
So far I’ve tried fetching the information corresponding to a single day. Can you do so for a period of time? Yes, you certainly can. Here’s an example.

The formula I use to do this is:
=GOOGLEFINANCE(“AAPL”,”Price”,date(2016,6,1),date(2016,12,31),”Weekly”)
From here, it’s easy to create a chart of the weekly closing price using the charting function in Google Sheets.
By using the GOOGLEFINANCE formula to call up different attributes over different time periods and intervals, you can create highly customizable data sets and charts that will help you analyze the stock data in many different ways.

4. Obtain YTD stock information
Another common need for users is to obtain the YTD (Year To Date) stock information. This allows you to see how the stock is performing from the beginning of the year until now. Unfortunately, the only attribute for YTD is returnytd, which can only be applied to mutual fund data. To find the YTD value for your real-time or historical data, we must find an alternative.
Luckily, we can find the YTD of stock by combining two specific formulas in one. Use the following syntax as your reference. Simply substitute the ticker with your own.
=(GOOGLEFINANCE(ticker,”price”)/INDEX(GOOGLEFINANCE(ticker,”close”,”01/01″, today()),2,2))-1
Here I’ve obtained the YTD price for Apple. My formula looks like this:
=(GOOGLEFINANCE(“AAPL”,”price”)/INDEX(GOOGLEFINANCE(“AAPL”,”close”,”01/01″, today()),2,2))-1

As you can see, by copying and pasting the formula above and substituting the ticker with my chosen stock, I have successfully returned the YTD value.
How to use the GOOGLEFINANCE function for Currency Conversion
Another helpful feature of the GOOGLEFINANCE function is the ability to get live currency conversion rates directly in your spreadsheets.
This can easily be done by replacing the stock ticker with “Currency:currency1currency2”, where currency1 and currency2 are the three-letter codes for the currencies you want to convert.
For example, to find the conversion rate between U.S dollars and Canadian dollars, I do the following:
=GOOGLEFINANCE(“CURRENCY:USDCAD”)

Googlefinance and Wisesheets
Two downsides of the GOOGLEFINANCE function are the lack of historical stock financials and real-time data. As you have learned, GOOGLEFINANCE is amazing but it does also have its limitations. If you are serious about stock investing and you want to save hours manually copy-pasting stock data the best way to do it is to use GOOGLEFINANCE and Wisesheets together.
With Wisesheets you can get the company’s financials including the income statement, balance sheet, cash flow, and key metrics for 14 different exchanges. It can bring a 20-year coverage quarterly or annually directly on your Excel or Google Sheets spreadsheet in one click.
All you need to do is enter the ticker in the add-on:
")
Another option to get the same information but filtered is by using the =WISE() function. All you need is the company ticker, parameter, and the period (year, quarter, or TTM).
You could for example get Apple’s revenue Q1 revenue for 2020 by using the function like this:
=WISE(“AAPL”,”Revenue”,”2020″,”Q1″)
When you use the GOOGLEFINANCE function and Wisesheets together, you can create dynamic stock analysis models and get all the financial data you need immediately.

Get the add-on here: Wisesheets
Stock reporting in Google Sheets
If you work with stock market and currency data, GOOGLEFINANCE function is a huge time-saver when working in Google Sheets. Experiment with the different attributes and find out what works for you!
Need to collate financial data from multiple Google Sheets into a central file for reporting or analysis? Discover how to merge multiple Google Sheets into one.
Editor’s note: This is a revised version of a previous post that has been updated for accuracy and comprehensiveness.
Содержание
- Функция GOOGLEFINANCE для загрузки котировок акций и курсов валют
- Валюты
- Акции
- Excel: stock prices from Google Finance
- Share:
- Currency formatting
- Query Editor
- Finding Stock Codes
- GoogleFinance()
- How to Visualize Financial Data With Google Finance API, Google Sheets & Tableau
- Greg Rossi, Raul Garcia
- Analyzing Google Finance with Google Sheets
- Build the Tableau Visualization!
- Additional Resources
- What is Google Finance and Google Finance API?
- What is Google Finance API?
- How to use Google Sheets with Google Finance?
- Live Connect to Google Sheets with Tableau
- What’s Next? Embedded Analytics
Функция GOOGLEFINANCE для загрузки котировок акций и курсов валют
Обсудим функцию GOOGLEFINANCE, которая позволяет загружать в Таблицы котировки акций и курсы валют — как в динамике, так и на текущий момент.
Валюты
Для получения биржевого курса достаточно ввести два трехбуквенных кода валют внутри этой функции. Например, “USDRUB”:
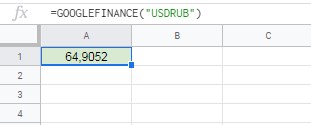
USDRUB — текстовое значение, мы указываем его в кавычках внутри функции.
Более наглядно будет указывать коды валют в ячейках и объединять их в такую конструкцию с помощью амперсанда (символа, который соединяет несколько текстовых значений).
Такую функцию можно протянуть и сразу получить результат в нескольких валютных парах.
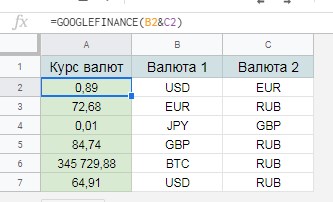
Объединение кодов валют из ячеек внутри функции GOOGLEFINANCE (BTC — это код биткоина)
Чтобы загрузить курс валюты за определенный период, нужно добавить аргументов — помимо кода валюты, указать второй аргумент “PRICE” и даты начала и окончания периода (третий и четвертый аргументы):
Или сослаться на ячейки с кодами валют и датами:
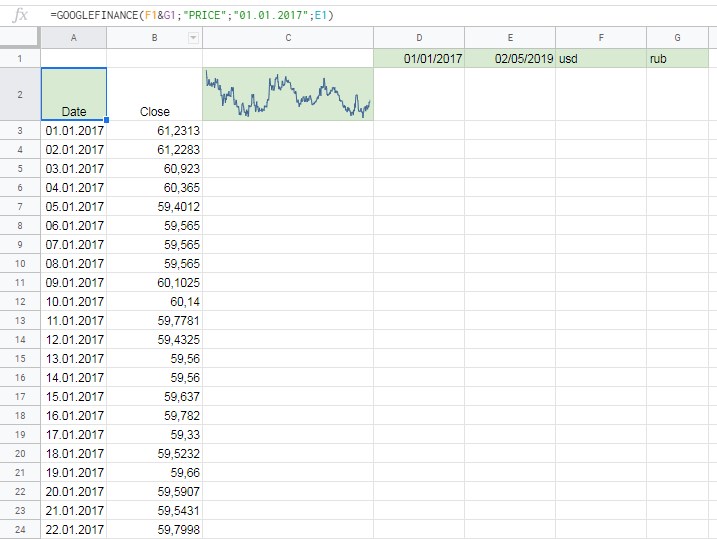
Получили информацию о курсе валюты за длительный период. Формат вывода результатов — два столбца, с датой и курсом.
Отметим, что график (спарклайн) в ячейке C2 сформирован с помощью функции SPARKLINE, которую мы будем обсуждать позднее в курсе. Здесь график добавлен для наглядности.
Акции
Для получения информации об акциях нужно использовать вместо двух кодов валют тикер, четырехбуквенный код — например, AAPL для акций компании Apple.
В случае с акциями функция может загрузить большое количество параметров — цену открытия, цену закрытия, самую низкую или высокую цену за день, объем торгов, капитализацию компании и много других — все они перечислены в справке.
Тикер указывается в первом аргументе функции. Параметр указывается во втором аргументе функции.
Соответственно, следующая функция
Будет возвращать объемы торгов акциями Apple с первого января 2017 по 1 февраля 2019 года.
Все аргументы — тикер, параметры и даты — можно указывать как в самой функции, так и в ячейках, на которые вы будете из функции ссылаться.
В следующем примере мы получаем максимальные цены дня по Apple за период с 1 января 2014 по 19 февраля 2019 года. Все параметры мы получаем из ячеек, на которые ссылаемся из функции:
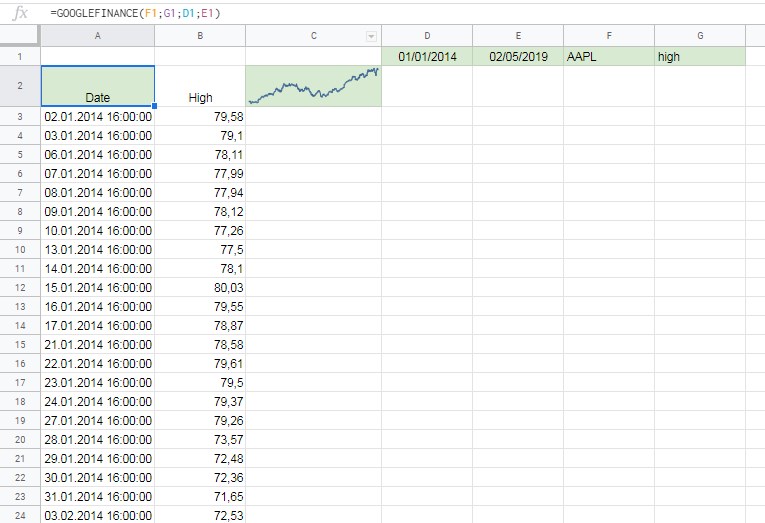
Загружаем максимальные цены (high) по акциям с помощью GOOGLEFINANCE
Источник
Excel: stock prices from Google Finance
Here’s another method of getting stock prices into Excel. It’s part of a series: introduction and using MSN Money in Excel.
This time we’ll use the improved Query system in recent versions of Excel combined with data from Google Finance.
It’s a sad indictment of Microsoft Office that the best place to get stock data is Google.
Google’s version of Excel is Sheets and that has a nifty function that grabs stock prices right into the worksheet. Once you get the data into a Google Sheet, it can be automatically exported and grabbed by Excel.
It’s an indirect method but effective. Google’s GoogleFinance() function returns a lot of information about many global stocks and indexes. 18 different ‘attributes’ for each stock or index – too many to show in a single screen image (they’re listed later in this article).
To make this work, create a new Google Sheets from the online service (not the downloadable software). Go to Google Drive and make a new sheet.
Add to the sheet codes you want to look up, then a column with calls to GoogleFinance() to lookup those codes. For simplicity we’ll just lookup the price. We’ve added another column with the vital currency detail as well eg GoogleFinance(A3,’currency’)
Sheets works similarly to Excel for these operations. There’s an autocomplete in the function entry line and you can copy then paste to fill cells too.
Extra: you can view only the Sheet that Peter Deegan made for these examples at https://docs.google.com/spreadsheets/d/1ZPfVybR-8HNlo4qXjP14B5guXQiaFuw9iz3xOGgxdgY/edit?usp=sharing It’s a READ ONLY worksheet with editing not available, for obvious reasons. The usual 21 st century disclaimers, use at your own risk etc.
Get full details on stock price integration with Excel in Real-Time Excel – get live stock prices, currency rates and more – less than US$12 or even a measly US$7 for Office-Watch.com subscribers (which is free).
Each column has a standard heading with the GoogleFinance() attribute in the 2 nd row.
Once you have a simple sheet to start with, the next step is to publish it in a form that Excel can understand. Go to File | Publish to the Web
Choose the worksheet/tab you want to publish and select ‘Comma-separated values (.csv)’.
Make sure the ‘Automatically republish when changes are made’ option is on.
Copy the supplied link so you can use it in Excel. The link will download a .csv file with the data from the worksheet cells.
Switch to Excel (in this case Excel 2016 for Windows). Go to Data | New Query | From File | From CSV.
You’ll be presented with a standard File Open dialog but you don’t have to select a saved .csv file. Paste in the link from Google Sheets then click Open.
After a pause, Excel will show you what it’s downloaded and how it suggests dealing with the data. It should do an accurate job dealing with the incoming data.
Click Load and Excel will make a new worksheet for you.
Currency formatting
In the above example, you’ll see that the Sheets column was formatted with the correct symbols for each currency (Sterling and Euro).
Unfortunately, that doesn’t translate correctly. See the Sheets column on left and the Excel version on the right.
The solution is to change Sheets to Number format, with no currency symbols. Do any currency formatting in Excel.
Query Editor
The setup isn’t finished, right click on the query and choose Edit to fix a few things.
Make the first row of data into the column headings.
Change the sort order to put Symbols in alphabetical order. This makes them available for VLOOKUP() searches and a very welcome (ie overdue) inclusion in Excel.
Finally, go to Query | Properties and rename the query to something more helpful than the link text.
Click Close and Load to leave the Query Editor.
Now you have a ‘live’ data worksheet that you can use to lookup prices etc to insert into your own calculations.
Finding Stock Codes
Here’s how to find stock or index codes to use with the GoogleFinance() function.
Search Google Finance for companies across many different markets. The code will be in brackets after the company name.
For US companies, the market prefix (eg NYSE or NASDAQ) isn’t necessary. NYSE:WMT and WMT both work as do NASDAQ:MSFT and MSFT. But you might like to add it anyway, to distinguish the same company being listed on multiple exchanges.
International exchanges are also well represented. The exchange prefix is required.
London:
Frankfurt:
Hong Kong: number codes are used.

GoogleFinance()
If you just want the latest price, simply add the stock code eg GoogleFinance(“MSFT”) or GoogleFinance() function supports the following attributes to use with stock quotes. Use these in the second parameter of the function eg GoogleFinance(“MSFT”,”priceopen”):
- “price” – Realtime price quote, delayed by up to 20 minutes.
- “priceopen” – The price as of market open.
- “high” – The current day’s high price.
- “low” – The current day’s low price.
- “volume” – The current day’s trading volume.
- “marketcap” – The market capitalization of the stock.
- “tradetime” – The time of the last trade.
- “datadelay” – How far delayed the realtime data is.
- “volumeavg” – The average daily trading volume.
- “pe” – The price/earnings ratio.
- “eps” – The earnings per share.
- “high52” – The 52-week high price.
- “low52” – The 52-week low price.
- “change” – The price change since the previous trading day’s close.
- “beta” – The beta value.
- “changepct” – The percentage change in price since the previous trading day’s close.
- “closeyest” – The previous day’s closing price.
- “shares” – The number of outstanding shares.
- “currency” – The currency in which the security is priced.
Google Finance should have a ‘Long Name’ attribute so you can confirm that the stock code is returning the data you intend. That’s especially true for codes such as the Hong Kong bourse which are numbers, not letters.
The function also supports Mutual Funds and historical data check out the GoogleFinance() help page for full info.
Источник
How to Visualize Financial Data With Google Finance API, Google Sheets & Tableau
Looking for an innovative solution to monitor financial data? Learn how to visualize the data with Google Finance API, Google Sheets, and Tableau 2020.2
Greg Rossi, Raul Garcia

Tableau 2020.2 was a substantial release with new features like Relationships, Metrics, and Set Controls. Personally, until I am presented the opportunity to apply my skills and use these features, it never fully sets in. The below video and corresponding dashboard are just that, a workshop to help learn the new features while also building something useful in the process!
Need help upgrading your Tableau Server to the latest version? Our certified Tableau Server experts can help!
Analyzing Google Finance with Google Sheets
In the following tutorial, you’ll be presented with a tutorial geared toward building a ‘Market Watch’ dashboard with Tableau 2020.2.
You will also learn things like:
- How to build an automated data pipeline
- How to use Google Finance API
- How to build a live data stream with Google Finance API and Google Sheets
- How to live connect to Google Sheets
- Tableau 2020.2 features (Relationships, Metrics, Set Controls)
- Tableau dashboarding tips and tricks
If you successfully complete this tutorial, you will produce something that resembles:
Leverage this tutorial to build your own Market Watch-style dashboard with companies that you care about, and embed it into a web page like above!
Build the Tableau Visualization!
Additional Resources
- PPT presentation: https://drive.google.com/file/d/1T7BWCkQV2zsyng2OWn-Yy04iRfhkoY6B/view?usp=sharing
- Google Finance Data: https://docs.google.com/spreadsheets/d/1hcso8qRQ7JWBcLBPPIosu1Y9iqqfF8HhrsrmogW2iug/edit?usp=sharing
- Dashboard on Tableau Public: https://public.tableau.com/profile/greg.rossi#!/vizhome/ExampleWorkbook-MarketWatch/MarketWatch
What is Google Finance and Google Finance API?
Part of the Google family of websites, Google Finance debuted in 2006. It competes with many other financial websites, including Yahoo! Finance and MSN Money.
Google Finance is a tool that reflects up-to-date market information and news. It’s implemented with the Google Search engine, so if you look up information like AAPL or Walmart for Apple, you will see an up-to-date stock quote and security data from the past. When you check out one of these stocks, it takes you to the company’s Google Finance page, which provides an overview of the company’s news, finances, and allows you to make comparisons with other commodities.
Even though there are better tools to track security, Google Finance is unique because it is the only one to integrate with Google Sheets. This has become a significant game-changer for both novice and experienced stock traders because the integration is convenient to import and observe stock information in a spreadsheet. Keep in mind that Google Finance sheet integration is only offered in English and not in other languages, so it may not be a good option if you want to do any transaction on European or Asian exchanges.
In a nutshell, Google Finance helps individuals monitor their financial portfolios, provides up to date news, and provides information related to Wall Street.
What is Google Finance API?
An API (Application Programming Interface) is a set of programming code that sends instructions between one software platform to another, parses responses, and queries data. If you combine this with Google Finance, then you definitely got something special.
The Google Finance API allows you to leverage historical securities data from Google Finance so that you can build customized analysis. The Google Finance API exposes a variety of endpoints ranging from public company names/tickers to daily share prices, market capitalization, highs, lows, trading volume, and more! It can even make REST requests and return the desired data in JSON format.
How to use Google Sheets with Google Finance?
To fetch Google Finance Data from the exposed API endpoints and keep the data fresh, you will likely want to leverage Google Sheets. Google Sheets allow you to make direct calls to Google Finance and build a data table from a variety of attributes.
The standard syntax for fetching data will look something like:
GOOGLEFINANCE(«NASDAQ:GOOG», «price», DATE(2014,1,1), DATE(2014,12,31), «DAILY»)
Google does a nice job of explaining the syntax and attributes in this document. By following the above tutorial, you will be provided with some pre-built tables/examples and how to leverage the Google Finance API.
Live Connect to Google Sheets with Tableau
After you have built your finance data table, you can then use Tableau to live connect to the Google Sheets and begin your visual analysis. The live connection will maintain a relative level of freshness and also allow you to publish the dashboard to your Tableau Server or Tableau Public.
What’s Next? Embedded Analytics
Although it was not included in this tutorial, the next practical step after the dashboard has been published would be embedding it into another application or your own application! Don’t miss our tutorial on how to embed a dashboard into a web page!
Источник