
The Google Sheets API is a RESTful interface that lets you read and modify a
spreadsheet’s data. The most common uses of this API include the following
tasks:
- Create spreadsheets
- Read and write spreadsheet cell values
- Update spreadsheet formatting
- Manage Connected Sheets
Below is a list of common terms used in the Sheets API:
- Spreadsheet
-
The primary object in Google Sheets that can contain multiple sheets, each
with structured information contained in cells. A
Spreadsheet resource represents every spreadsheet and has a
uniquespreadsheetIdvalue,
containing letters, numbers, hyphens, or underscores. You can find the
spreadsheet ID in a Google Sheets URL:https://docs.google.com/spreadsheets/d/spreadsheetId/edit#gid=0 - Sheet
-
A page or tab within a spreadsheet. A
Sheet resource represents each sheet and has
a unique title and numeric
sheetIdvalue. You
can find the sheet ID in a Google Sheets URL:https://docs.google.com/spreadsheets/d/aBC-123_xYz/edit#gid=sheetId - Cell
-
An individual field of text or data within a sheet. Cells are arranged in
rows and columns, and can be grouped as a range of cells. A
CellData resource represents each cell, but
it doesn’t have a unique ID value. Instead, row
and column coordinates identify the cells.- A1 notation
-
A syntax used to define a cell or range of cells with a string that
contains the sheet name plus the starting and ending cell coordinates using
column letters and row numbers. This method is the most common and useful
when referencing an absolute range of cells.Show examples
Sheet1!A1:B2refers to the first two cells in the top two rows of Sheet1.Sheet1!A:Arefers to all the cells in the first column of Sheet1.Sheet1!1:2refers to all the cells in the first two rows of Sheet1.Sheet1!A5:Arefers to all the cells of the first column of Sheet 1, from row 5 onward.A1:B2refers to the first two cells in the top two rows of the first visible sheet.Sheet1refers to all the cells in Sheet1.'My Custom Sheet'!A:Arefers to all the cells in the first column of a sheet named «My Custom Sheet.» Single quotes are required for sheet names with spaces, special characters, or an alphanumeric combination.'My Custom Sheet'refers to all the cells in ‘My Custom Sheet’.
Tip: Where possible, use distinct names for the objects within your spreadsheets. For example, A1 refers to the cell A1 in the first visible sheet, whereas ‘A1’ refers to all the cells in a sheet named A1. Similarly, Sheet1 refers to all the cells in Sheet1. However, if there’s a named range titled «Sheet1», then Sheet1 refers to the named range and ‘Sheet1’ refers to the sheet.
- R1C1 notation
-
A syntax used to define a cell or range of cells with a string that
contains the sheet name plus the starting and ending cell coordinates using
row numbers and column numbers. This method is less common than A1 notation, but can be
useful when referencing a range of cells relative to a given cell’s
position.Show examples
Sheet1!R1C1:R2C2refers to the first two cells in the top two rows of Sheet1.R1C1:R2C2refers to the first two cells in the top two rows of the first visible sheet.Sheet1!R[3]C[1]refers to the cell that is three rows below and one column to the right of the current cell.
- Named range
-
A defined cell or range of cells with a custom name to simplify
references throughout an application. A
FilterView resource represents a named range. - Protected range
-
A defined cell or range of cells that cannot be modified. A
ProtectedRange resource represents a protected range.
Next steps
-
To learn about developing with Google Workspace APIs, including handling
authentication and authorization, refer to
Develop on Google Workspace. -
To learn how to configure and run a simple Sheets API app, read the
Quickstarts overview.
Sheet
A sheet in a spreadsheet.
| JSON representation |
|---|
{ "properties": { object ( |
| Fields | |
|---|---|
|
SheetProperties The properties of the sheet. |
|
GridData Data in the grid, if this is a grid sheet.
The number of GridData objects returned is dependent on the number of ranges requested on this sheet. For example, if this is representing startRow startColumn
For a DATA_SOURCE |
|
GridRange The ranges that are merged together. |
|
ConditionalFormatRule The conditional format rules in this sheet. |
|
FilterView The filter views in this sheet. |
|
ProtectedRange The protected ranges in this sheet. |
|
BasicFilter The filter on this sheet, if any. |
|
EmbeddedChart The specifications of every chart on this sheet. |
|
BandedRange The banded (alternating colors) ranges on this sheet. |
|
DeveloperMetadata The developer metadata associated with a sheet. |
|
DimensionGroup All row groups on this sheet, ordered by increasing range start index, then by group depth. |
|
DimensionGroup All column groups on this sheet, ordered by increasing range start index, then by group depth. |
|
Slicer The slicers on this sheet. |
SheetProperties
Properties of a sheet.
| JSON representation |
|---|
{ "sheetId": integer, "title": string, "index": integer, "sheetType": enum ( |
| Fields | |
|---|---|
|
The ID of the sheet. Must be non-negative. This field cannot be changed once set. |
|
The name of the sheet. |
|
The index of the sheet within the spreadsheet. When adding or updating sheet properties, if this field is excluded then the sheet is added or moved to the end of the sheet list. When updating sheet indices or inserting sheets, movement is considered in «before the move» indexes. For example, if there were 3 sheets (S1, S2, S3) in order to move S1 ahead of S2 the index would have to be set to 2. A sheet index update request is ignored if the requested index is identical to the sheets current index or if the requested new index is equal to the current sheet index + 1. |
|
SheetType
The type of sheet. Defaults to GRID |
|
GridProperties Additional properties of the sheet if this sheet is a grid. (If the sheet is an object sheet, containing a chart or image, then this field will be absent.) When writing it is an error to set any grid properties on non-grid sheets.
If this sheet is a DATA_SOURCE rowCount |
|
True if the sheet is hidden in the UI, false if it’s visible. |
|
Color
The color of the tab in the UI. Deprecated: Use tabColorStyle |
|
ColorStyle
The color of the tab in the UI. If tabColor |
|
True if the sheet is an RTL sheet instead of an LTR sheet. |
|
DataSourceSheetProperties
Output only. If present, the field contains DATA_SOURCE |
SheetType
The kind of sheet.
| Enums | |
|---|---|
|
Default value, do not use. |
|
The sheet is a grid. |
|
The sheet has no grid and instead has an object like a chart or image. |
|
The sheet connects with an external
and shows the preview of data. |
GridProperties
Properties of a grid.
| JSON representation |
|---|
{ "rowCount": integer, "columnCount": integer, "frozenRowCount": integer, "frozenColumnCount": integer, "hideGridlines": boolean, "rowGroupControlAfter": boolean, "columnGroupControlAfter": boolean } |
| Fields | |
|---|---|
|
The number of rows in the grid. |
|
The number of columns in the grid. |
|
The number of rows that are frozen in the grid. |
|
The number of columns that are frozen in the grid. |
|
True if the grid isn’t showing gridlines in the UI. |
|
True if the row grouping control toggle is shown after the group. |
|
True if the column grouping control toggle is shown after the group. |
DataSourceSheetProperties
Additional properties of a
DATA_SOURCE
sheet.
| JSON representation |
|---|
{ "dataSourceId": string, "columns": [ { object ( |
| Fields | |
|---|---|
|
ID of the DataSource |
|
DataSourceColumn
The columns displayed on the sheet, corresponding to the values in RowData |
|
DataExecutionStatus The data execution status. |
GridData
Data in the grid, as well as metadata about the dimensions.
| JSON representation |
|---|
{ "startRow": integer, "startColumn": integer, "rowData": [ { object ( |
| Fields | |
|---|---|
|
The first row this GridData refers to, zero-based. |
|
The first column this GridData refers to, zero-based. |
|
RowData
The data in the grid, one entry per row, starting with the row in startRow. The values in RowData will correspond to columns starting at startColumn |
|
DimensionProperties
Metadata about the requested rows in the grid, starting with the row in startRow |
|
DimensionProperties
Metadata about the requested columns in the grid, starting with the column in startColumn |
RowData
Data about each cell in a row.
| JSON representation |
|---|
{
"values": [
{
object (
|
| Fields | |
|---|---|
|
CellData The values in the row, one per column. |
DimensionProperties
Properties about a dimension.
| JSON representation |
|---|
{ "hiddenByFilter": boolean, "hiddenByUser": boolean, "pixelSize": integer, "developerMetadata": [ { object ( |
| Fields | |
|---|---|
|
True if this dimension is being filtered. This field is read-only. |
|
True if this dimension is explicitly hidden. |
|
The height (if a row) or width (if a column) of the dimension in pixels. |
|
DeveloperMetadata The developer metadata associated with a single row or column. |
|
DataSourceColumnReference Output only. If set, this is a column in a data source sheet. |
ConditionalFormatRule
A rule describing a conditional format.
| JSON representation |
|---|
{ "ranges": [ { object ( |
| Fields | |
|---|---|
|
GridRange The ranges that are formatted if the condition is true. All the ranges must be on the same grid. |
Union field. The rule controlling this conditional format, exactly one must be set. can be only one of the following: |
|
|
BooleanRule The formatting is either «on» or «off» according to the rule. |
|
GradientRule The formatting will vary based on the gradients in the rule. |
BooleanRule
A rule that may or may not match, depending on the condition.
| JSON representation |
|---|
{ "condition": { object ( |
| Fields | |
|---|---|
|
BooleanCondition The condition of the rule. If the condition evaluates to true, the format is applied. |
|
CellFormat
The format to apply. Conditional formatting can only apply a subset of formatting: bold italic strikethrough foreground color background color |
GradientRule
A rule that applies a gradient color scale format, based on the interpolation points listed. The format of a cell will vary based on its contents as compared to the values of the interpolation points.
| JSON representation |
|---|
{ "minpoint": { object ( |
| Fields | |
|---|---|
|
InterpolationPoint The starting interpolation point. |
|
InterpolationPoint An optional midway interpolation point. |
|
InterpolationPoint The final interpolation point. |
InterpolationPoint
A single interpolation point on a gradient conditional format. These pin the gradient color scale according to the color, type and value chosen.
| JSON representation |
|---|
{ "color": { object ( |
| Fields | |
|---|---|
|
Color
The color this interpolation point should use. Deprecated: Use colorStyle |
|
ColorStyle
The color this interpolation point should use. If color |
|
InterpolationPointType How the value should be interpreted. |
|
The value this interpolation point uses. May be a formula. Unused if type MIN MAX |
InterpolationPointType
The kind of interpolation point.
| Enums | |
|---|---|
|
The default value, do not use. |
|
The interpolation point uses the minimum value in the cells over the range of the conditional format. |
|
The interpolation point uses the maximum value in the cells over the range of the conditional format. |
|
The interpolation point uses exactly the value in
. |
|
The interpolation point is the given percentage over all the cells in the range of the conditional format. This is equivalent to |
|
The interpolation point is the given percentile over all the cells in the range of the conditional format. This is equivalent toif the value was: (where errors in the range are ignored when flattening). |
FilterView
A filter view.
| JSON representation |
|---|
{ "filterViewId": integer, "title": string, "range": { object ( |
| Fields | |
|---|---|
|
The ID of the filter view. |
|
The name of the filter view. |
|
GridRange The range this filter view covers.
When writing, only one of range namedRangeId |
|
The named range this filter view is backed by, if any.
When writing, only one of range namedRangeId |
|
SortSpec The sort order per column. Later specifications are used when values are equal in the earlier specifications. |
|
FilterCriteria The criteria for showing/hiding values per column. The map’s key is the column index, and the value is the criteria for that column.
This field is deprecated in favor of filterSpecs |
|
FilterSpec The filter criteria for showing/hiding values per column.
Both criteria filterSpecs |
ProtectedRange
A protected range.
| JSON representation |
|---|
{ "protectedRangeId": integer, "range": { object ( |
| Fields | |
|---|---|
|
The ID of the protected range. This field is read-only. |
|
GridRange The range that is being protected. The range may be fully unbounded, in which case this is considered a protected sheet.
When writing, only one of range namedRangeId |
|
The named range this protected range is backed by, if any.
When writing, only one of range namedRangeId |
|
The description of this protected range. |
|
True if this protected range will show a warning when editing. Warning-based protection means that every user can edit data in the protected range, except editing will prompt a warning asking the user to confirm the edit.
When writing: if this field is true, then editors |
|
True if the user who requested this protected range can edit the protected area. This field is read-only. |
|
GridRange The list of unprotected ranges within a protected sheet. Unprotected ranges are only supported on protected sheets. |
|
Editors
The users and groups with edit access to the protected range. This field is only visible to users with edit access to the protected range and the document. Editors are not supported with warningOnly |
Editors
The editors of a protected range.
| JSON representation |
|---|
{ "users": [ string ], "groups": [ string ], "domainUsersCanEdit": boolean } |
| Fields | |
|---|---|
|
The email addresses of users with edit access to the protected range. |
|
The email addresses of groups with edit access to the protected range. |
|
True if anyone in the document’s domain has edit access to the protected range. Domain protection is only supported on documents within a domain. |
BasicFilter
The default filter associated with a sheet.
| JSON representation |
|---|
{ "range": { object ( |
| Fields | |
|---|---|
|
GridRange The range the filter covers. |
|
SortSpec The sort order per column. Later specifications are used when values are equal in the earlier specifications. |
|
FilterCriteria The criteria for showing/hiding values per column. The map’s key is the column index, and the value is the criteria for that column.
This field is deprecated in favor of filterSpecs |
|
FilterSpec The filter criteria per column.
Both criteria filterSpecs |
BandedRange
A banded (alternating colors) range in a sheet.
| JSON representation |
|---|
{ "bandedRangeId": integer, "range": { object ( |
| Fields | |
|---|---|
|
The id of the banded range. |
|
GridRange The range over which these properties are applied. |
|
BandingProperties
Properties for row bands. These properties are applied on a row-by-row basis throughout all the rows in the range. At least one of rowProperties columnProperties |
|
BandingProperties
Properties for column bands. These properties are applied on a column- by-column basis throughout all the columns in the range. At least one of rowProperties columnProperties |
BandingProperties
Properties referring a single dimension (either row or column). If both
BandedRange.row_properties
and
BandedRange.column_properties
are set, the fill colors are applied to cells according to the following rules:
-
headerColor
and
footerColor
take priority over band colors. -
firstBandColor
takes priority over
secondBandColor
. -
rowProperties
takes priority over
columnProperties
.
For example, the first row color takes priority over the first column color, but the first column color takes priority over the second row color. Similarly, the row header takes priority over the column header in the top left cell, but the column header takes priority over the first row color if the row header is not set.
| JSON representation |
|---|
{ "headerColor": { object ( |
| Fields | |
|---|---|
|
Color
The color of the first row or column. If this field is set, the first row or column is filled with this color and the colors alternate between firstBandColor secondBandColor firstBandColor headerColorStyle |
|
ColorStyle
The color of the first row or column. If this field is set, the first row or column is filled with this color and the colors alternate between firstBandColor secondBandColor firstBandColor headerColor |
|
Color
The first color that is alternating. (Required) Deprecated: Use firstBandColorStyle |
|
ColorStyle
The first color that is alternating. (Required) If firstBandColor |
|
Color
The second color that is alternating. (Required) Deprecated: Use secondBandColorStyle |
|
ColorStyle
The second color that is alternating. (Required) If secondBandColor |
|
Color
The color of the last row or column. If this field is not set, the last row or column is filled with either firstBandColor secondBandColor footerColorStyle |
|
ColorStyle
The color of the last row or column. If this field is not set, the last row or column is filled with either firstBandColor secondBandColor footerColor |
DimensionGroup
A group over an interval of rows or columns on a sheet, which can contain or be contained within other groups. A group can be collapsed or expanded as a unit on the sheet.
| JSON representation |
|---|
{
"range": {
object (
|
| Fields | |
|---|---|
|
DimensionRange The range over which this group exists. |
|
The depth of the group, representing how many groups have a range that wholly contains the range of this group. |
|
This field is true if this group is collapsed. A collapsed group remains collapsed if an overlapping group at a shallower depth is expanded. A true value does not imply that all dimensions within the group are hidden, since a dimension’s visibility can change independently from this group property. However, when this property is updated, all dimensions within it are set to hidden if this field is true, or set to visible if this field is false. |
Slicer
A slicer in a sheet.
| JSON representation |
|---|
{ "slicerId": integer, "spec": { object ( |
| Fields | |
|---|---|
|
The ID of the slicer. |
|
SlicerSpec The specification of the slicer. |
|
EmbeddedObjectPosition The position of the slicer. Note that slicer can be positioned only on existing sheet. Also, width and height of slicer can be automatically adjusted to keep it within permitted limits. |
SlicerSpec
The specifications of a slicer.
| JSON representation |
|---|
{ "dataRange": { object ( |
| Fields | |
|---|---|
|
GridRange The data range of the slicer. |
|
FilterCriteria The filtering criteria of the slicer. |
|
The column index in the data table on which the filter is applied to. |
|
True if the filter should apply to pivot tables. If not set, default to |
|
The title of the slicer. |
|
TextFormat The text format of title in the slicer. The link field is not supported. |
|
Color
The background color of the slicer. Deprecated: Use backgroundColorStyle |
|
ColorStyle
The background color of the slicer. If backgroundColor |
|
HorizontalAlign
The horizontal alignment of title in the slicer. If unspecified, defaults to |
Время на прочтение
5 мин
Количество просмотров 24K

Google Sheet и Sheets API — классный (простой, бесплатный и универсальный) способ организовать хранение и анализ данных получаемых от своего сервиса. При условии что этих данных не то чтобы очень много и поступают они не то чтобы очень часто.
У меня таких задач хватает и решаю я их либо на Python, либо на PHP. Сегодня возьму в руки Python.
Доступ к Google API
Чтобы писать из кода в Google Sheet нам нужен доступ к Google Sheets API, которое входит в библиотеку API Google Cloud Platform. Для этого нужно:
-
нужно создать проект в Google Cloud Platform
-
подключить к проекту в Google Cloud Platform Sheets API
-
заполнить OAuth consent screen ( пользовательское соглашение )
-
создать либо OAuth Client ID, либо Service Account
-
я использую Сервисный Аккаунт, следовательно мне нужно дать сервисному аккаунту доступ к Google Sheet (электронной таблице) с уровнем Редактор, тогда я смогу писать из кода в эту таблицу
-
получить JSON файл с токеном доступа к сервисному аккаунту и положить его куда-то откуда код сможет его читать
В тексте это выглядит просто, однако в первый раз интерфейс Google Cloud Console выглядит как рубка звездолета. Куда жать не понятно, иные операции нельзя отменить, а некоторые важные данные можно получить только сразу после нажатия на кнопку и никак после (например json файл токена доступа сервисного доступа). Поэтому страаашно!!!

Но разобраться можно, попробуйте. А если не получится, то вот Пост только про токены Google Cloud.
Как дать доступ к таблице Сервисному Аккаунту
Просто беру емейл сервисного аккаунта и расшариваю доступ к электронной таблице Google Sheets, как если бы это был емейл гуглоаккаунта любого другого живого человека. И этому доступу нужно выдать права Редактора, чтобы с Сервисным аккаунтом писать в этот Google Sheet. На стороне Google Cloud ничего дополнительно делать не надо.

Уведомлять Сервисный Аккаунт тоже не обязательно — он же робот, вы чего 
Лимиты Google Sheets API
Google почти ко всем своим API доступ выдает БЕСПЛАТНО и без премодерации (в тестовом режиме). Однако ограничивает. К некоторым апи ограничения сильные, а к Sheets API вполне приемлемые.
Read requests per minute 300
Read requests per minute per user 60
Read requests per day UnlimitedWrite requests per minute 300
Write requests per minute per user 60
Write requests per day Unlimited
Каждый execute() тратит эти лимиты, даже если запрос не успешный. Остатки лимитов нельзя узнать программно, из кода. Только посмотреть в браузере в https://console.cloud.google.com/apis/api/sheets.googleapis.com/quotas?project=<id проекта>.
Зависимости для доступа к Sheets API из Python
Мой req.txt выглядит вот так:
google-api-python-client
google-auth-httplib2
google-auth-oauthlib
oauth2client
Для Python есть пакеты специально для работы с Google Sheets API. Говорят они даже удобные и это, наверняка, так. Но я работаю не только с Sheets API, поэтому предпочитаю использовать большой и не очень удобный google-api-python-client
build ресурса для доступа к Google Sheets API на Python
В google-api-python-client есть универсальный метод googleapiclient.discovery.build , который создает ресурс для работы с любым API Google и с Sheets API в частности. Но сначала нужно куда то в проекте сложить json файл токена доступа сервисного аккаунта.
build у меня в проекте выглядит вот так:
def get_service_sacc():
    creds_json = os.path.dirname(__file__) + "/creds/sacc1.json"
    scopes = ['https://www.googleapis.com/auth/spreadsheets']

    creds_service = ServiceAccountCredentials.from_json_keyfile_name(creds_json, scopes).authorize(httplib2.Http())
    return build('sheets', 'v4', http=creds_service)
scopes — это уровень доступа, который хочет наше приложение от Google API. Для задач чтения/записи/форматирования в Google Sheet с Сервисным Аккаунтом https://www.googleapis.com/auth/spreadsheets достаточно.
Такое приложение (с Сервисным Аккаунтом) не будет ничего просить от пользователя через браузер, как было бы с OAuth авторизацией. Удобно.
Как узнать spreadsheet_id Google Sheet
Чтобы писать в электронную таблицу, нужно знать её идентификатор. Также нам может понадобиться (при форматировании уж точно) идентификатор листа в электронной таблице. В браузере это все выглядит просто:
# https://docs.google.com/spreadsheets/d/1IfE0sBAkKvhB6F8zHkEozEE0jpwhAU_G4UubwKTV1Bk/edit#gid=758897038
# https://docs.google.com/spreadsheets/d/<ID электронной таблицы (spreadsheet ID)>/edit#gid=<ID листа (sheet ID) >
Как читать из Google Sheet с API на Python?
Для чтения у нас есть два метода spreadsheets().values().get() и spreadsheets().values().batchGet() . В аргументы им передается идентификатор электронной таблицы Google Sheet и диапазон для чтения.
Диапазон для чтения — это строка вида "Лист!A1:Z999". Диапазоны, как видно, могут быть на разных листах электронной таблицы.
batchGet в отличии от get может запросить сразу, за один execute(), несколько диапазонов данных, что экономит квоты. Рекомендую сразу и везде использовать только батчевые методы.
resp = get_service_sacc().spreadsheets().values().get(spreadsheetId=sheet_id, range="Популярное!A1:A999").execute()
# resp = get_service_sacc().spreadsheets().values().batchGet(spreadsheetId=sheet_id, ranges=["Популярное", "Лист3"]).execute()
Запрос отправляется (и расходуются квоты) только по методу execute().
В ответ мы получаем json (dict), где все очевидно. В поле values двумерный массив с нужными данными.
Как писать в Google Sheet с API на Python?
Для записи есть 3 метода:
-
append — пытается писать в заданный диапазон, если ячейки в заданном диапазоне заняты данными (не пусты), то пишет в ближайшую пустую ячейку ниже,
-
update — пишет в заданный диапазон, если ячейки заняты данными — он эти данные перезапишет новыми,
-
batchUpdate — действует как update, но может за один запрос записать несколько пачек данных в разные диапазоны и сэкономить квоты.
Данные для всех этих методов передаются в аргументе body. Для append / update структура одинакова:
body = {
    'values' : [
        ["Azzrael Code", "YouTube Channel"], # строка
        ["check it",       "RIGHT NOW !!!"], # строка
    ]
}
Т.е. values — это простой двумерный массив. А запись выглядит вот так:
resp = sheet.values().update(
    spreadsheetId=sheet_id,
    range="Лист2!H1",
    valueInputOption="RAW",
    body=body).execute()
resp = sheet.values().append(
spreadsheetId=sheet_id,
range="Лист2!A1",
valueInputOption="RAW",
body=body).execute()
range — диапазон для записи, а valueInputOption : ‘RAW’ — значит данные буду писать в ячейку «как есть», не пытаясь, например, в строке разглядеть дату.
Со структурой body для batchUpdate посложнее, но не сильно:
body = {
    'valueInputOption' : 'RAW',
    'data' : [
        {'range' : 'Лист2!D2', 'values' : [
            ["Azzrael Code", "YouTube Channel"],
            ["More about", "Google Sheets API"],
            ["styling", "formulas", "charts"],
        ]},
        {'range' : 'Лист2!H4', 'values' : [
            ["Azzrael Code", "YouTube Channel"],
            ["More about", "Google Sheets API"],
            ["styling", "formulas", "charts"],
        ]}
    ]
}
Нужно ли тут что-то объяснять? Напишите в комментарий, если все таки надо…
Ну а метод даже проще чем у update / append :
resp = sheet.values().batchUpdate(spreadsheetId=sheet_id, body=body).execute()Конечно есть, особенно при записи, некоторые тонкости. Особенно когда речь заходит про форматирование — все эти строки которые вдруг становятся датами, когда не надо. Числа которые стали строками… Но что-то и так много текста вышло, поэтому пока закругляюсь.
Полезные ссылки
-
Документация Google Sheets API. Доки, кстати, очень хорошие. Не все API Google так хорошо задокументированы.
-
На Хабре есть хорошая статья, жаль мне поздно попалась.
-
Все что в статье — есть в оформленном виде на GitHub ( темы разбросаны по веткам репозитория, просто переключайтесь ).
Contents
How to format your
Spreadsheet
For the Spreadsheet you’re going to connect to sheet2api, the first row (1) must only contain column
names.
All the other rows may contain data, in whatever format you’d like (symbols, numbers, dates, words,
etc).
For example:
| A | B | C | D | E | |
| 1 | Name | Favourite Thing | Image | ||
| 2 | Bugs Bunny | Carrots | Bugs.png | ||
| 3 | Elmer Fudd | Chasing Rabbits | Elmer.png | ||
| 4 |
Looney Tunes
The Simpsons
Sheet3
You may add multiple worksheets such as ‘Looney Tunes’, ‘The Simpsons’ to seperate different categories of data.
sheet2api will create an API endpoint for each of these automatically.
Sharing your Spreadsheet with sheet2api
In order to connect your Google/Excel spreadsheet to sheet2api, you’ll need to give sheet2api access to it,
here’s how to do that.
Private Google Sheets
Use this method if your spreadsheet is private and you would like to keep it that way.
- Navigate to your Google Sheet in your web browser.
- Click «Share» in the top right.
- In the «Add people and groups» input box, type google@sheet2api.com.
- Un-tick «Notify people» and click «Share».
- Finally, click «Share» at the top right again, then click «Copy link».
You’ll then use that copied link when you Create Spreadsheet
API.
Public Google Sheets
Use this method if your spreadsheet is public.
- Navigate to your Google Sheet in your web browser.
- Click «Share» in the top right.
- At the bottom right of the popup window click «Copy link».
You’ll then use that copied link when you Create Spreadsheet
API.
Excel Online
- Navigate to your Excel Online Spreadsheet in your web browser.
- Right click on the address bar and select «Copy».
You’ll then use that copied link when you Create Spreadsheet
API.
Making Requests
When you create your spreadsheet API, sheet2api will
generate full examples for making requests to your API.
View
Example API documentation
Securing your API
Permisssions
By default when you create your API, all operations will be allowed: Read, Create, Update & Delete.
You may want to limit what’s possible, for example only allow reading of data from your API.
To do this go to Your Account page, locate your Spreadsheet API from the list and click «Configure API».

On the next page, under «API Permissions», adjust which operations you’d like enabled, and click «Save».

Authentication
If you have configured your API to
require
authentication then all requests will need to include an Authorization header.
The credentials are constructed like this:
The username and the password are combined with a colon (aladdin:opensesame).
The resulting string is base64 encoded (YWxhZGRpbjpvcGVuc2VzYW1l).
That string should when be included within the Authorization header:
Authorization: Basic YWxhZGRpbjpvcGVuc2VzYW1l
Use Case Examples
In this article we will discuss how to access and edit Google Sheets using Google Sheets API in Python.
Table of Contents
- Introduction
- Creating a sample Google Sheets spreadsheet
- Creating Google API credentials
- Open a Google Sheet using Python
- Open Google Sheet by name
- Open Google Sheet by URL
- Open Google Sheet by key
- Select a worksheet using Python
- Create a worksheet using Python
- Delete a worksheet using Python
- Edit data in a Google Sheet using Python
- Get a cell value
- Update a cell value
- Get all values from a row
- Get all values from a column
- Insert a new row
- Conclusion
Introduction
Accessing data from multiple sources using Python becomes a standard requirement for nearly any position in data science and analytics. Working with Excel spreadsheets and internal CSV files happens everywhere.
But what if your data is now stored on Google Drive as a Google Sheet? Of course you can download it in any format of your choice. Yet it is not a scalable solution since it requires constant human input.
Let’s see how we can solve this in a programmatic way and even automate some of the tasks when working with Google Sheets using Python.
To continue following this tutorial we will need two Python libraries: gspread and oauth2client.
If you don’t have them installed, please open “Command Prompt” (on Windows) and install them using the following code:
pip install gspread
pip install oauth2client
Creating a sample Google Sheets spreadsheet
You probably already have a Google Sheets document if you are reading this article and you would like to work with your file.
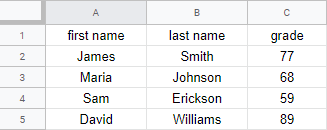
For the purposes of this tutorial, I will create a simple Google Sheets file where I will replicate the students’ grades dataset.
Essentially we will have three columns: “first name”, “last name”, and “grade”.
To create your first Google Sheets file, go to Google Drive page and login using your Google account. Once you are in, in the top left corner, click New and then Google Sheets. This will create a blank document that looks like this:
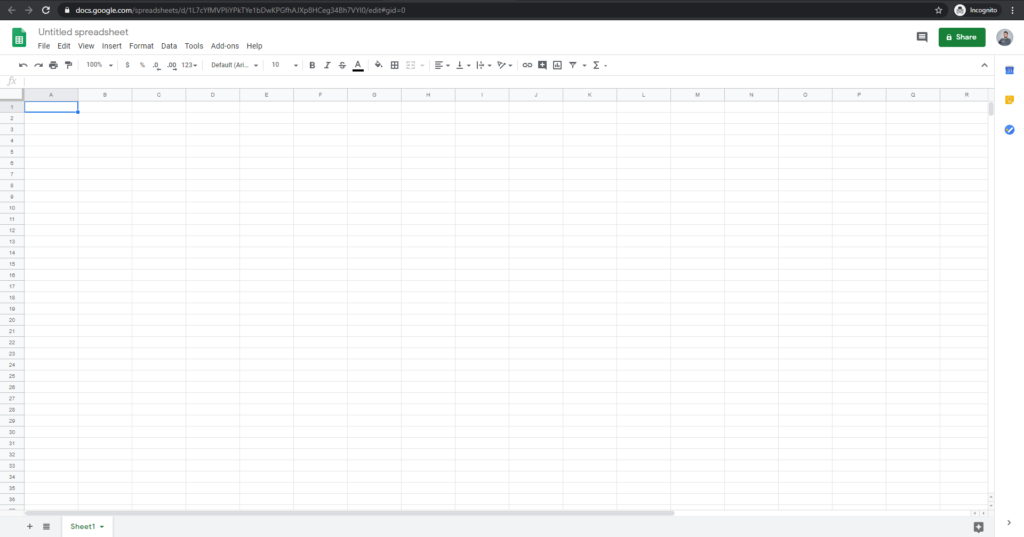
This new document is all empty and doesn’t have any data or it’s own filename.
In the top left corner, where you see “Untitled spreadsheet”, let’s rename it to “My Google Sheet” for convenience.
And let’s add some sample data to work with. I added some simple fields:
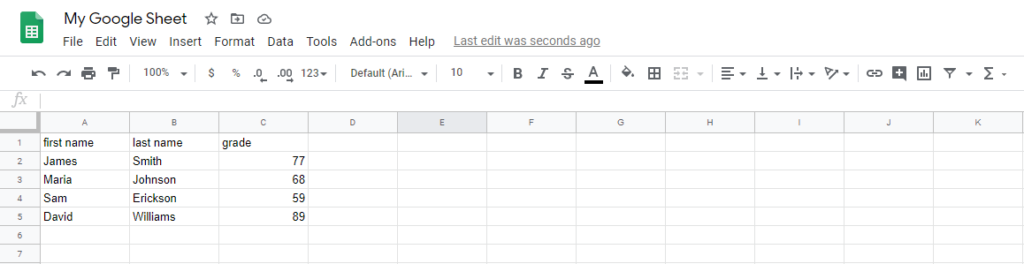
Great. Now we have a file that we will continue working with.
Creating Google API credentials
The first step to start working with Google Sheets using Python is to create API credentials for the Google Drive and Google Sheets that will allow us to connect to our files.
To get started we are going to head to Google Cloud Console for developers and login with our Google account.
Once we are in, at the very top, you will see the following button to create a project:
Click on it and it will take you to a new page where it will ask you to create a name for your project. I called mine “gsheets-pyshark”, and click “Create“.
Now, in the top right corner, click on the “bell” icon, and you will see a notification that the project has been created. From that notification list click View to get to the project page.
This will take you to the API dashboard for your project. It should look like this:
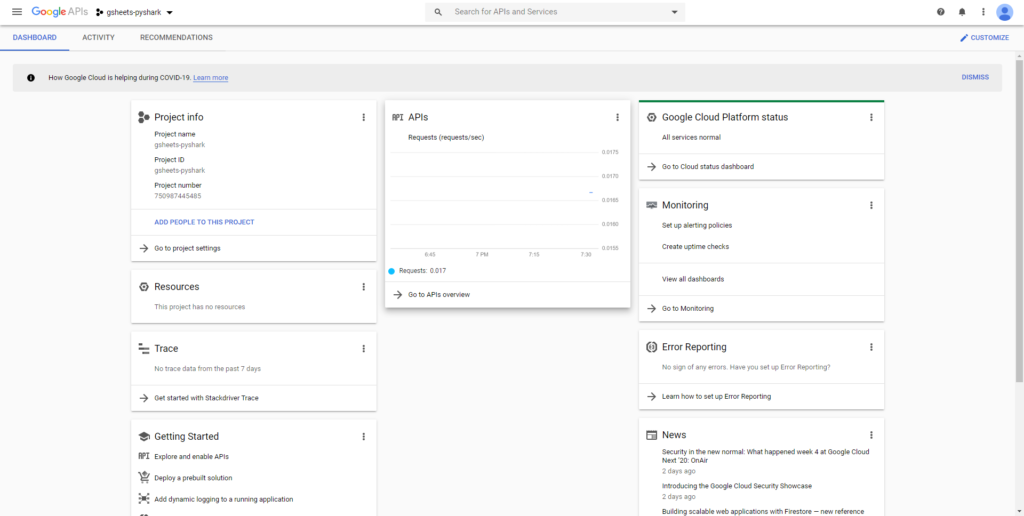
Perfect. So far we created our own unique project for working with Google Sheets using Python. The next step is to set up the APIs.
Go to navigation menu (click the three horizontal lines in the top right corner), and choose APIs & Services and then Dashboard. You should arrive at the following page:
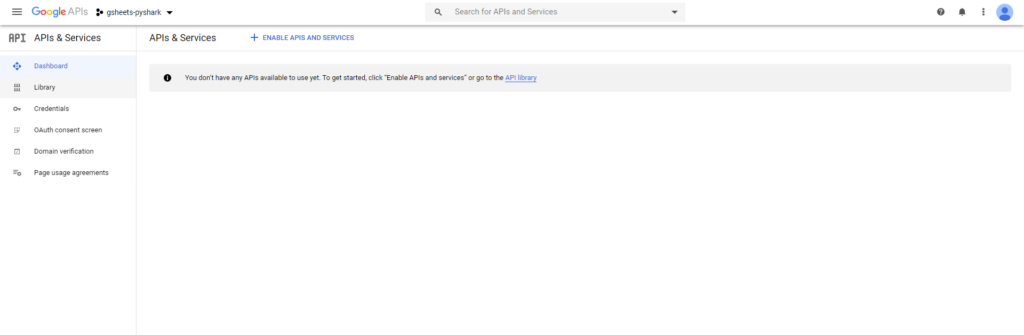
As you can see, we don’t have any APIs working just yet. We need to add them. Follow the blue link in the middle of the screen that says API library to get to the list of all available Google APIs:
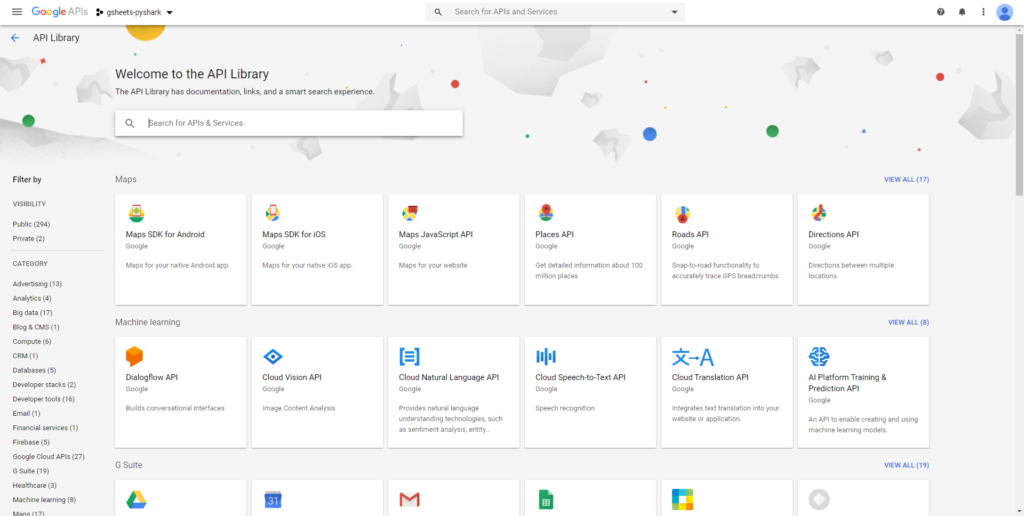
Here we will need to add the “Google Drive” API. Find it by typing the name in the search box, click on it, and then click Enable. It may take a few seconds to load. Once it’s enabled, we arrive here:
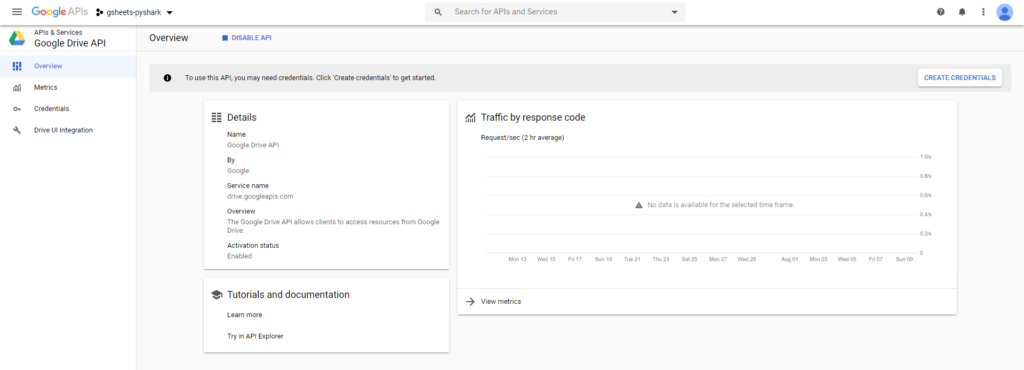
Wonderful. The Google Drive API is now enabled. To use it we will need to generate credentials for it. Click on Create Credentials in the top right corner and fill out the form like this:
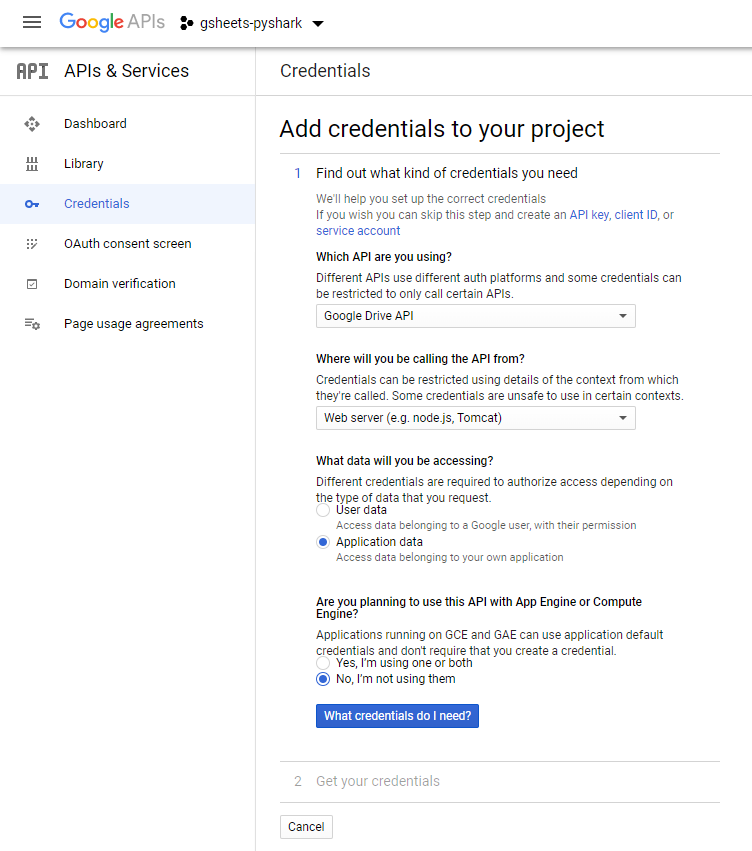
After you filled out the form above, continue with clicking the blue button What credentials do I need?
In the next form, you should choose your account name (I set it to misha-pyshark) and the account’s role for the project (I chose Owner). The “Key type” should be set to JSON, because we would like to download the credentials as a .json file:
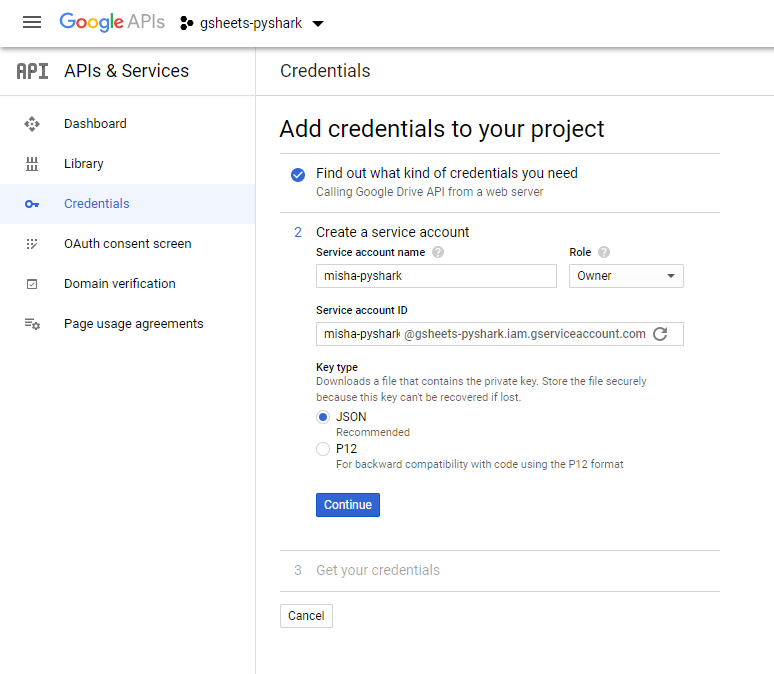
Then, click Continue and your credentials will be downloaded automatically and you will see a pop-up saying your API credentials have been created.
Important note: Please rename the downloaded JSON file to “mycredentials” as it will be much easier to reference it later in the code. Also, you should place it in the same directory/folder where your Python code will be (so we can save time on specifying the location of the file).
So far we have enabled our Google Drive API and downloaded credentials for it. The last step is to enable the Google Sheets API. Let’s go back to Google API library and find “Google Sheets API”. Click into it and click Enable to get it running.
Now we are all set to access Google Sheets using Python.
Open a Google Sheet using Python
There are multiple ways to preform the authorization step in Python. The method I use in this tutorial is widely used across majority of the articles on this topics, so I decided to do it the same way.
As the first step, we will need to import the required libraries:
import gspread
from oauth2client.service_account import ServiceAccountCredentials
Now it’s time to configure the client with our credentials. This will create the gspread client:
gc = gspread.service_account(filename='mycredentials.json')
Everything is set up to retrieve the Google Sheet we’ve created earlier and get all the records from it.
There are 3 ways to open a Google Sheet using Python:
1. Open Google Sheet by name
Here, we simply need to input the actual name of the Google Sheet that we created:
gsheet = gc.open("my_google_sheet")
2. Open Google Sheet by URL
To open the Google Sheet using a URL, you would need to open your Google Sheet in the browser and copy its address. For my file it is: https://docs.google.com/spreadsheets/d/1L7cYfMVPIiYPkTYe1bDwKPGfhAJXp8HCeg34Bh7VYl0/
Now, we use .open_by_url() method and pass our URL as an argument:
gsheet = gc.open_by_url("https://docs.google.com/spreadsheets/d/1L7cYfMVPIiYPkTYe1bDwKPGfhAJXp8HCeg34Bh7VYl0/")
3. Open Google Sheet by key
Opening the Google Sheet by key is very similar to the previous option. What is the key to our file? It’s very easy to find. The key is the last component of the URL between the two last slashes (“/”). In my case it’s: 1L7cYfMVPIiYPkTYe1bDwKPGfhAJXp8HCeg34Bh7VYl0
Now, we use .open_by_key() method and pass our URL as an argument:
gsheet = gc.open_by_key("1L7cYfMVPIiYPkTYe1bDwKPGfhAJXp8HCeg34Bh7VYl0")
Whichever way you decided to continue with, it will create an object in our memory and store it as gsheet. Now what exactly does it contain? Simply, it’s contents are exactly what we have entered when we created this Google Sheet. Let’s now retrieve the information from it:
mydata = gsheet.sheet1.get_all_records()
print(mydata)
In the above chunk of code we opened our retrieved all the data from “Sheet 1” and printed it. It should look like this:
[{'first name': 'James', 'grade': 77, 'last name': 'Smith'},
{'first name': 'Maria', 'grade': 68, 'last name': 'Johnson'},
{'first name': 'Sam', 'grade': 59, 'last name': 'Erickson'},
{'first name': 'David', 'grade': 89, 'last name': 'Williams'}]
We ended up getting a list with values for each row. Also notice how Google Sheets by default set the first row as names for the columns.
Bonus: Google Sheet can be easily converted to a Pandas dataframe using the following code:
import pandas as pd

df= pd.DataFrame(mydata)
print(df)
And we get a much more familiar output:
first name last name grade
0 James Smith 77
1 Maria Johnson 68
2 Sam Erickson 59
3 David Williams 89
After we were able to access the Google Sheet, let’s see what we can start with. The first checkpoint is our flexibility in working with different worksheets of our Google Sheet.
My sample Google Sheet contains only one worksheet that is called “Sheet 1”. Yet, it is very common that you will have a multi worksheet file. Of course when we retrieve the data we would need to specify from which worksheet the data should be taken. And this takes us to the first interaction option.
Select a Worksheet using Python
Recall that our Google Sheet is saved in local memory as gsheet. Now we would like to access a specific worksheet by its name from the file. What we are going to do is create a subset of the main Google Sheet that only contains data from “Sheet1” and print its content:
wsheet = gsheet.worksheet("Sheet1")

mydata = wsheet.get_all_records()
print(mydata)
The result should be identical to the previous section since we only have a single worksheet in our file:
first name last name grade
0 James Smith 77
1 Maria Johnson 68
2 Sam Erickson 59
3 David Williams 89
Create a Worksheet using Python
Now, what if you wanted another empty worksheet? Of course you can login into your Google Drive via browser and create it manually. But if your script is running as a part if an automated process (which is why you are probably reading this article), we want to make everything work from our Python code.
The functionality of gspread library allows us to create new worksheets as well:
newsheet = gsheet.add_worksheet(title="New Worksheet", rows="100", cols="20")
The above code will create a new worksheet in out Google Sheet with the given parameters. Keep in mind, you must specify a new name for the worksheet being added as well as the number of rows and columns.
To check that it worked, login into your Google Drive and take a look at the Google Sheet file, and you will see that a second worksheet “New Worksheet” has been added to your file.
Delete a Worksheet using Python
Alternatively, you may want to delete the worksheet you have just created. Now, here is a little catch: you can only delete the sheets that you have created using Python. In my example, it’s newsheet and the reason is the formatting that is stored in local memory to access that particular worksheet:
gsheet.del_worksheet(newsheet)
And if you check your Google Sheet again, you will see that the “New Worksheet” has been removed.
Edit data in a Google Sheet using Python
The majority of the most useful functionality will be discussed in this section. This is where we actually get to editing data in the main file using Python. To get started, we will need to define the worksheet we will be working with:
wsheet = gsheet.worksheet("Sheet1")
Recall that the data we are working with looks like this:
Get a Cell Value
Let’s say we want to retrieve the data from a specific cell of the worksheet, and let that cell be “A2” (and the data we are looking to get is “James”). We would do it using the following code:
cval = wsheet.acell('A2').value

print(cval)
And we get exactly what we expected:
James
Update a Cell Value
There can also be a case when you would like to update a value in a cell. Let’s say we made a wrong entry and need to change the name in A2 cell from “James” to “John”. It can be simply changed using the following code:
wsheet.update('A2', 'John')
And reusing the little code chunk from the previous section to get the updated value:
cval = wsheet.acell('A2').value

print(cval)
We get:
John
Get All Values from a Row
Alternatively, you may be interested in retrieving the entire row of data (rather than a single cell). In our case, let’s assume we are interested to get the data for the first student in our worksheet.
The only caveat is that we need to know the index of the row that we want to retrieve the data from. Assuming first row is the column headers, the row of interest has an index of 2. Now we can get its values:
row_index = 2
values_row = wsheet.row_values(row_index)

print(values_row)
And we get a list of values in the row:
['John', 'Smith', '77']
Get All Values from a Column
In another scenario, you may wish to get the data from a column (instead of a row). Assume for our scenario we want to get all data from the “grade” column.
We will again need to find its index (index = 3) and run code similar to the section above:
col_index = 3
values_column = wsheet.col_values(col_index)

print(values_column)
And we get a list of values in the column:
['grade', '77', '68', '59', '89']
Insert a New Row
Probably one of the more popular tasks we usually do with spreadsheets is adding new data.
In our example, assume there is a new student who just wrote his/her exam and got a grade for it. We would like to update our Google Sheet using Python with a new entry.
To do this, we will need two pieces of information: students data (first name, last name, and grade) and the index for a row that we are going to insert:
student_data = ['Emily', 'Watson', 89]
new_row_index = 6
The reason the new index is 6 because we know that we already have 5 rows with data, and want to add at the end of the list. Keep in mind you can choose any index value, and it just push the remaining rows down.
Now, let’s add this row to our Google Sheet and check if it was added:
wsheet.insert_row(student_data, new_row_index)

values_row = wsheet.row_values(new_row_index)
print(values_row)
And we get a list of values in the row we just added:
['Emily', 'Watson', '89']
Note: the functionality of the whole package is quite extensive and a lot of it is very case specific. For a complete set of methods with examples of the gspread package is available here.
Conclusion
In this article we discussed how to access and edit Google Sheets using Python as well as covered the features of the gspread library.
Feel free to leave comments below if you have any questions or have suggestions for some edits and check out more of my Python Programming articles.