The Google Sheets API is a RESTful interface that lets you read and modify a
spreadsheet’s data. The most common uses of this API include the following
tasks:
- Create spreadsheets
- Read and write spreadsheet cell values
- Update spreadsheet formatting
- Manage Connected Sheets
Below is a list of common terms used in the Sheets API:
- Spreadsheet
-
The primary object in Google Sheets that can contain multiple sheets, each
with structured information contained in cells. A
Spreadsheet resource represents every spreadsheet and has a
uniquespreadsheetIdvalue,
containing letters, numbers, hyphens, or underscores. You can find the
spreadsheet ID in a Google Sheets URL:https://docs.google.com/spreadsheets/d/spreadsheetId/edit#gid=0 - Sheet
-
A page or tab within a spreadsheet. A
Sheet resource represents each sheet and has
a unique title and numeric
sheetIdvalue. You
can find the sheet ID in a Google Sheets URL:https://docs.google.com/spreadsheets/d/aBC-123_xYz/edit#gid=sheetId - Cell
-
An individual field of text or data within a sheet. Cells are arranged in
rows and columns, and can be grouped as a range of cells. A
CellData resource represents each cell, but
it doesn’t have a unique ID value. Instead, row
and column coordinates identify the cells.- A1 notation
-
A syntax used to define a cell or range of cells with a string that
contains the sheet name plus the starting and ending cell coordinates using
column letters and row numbers. This method is the most common and useful
when referencing an absolute range of cells.Show examples
Sheet1!A1:B2refers to the first two cells in the top two rows of Sheet1.Sheet1!A:Arefers to all the cells in the first column of Sheet1.Sheet1!1:2refers to all the cells in the first two rows of Sheet1.Sheet1!A5:Arefers to all the cells of the first column of Sheet 1, from row 5 onward.A1:B2refers to the first two cells in the top two rows of the first visible sheet.Sheet1refers to all the cells in Sheet1.'My Custom Sheet'!A:Arefers to all the cells in the first column of a sheet named «My Custom Sheet.» Single quotes are required for sheet names with spaces, special characters, or an alphanumeric combination.'My Custom Sheet'refers to all the cells in ‘My Custom Sheet’.
Tip: Where possible, use distinct names for the objects within your spreadsheets. For example, A1 refers to the cell A1 in the first visible sheet, whereas ‘A1’ refers to all the cells in a sheet named A1. Similarly, Sheet1 refers to all the cells in Sheet1. However, if there’s a named range titled «Sheet1», then Sheet1 refers to the named range and ‘Sheet1’ refers to the sheet.
- R1C1 notation
-
A syntax used to define a cell or range of cells with a string that
contains the sheet name plus the starting and ending cell coordinates using
row numbers and column numbers. This method is less common than A1 notation, but can be
useful when referencing a range of cells relative to a given cell’s
position.Show examples
Sheet1!R1C1:R2C2refers to the first two cells in the top two rows of Sheet1.R1C1:R2C2refers to the first two cells in the top two rows of the first visible sheet.Sheet1!R[3]C[1]refers to the cell that is three rows below and one column to the right of the current cell.
- Named range
-
A defined cell or range of cells with a custom name to simplify
references throughout an application. A
FilterView resource represents a named range. - Protected range
-
A defined cell or range of cells that cannot be modified. A
ProtectedRange resource represents a protected range.
Next steps
-
To learn about developing with Google Workspace APIs, including handling
authentication and authorization, refer to
Develop on Google Workspace. -
To learn how to configure and run a simple Sheets API app, read the
Quickstarts overview.
Sheet
A sheet in a spreadsheet.
| JSON representation |
|---|
{ "properties": { object ( |
| Fields | |
|---|---|
|
SheetProperties The properties of the sheet. |
|
GridData Data in the grid, if this is a grid sheet.
The number of GridData objects returned is dependent on the number of ranges requested on this sheet. For example, if this is representing startRow startColumn
For a DATA_SOURCE |
|
GridRange The ranges that are merged together. |
|
ConditionalFormatRule The conditional format rules in this sheet. |
|
FilterView The filter views in this sheet. |
|
ProtectedRange The protected ranges in this sheet. |
|
BasicFilter The filter on this sheet, if any. |
|
EmbeddedChart The specifications of every chart on this sheet. |
|
BandedRange The banded (alternating colors) ranges on this sheet. |
|
DeveloperMetadata The developer metadata associated with a sheet. |
|
DimensionGroup All row groups on this sheet, ordered by increasing range start index, then by group depth. |
|
DimensionGroup All column groups on this sheet, ordered by increasing range start index, then by group depth. |
|
Slicer The slicers on this sheet. |
SheetProperties
Properties of a sheet.
| JSON representation |
|---|
{ "sheetId": integer, "title": string, "index": integer, "sheetType": enum ( |
| Fields | |
|---|---|
|
The ID of the sheet. Must be non-negative. This field cannot be changed once set. |
|
The name of the sheet. |
|
The index of the sheet within the spreadsheet. When adding or updating sheet properties, if this field is excluded then the sheet is added or moved to the end of the sheet list. When updating sheet indices or inserting sheets, movement is considered in «before the move» indexes. For example, if there were 3 sheets (S1, S2, S3) in order to move S1 ahead of S2 the index would have to be set to 2. A sheet index update request is ignored if the requested index is identical to the sheets current index or if the requested new index is equal to the current sheet index + 1. |
|
SheetType
The type of sheet. Defaults to GRID |
|
GridProperties Additional properties of the sheet if this sheet is a grid. (If the sheet is an object sheet, containing a chart or image, then this field will be absent.) When writing it is an error to set any grid properties on non-grid sheets.
If this sheet is a DATA_SOURCE rowCount |
|
True if the sheet is hidden in the UI, false if it’s visible. |
|
Color
The color of the tab in the UI. Deprecated: Use tabColorStyle |
|
ColorStyle
The color of the tab in the UI. If tabColor |
|
True if the sheet is an RTL sheet instead of an LTR sheet. |
|
DataSourceSheetProperties
Output only. If present, the field contains DATA_SOURCE |
SheetType
The kind of sheet.
| Enums | |
|---|---|
|
Default value, do not use. |
|
The sheet is a grid. |
|
The sheet has no grid and instead has an object like a chart or image. |
|
The sheet connects with an external
and shows the preview of data. |
GridProperties
Properties of a grid.
| JSON representation |
|---|
{ "rowCount": integer, "columnCount": integer, "frozenRowCount": integer, "frozenColumnCount": integer, "hideGridlines": boolean, "rowGroupControlAfter": boolean, "columnGroupControlAfter": boolean } |
| Fields | |
|---|---|
|
The number of rows in the grid. |
|
The number of columns in the grid. |
|
The number of rows that are frozen in the grid. |
|
The number of columns that are frozen in the grid. |
|
True if the grid isn’t showing gridlines in the UI. |
|
True if the row grouping control toggle is shown after the group. |
|
True if the column grouping control toggle is shown after the group. |
DataSourceSheetProperties
Additional properties of a
DATA_SOURCE
sheet.
| JSON representation |
|---|
{ "dataSourceId": string, "columns": [ { object ( |
| Fields | |
|---|---|
|
ID of the DataSource |
|
DataSourceColumn
The columns displayed on the sheet, corresponding to the values in RowData |
|
DataExecutionStatus The data execution status. |
GridData
Data in the grid, as well as metadata about the dimensions.
| JSON representation |
|---|
{ "startRow": integer, "startColumn": integer, "rowData": [ { object ( |
| Fields | |
|---|---|
|
The first row this GridData refers to, zero-based. |
|
The first column this GridData refers to, zero-based. |
|
RowData
The data in the grid, one entry per row, starting with the row in startRow. The values in RowData will correspond to columns starting at startColumn |
|
DimensionProperties
Metadata about the requested rows in the grid, starting with the row in startRow |
|
DimensionProperties
Metadata about the requested columns in the grid, starting with the column in startColumn |
RowData
Data about each cell in a row.
| JSON representation |
|---|
{
"values": [
{
object (
|
| Fields | |
|---|---|
|
CellData The values in the row, one per column. |
DimensionProperties
Properties about a dimension.
| JSON representation |
|---|
{ "hiddenByFilter": boolean, "hiddenByUser": boolean, "pixelSize": integer, "developerMetadata": [ { object ( |
| Fields | |
|---|---|
|
True if this dimension is being filtered. This field is read-only. |
|
True if this dimension is explicitly hidden. |
|
The height (if a row) or width (if a column) of the dimension in pixels. |
|
DeveloperMetadata The developer metadata associated with a single row or column. |
|
DataSourceColumnReference Output only. If set, this is a column in a data source sheet. |
ConditionalFormatRule
A rule describing a conditional format.
| JSON representation |
|---|
{ "ranges": [ { object ( |
| Fields | |
|---|---|
|
GridRange The ranges that are formatted if the condition is true. All the ranges must be on the same grid. |
Union field. The rule controlling this conditional format, exactly one must be set. can be only one of the following: |
|
|
BooleanRule The formatting is either «on» or «off» according to the rule. |
|
GradientRule The formatting will vary based on the gradients in the rule. |
BooleanRule
A rule that may or may not match, depending on the condition.
| JSON representation |
|---|
{ "condition": { object ( |
| Fields | |
|---|---|
|
BooleanCondition The condition of the rule. If the condition evaluates to true, the format is applied. |
|
CellFormat
The format to apply. Conditional formatting can only apply a subset of formatting: bold italic strikethrough foreground color background color |
GradientRule
A rule that applies a gradient color scale format, based on the interpolation points listed. The format of a cell will vary based on its contents as compared to the values of the interpolation points.
| JSON representation |
|---|
{ "minpoint": { object ( |
| Fields | |
|---|---|
|
InterpolationPoint The starting interpolation point. |
|
InterpolationPoint An optional midway interpolation point. |
|
InterpolationPoint The final interpolation point. |
InterpolationPoint
A single interpolation point on a gradient conditional format. These pin the gradient color scale according to the color, type and value chosen.
| JSON representation |
|---|
{ "color": { object ( |
| Fields | |
|---|---|
|
Color
The color this interpolation point should use. Deprecated: Use colorStyle |
|
ColorStyle
The color this interpolation point should use. If color |
|
InterpolationPointType How the value should be interpreted. |
|
The value this interpolation point uses. May be a formula. Unused if type MIN MAX |
InterpolationPointType
The kind of interpolation point.
| Enums | |
|---|---|
|
The default value, do not use. |
|
The interpolation point uses the minimum value in the cells over the range of the conditional format. |
|
The interpolation point uses the maximum value in the cells over the range of the conditional format. |
|
The interpolation point uses exactly the value in
. |
|
The interpolation point is the given percentage over all the cells in the range of the conditional format. This is equivalent to |
|
The interpolation point is the given percentile over all the cells in the range of the conditional format. This is equivalent toif the value was: (where errors in the range are ignored when flattening). |
FilterView
A filter view.
| JSON representation |
|---|
{ "filterViewId": integer, "title": string, "range": { object ( |
| Fields | |
|---|---|
|
The ID of the filter view. |
|
The name of the filter view. |
|
GridRange The range this filter view covers.
When writing, only one of range namedRangeId |
|
The named range this filter view is backed by, if any.
When writing, only one of range namedRangeId |
|
SortSpec The sort order per column. Later specifications are used when values are equal in the earlier specifications. |
|
FilterCriteria The criteria for showing/hiding values per column. The map’s key is the column index, and the value is the criteria for that column.
This field is deprecated in favor of filterSpecs |
|
FilterSpec The filter criteria for showing/hiding values per column.
Both criteria filterSpecs |
ProtectedRange
A protected range.
| JSON representation |
|---|
{ "protectedRangeId": integer, "range": { object ( |
| Fields | |
|---|---|
|
The ID of the protected range. This field is read-only. |
|
GridRange The range that is being protected. The range may be fully unbounded, in which case this is considered a protected sheet.
When writing, only one of range namedRangeId |
|
The named range this protected range is backed by, if any.
When writing, only one of range namedRangeId |
|
The description of this protected range. |
|
True if this protected range will show a warning when editing. Warning-based protection means that every user can edit data in the protected range, except editing will prompt a warning asking the user to confirm the edit.
When writing: if this field is true, then editors |
|
True if the user who requested this protected range can edit the protected area. This field is read-only. |
|
GridRange The list of unprotected ranges within a protected sheet. Unprotected ranges are only supported on protected sheets. |
|
Editors
The users and groups with edit access to the protected range. This field is only visible to users with edit access to the protected range and the document. Editors are not supported with warningOnly |
Editors
The editors of a protected range.
| JSON representation |
|---|
{ "users": [ string ], "groups": [ string ], "domainUsersCanEdit": boolean } |
| Fields | |
|---|---|
|
The email addresses of users with edit access to the protected range. |
|
The email addresses of groups with edit access to the protected range. |
|
True if anyone in the document’s domain has edit access to the protected range. Domain protection is only supported on documents within a domain. |
BasicFilter
The default filter associated with a sheet.
| JSON representation |
|---|
{ "range": { object ( |
| Fields | |
|---|---|
|
GridRange The range the filter covers. |
|
SortSpec The sort order per column. Later specifications are used when values are equal in the earlier specifications. |
|
FilterCriteria The criteria for showing/hiding values per column. The map’s key is the column index, and the value is the criteria for that column.
This field is deprecated in favor of filterSpecs |
|
FilterSpec The filter criteria per column.
Both criteria filterSpecs |
BandedRange
A banded (alternating colors) range in a sheet.
| JSON representation |
|---|
{ "bandedRangeId": integer, "range": { object ( |
| Fields | |
|---|---|
|
The id of the banded range. |
|
GridRange The range over which these properties are applied. |
|
BandingProperties
Properties for row bands. These properties are applied on a row-by-row basis throughout all the rows in the range. At least one of rowProperties columnProperties |
|
BandingProperties
Properties for column bands. These properties are applied on a column- by-column basis throughout all the columns in the range. At least one of rowProperties columnProperties |
BandingProperties
Properties referring a single dimension (either row or column). If both
BandedRange.row_properties
and
BandedRange.column_properties
are set, the fill colors are applied to cells according to the following rules:
-
headerColor
and
footerColor
take priority over band colors. -
firstBandColor
takes priority over
secondBandColor
. -
rowProperties
takes priority over
columnProperties
.
For example, the first row color takes priority over the first column color, but the first column color takes priority over the second row color. Similarly, the row header takes priority over the column header in the top left cell, but the column header takes priority over the first row color if the row header is not set.
| JSON representation |
|---|
{ "headerColor": { object ( |
| Fields | |
|---|---|
|
Color
The color of the first row or column. If this field is set, the first row or column is filled with this color and the colors alternate between firstBandColor secondBandColor firstBandColor headerColorStyle |
|
ColorStyle
The color of the first row or column. If this field is set, the first row or column is filled with this color and the colors alternate between firstBandColor secondBandColor firstBandColor headerColor |
|
Color
The first color that is alternating. (Required) Deprecated: Use firstBandColorStyle |
|
ColorStyle
The first color that is alternating. (Required) If firstBandColor |
|
Color
The second color that is alternating. (Required) Deprecated: Use secondBandColorStyle |
|
ColorStyle
The second color that is alternating. (Required) If secondBandColor |
|
Color
The color of the last row or column. If this field is not set, the last row or column is filled with either firstBandColor secondBandColor footerColorStyle |
|
ColorStyle
The color of the last row or column. If this field is not set, the last row or column is filled with either firstBandColor secondBandColor footerColor |
DimensionGroup
A group over an interval of rows or columns on a sheet, which can contain or be contained within other groups. A group can be collapsed or expanded as a unit on the sheet.
| JSON representation |
|---|
{
"range": {
object (
|
| Fields | |
|---|---|
|
DimensionRange The range over which this group exists. |
|
The depth of the group, representing how many groups have a range that wholly contains the range of this group. |
|
This field is true if this group is collapsed. A collapsed group remains collapsed if an overlapping group at a shallower depth is expanded. A true value does not imply that all dimensions within the group are hidden, since a dimension’s visibility can change independently from this group property. However, when this property is updated, all dimensions within it are set to hidden if this field is true, or set to visible if this field is false. |
Slicer
A slicer in a sheet.
| JSON representation |
|---|
{ "slicerId": integer, "spec": { object ( |
| Fields | |
|---|---|
|
The ID of the slicer. |
|
SlicerSpec The specification of the slicer. |
|
EmbeddedObjectPosition The position of the slicer. Note that slicer can be positioned only on existing sheet. Also, width and height of slicer can be automatically adjusted to keep it within permitted limits. |
SlicerSpec
The specifications of a slicer.
| JSON representation |
|---|
{ "dataRange": { object ( |
| Fields | |
|---|---|
|
GridRange The data range of the slicer. |
|
FilterCriteria The filtering criteria of the slicer. |
|
The column index in the data table on which the filter is applied to. |
|
True if the filter should apply to pivot tables. If not set, default to |
|
The title of the slicer. |
|
TextFormat The text format of title in the slicer. The link field is not supported. |
|
Color
The background color of the slicer. Deprecated: Use backgroundColorStyle |
|
ColorStyle
The background color of the slicer. If backgroundColor |
|
HorizontalAlign
The horizontal alignment of title in the slicer. If unspecified, defaults to |
The Google Spreadsheets data API is an extension of the GData API protocol, which you can use to create programs that interact with Google Spreadsheets. The API allows you to query for a list of spreadsheets owned by the currently authenticated user, query for a list of worksheets visible to the authenticated user in a given spreadsheet, and query, insert, update, and delete data in a spreadsheet by either cell or row.
The Google Spreadsheets data API is designed for developers who would like to integrate their applications with Google Spreadsheets. To get started:
http://code.google.com/apis/spreadsheets/
The Google Sheets API enables us to read, write, and update a spreadsheet’s data. We can also use it to render user interfaces (UIs) by fetching data from Google Sheets, which will then serve as a database. The Google Sheets API helps developers import data into spreadsheets and build apps that interact with Google Sheets, maximizing functions and increasing productivity.
In this Google Sheets API tutorial for beginners, you’ll learn how to use the Google Sheets API to perform basic CRUD operations.
Prerequisites for Google Sheets API Tutorial
This tutorial assumes that you have
- a basic understanding of JavaScript and Node.js,
- Node.js and npm installed on your computer,
- a code editor (such as VS Code), and
- a Google account.
Project Setup
To use the Google Sheets API, you need a Google Cloud Platform Project with the API enabled, as well as authorization credentials. To get those, follow the steps below.
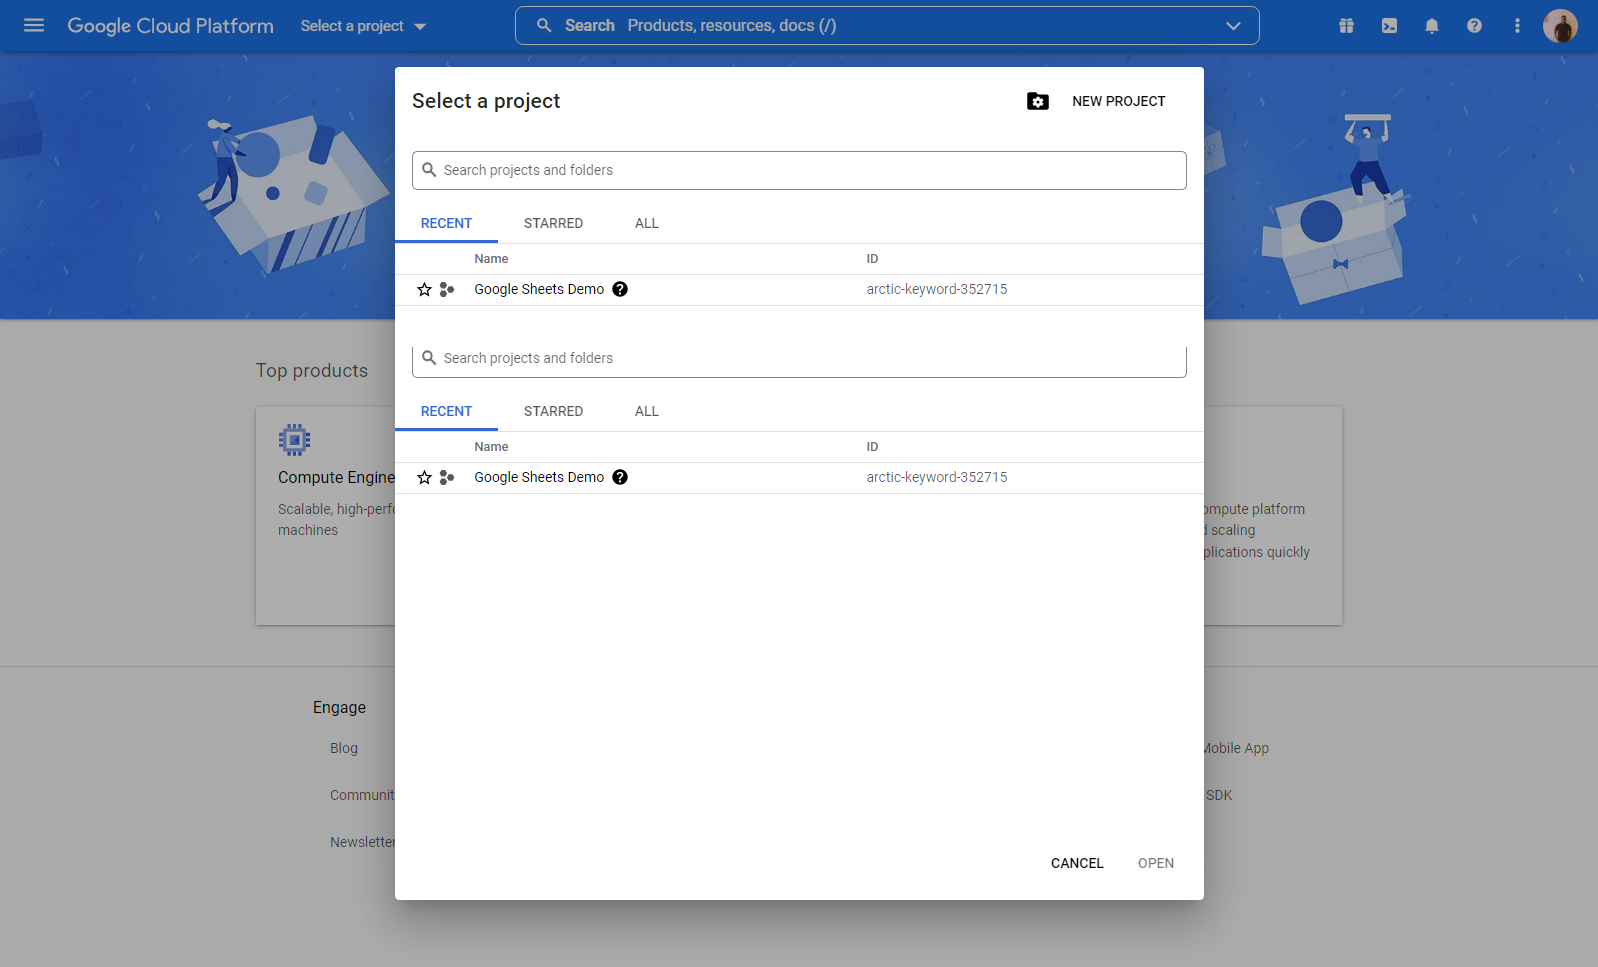
Step 1: Create a New Project
First, open the Google Cloud Console, and then create a new project.
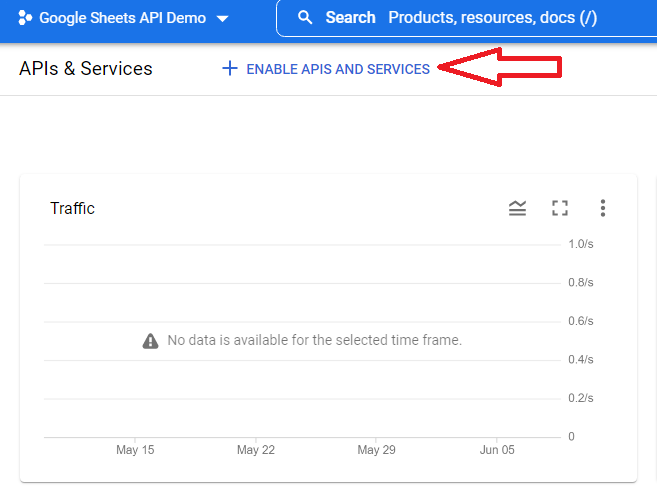
Step 2: Enable API and Services
At the top left, click Menu ☰ > APIs and Services > Enabled APIs and Services.
Then click on the + Enable APIs and Services button.
Step 3: Create a Service Account
Now that the API is enabled, it will direct you to a page where you can configure the settings for the API.
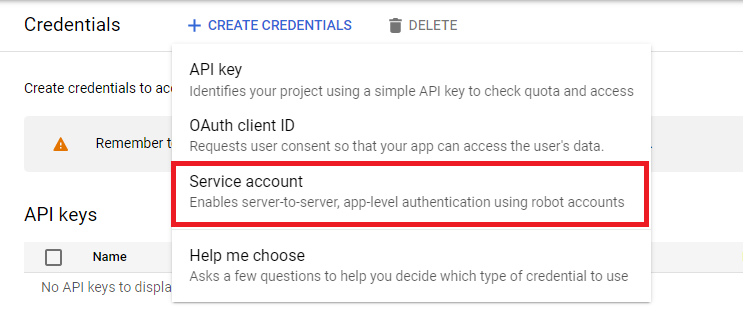
In the left sidebar, click on the Credentials tab, and then click the Create Credentials button at the top.
Next, select Service Account in the drop-down menu.
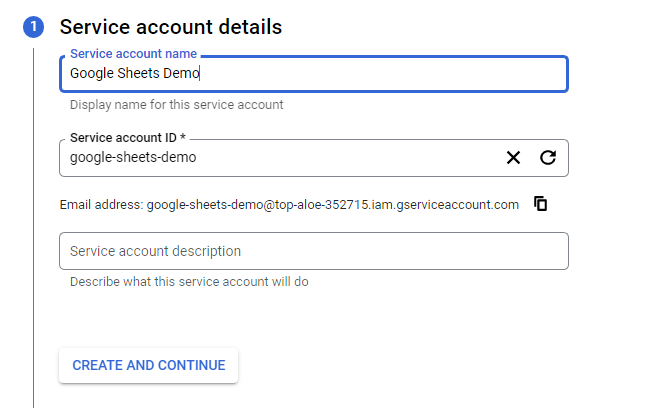
In the next screen, provide the service account details required; then, click Create and Continue.
Click Continue and Done respectively on the next two dialogs.
Now, your newly created service account will be on the credentials page.
Copy the email address of the service account to the clipboard, as we’ll need it later to share the spreadsheet with this account.
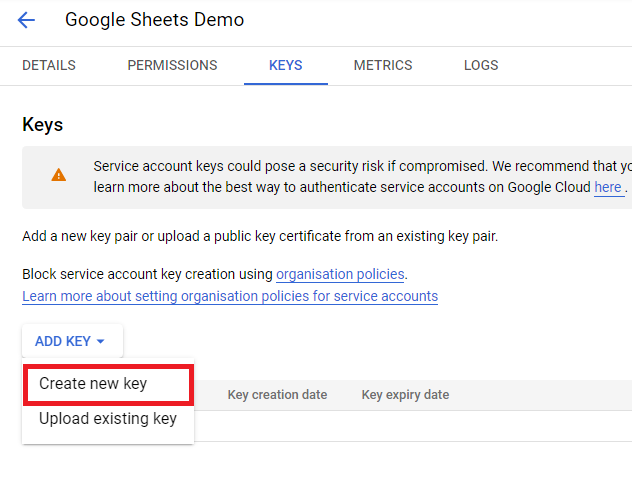
You’ll be directed to the next screen, where we’ll create a new key. To do so, click on the Keys tab, and then click on the Add Key button.
Select the Create New Key option, and then the key type of JSON.
Lastly, rename the downloaded JSON file, and move it into your project folder. This keyfile contains the credentials of the service account that we need in our Node.js script to access the spreadsheet from Google Sheets.
How to Use the Google Sheets API
Now that we’re done setting up the project and its credentials in the Google cloud console, let’s explore how to use the basic API functions in Google Sheets.
Create a Spreadsheet
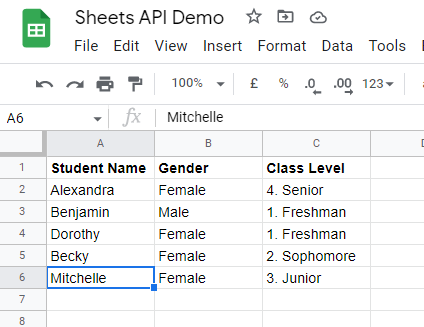
Before diving into the code, head over to Google Sheets and make a new spreadsheet. Enter in some dummy data so that we have something to fetch while testing the API.
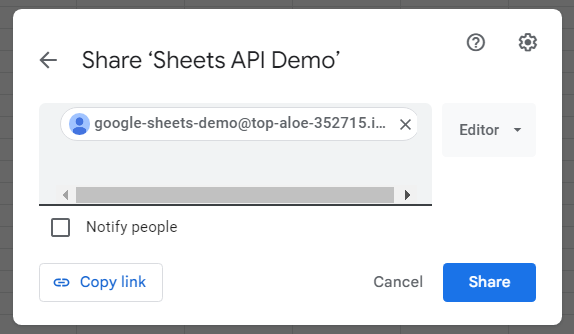
Now, let’s add the service account email address and assign it the Editor role, which gives it permission to read, write, update, and delete data.
Click on the Share button in the top-right corner. This will open a modal where we’ll share the spreadsheet with the service account. Make sure to uncheck the Notify people checkbox.
Click the Share button to share the spreadsheet with the service account.
Application Setup
Now that we’re done with the configuration, let’s get into the code. Open up your code editor and create a new project folder. I’ll be using VS Code. You can checkout and run the example application locally via Runme. Otherwise go ahead and follow the tutorial.
Copy and paste the downloaded keyfile into the root of the directory. Rename the file to a simpler one, like keys.json.
Next, navigate to the root of the project, open up the integrated terminal in VS Code, and run this command:
This command will initialize the directory and create an empty package.json file, which defines important information about the project such as dependencies and project version.
Next, let’s install a couple of dependencies:
- Google APIs, to access the Google Sheets API
- Express, to manage the server and routing
- nodemon, for local development so that the server will restart when we save the file
When that is finished installing, run the following code to install nodemon as a dev dependency:
After running the commands, you’ll get a package-lock.json file and the node_modules folder.
Now, to configure nodemon to restart the server on every file save, open up the package.json file and add the following code:
This will enable us to run the dev server using the command npm run dev.
Now, your package.json file should look like this:
Note that the dependency versions may be different.
Integrating the Google Sheets API
Next, create a file named index.js in the project folder. Open the index.js file and import the dependencies we just installed.
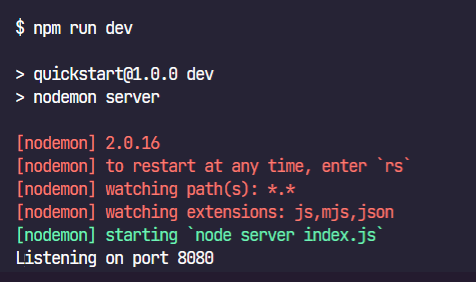
Initialize Express and listen for the server. I’m using port 8080, but you can choose any port.
Next, add the following code:
Let’s break the above code into bits:
First, we created a new Google auth object so that we can authorize the API request. This works by passing in the keyFile, which is the keys.json (assuming the file is stored at the root level of the project), and scopes property, which specifies the Google API we’re using.
Second, the authClient variable stores the service account details (client instance) from the getClient() method once the details have been verified in the auth object.
Third, we create an instance of the Google Sheets API. It takes an object with two properties: version (the current version, in our case v4) and auth, the authClient that we created.
Lastly, we return the variables so that we can access the spreadsheet values in any routes of the app.
Reading Data From a Spreadsheet
Now, to get the data from the spreadsheet, we’ll use the sheets.spreadsheets.values.get method, which takes in two required path parameters—spreadsheetId and range—and stores them in a response variable.
We extract the spreadsheetId from the URL of the spreadsheet and store it in a global variable, id:
The text underlined in red is the spreadsheet ID.
While the range defines the range of cells to read from, here we use the spreadsheet name. Every spreadsheet file has at least one sheet, which is identified by the sheet name. In our example, we’re using the sheet name Sheet 1, which you can find at the bottom left of the spreadsheet.
You can also limit the range of the sheet by adding the sheet name, an exclamation symbol, and then the column range (e.g., Sheet1!A1:C5).
The sheets.spreadsheets.values.get method has three other optional query parameters:
- majorDimension defines the major dimension of the values, either rows or columns. The default is ROWS.
- valueRenderOption defines how values should be rendered in the output. The default is FORMATTED_VALUE.
- dateTimeRenderOption defines how dates, times and duration should be rendered in the output. The default is SERIAL_NUMBER.
Now, run the following command in the terminal to start the server:
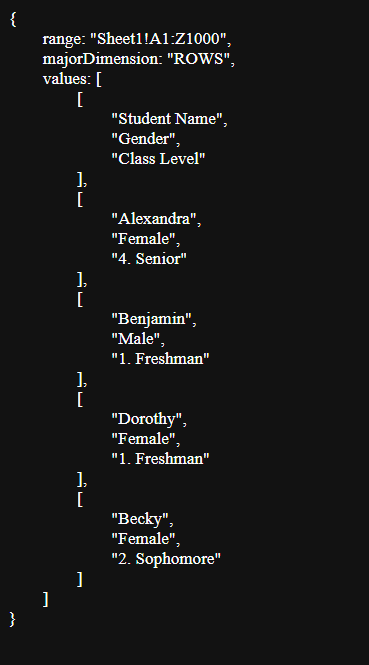
Then, head over to your browser, and type in http://localhost:8080. The result should be something like this:
If it doesn’t look aligned like this, install JSONVue to format your JSON files in the browser. With this, we’ve successfully read the data from our spreadsheet.
Writing and Updating Data into the Spreadsheet
To append data after a table of data in a sheet, use the sheets.spreadsheets.values.append method, which takes in the spreadsheet ID, the range of cells to write into, the value entered by the user, and the resource object containing the information to insert into the rows.
The valueInputOption property defines how the input data should be interpreted. The values will be parsed according to how the user typed them into the UI.
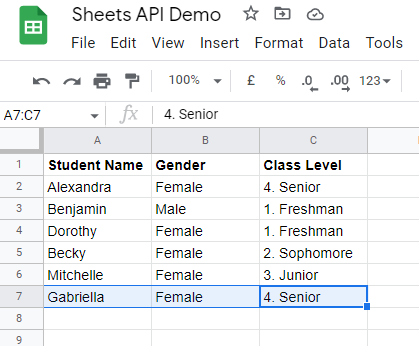
The resource object has a child, values, which is an array of the data to be added to the sheets. Here, we’re adding a new row with the values for the student name, gender, and class level.
Save the code and head over to Google Sheets, where you’ll find that the new entry has been added. If not, refresh the local server and then go back to Google Sheets.
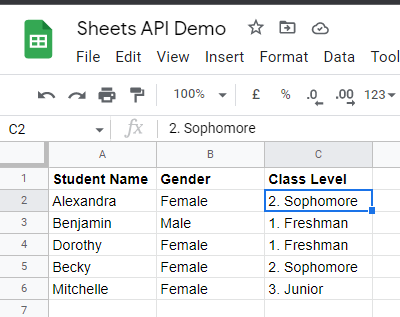
There’s also the option of using the spreadsheets.values.update request. This enables us to write data to a specified range. For example, the following code will update the class level of Alexandra to «2. Sophomore»:
Deleting Data From Google Sheets
Using the spreadsheets.values.clear method, we can clear values from a spreadsheet. To do that, specify the spreadsheet ID and range. The code below will clear all the values from row A6 to C6:
Updating Spreadsheet Formatting
With the Google Sheets API, we can update the formatting of cells and ranges within spreadsheets.
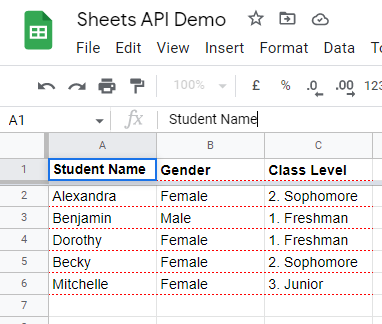
The following code defines the style for each cell for the range defined. Here, we add a dashed border line with a red color:
This is the resulting layout:
Did you run into trouble getting the examples running? Checkout the full example locally via Runme.
Google Sheets API FAQs
Here are some frequently asked questions about the Google Sheets API.
Can I Use Google Sheets API for Free?
Using the Google Sheets API is free, but each user has usage limits. The Google Sheets API usage limits are quotas and limitations imposed by Google to make sure their API is used fairly and to protect their systems.
However, you may not exhaust this limit unless your app has a lot of users. If you do exceed the limits, you’ll get a 429: Too many requests error. If this happens, try using the exponential backoff algorithm.
How Do I Use APIs in Google Sheets?
Just as you can use the Google Sheets API to read and write Google Sheets, you can also take advantage of its connectivity to use other APIs.
Conclusion
In this tutorial, we’ve explored some basic functions of the Google Sheets API, and you’ve seen how easy it is to set up. But that’s not all. From here, you can make anything simple from a Google Forms clone to a video requests app, or you can use it for something more complex like using it as a database from where an app fetches data and renders it on the front end.
I hope you found this post helpful and insightful. If you want to explore the other functions, check out the documentation.
You can find us at @statefulhq on Twitter or on Discord. Also, if you’re a VS Code user you should checkout
Runme
(transform READMEs into runnable notebooks), and
Marquee (the open source homescreen that helps you stay organized). 👋
Happy coding!
This post was written by Israel Oyetunji. Israel is a frontend developer with a knack for creating engaging UI and interactive experiences. He has proven experience developing consumer-focused websites using HTML, CSS, Javascript, React JS, SASS, and relevant technologies. He loves writing about tech and creating how-to tutorials for developers.
Contents
How to format your
Spreadsheet
For the Spreadsheet you’re going to connect to sheet2api, the first row (1) must only contain column
names.
All the other rows may contain data, in whatever format you’d like (symbols, numbers, dates, words,
etc).
For example:
| A | B | C | D | E | |
| 1 | Name | Favourite Thing | Image | ||
| 2 | Bugs Bunny | Carrots | Bugs.png | ||
| 3 | Elmer Fudd | Chasing Rabbits | Elmer.png | ||
| 4 |
Looney Tunes
The Simpsons
Sheet3
You may add multiple worksheets such as ‘Looney Tunes’, ‘The Simpsons’ to seperate different categories of data.
sheet2api will create an API endpoint for each of these automatically.
Sharing your Spreadsheet with sheet2api
In order to connect your Google/Excel spreadsheet to sheet2api, you’ll need to give sheet2api access to it,
here’s how to do that.
Private Google Sheets
Use this method if your spreadsheet is private and you would like to keep it that way.
- Navigate to your Google Sheet in your web browser.
- Click «Share» in the top right.
- In the «Add people and groups» input box, type google@sheet2api.com.
- Un-tick «Notify people» and click «Share».
- Finally, click «Share» at the top right again, then click «Copy link».
You’ll then use that copied link when you Create Spreadsheet
API.
Public Google Sheets
Use this method if your spreadsheet is public.
- Navigate to your Google Sheet in your web browser.
- Click «Share» in the top right.
- At the bottom right of the popup window click «Copy link».
You’ll then use that copied link when you Create Spreadsheet
API.
Excel Online
- Navigate to your Excel Online Spreadsheet in your web browser.
- Right click on the address bar and select «Copy».
You’ll then use that copied link when you Create Spreadsheet
API.
Making Requests
When you create your spreadsheet API, sheet2api will
generate full examples for making requests to your API.
View
Example API documentation
Securing your API
Permisssions
By default when you create your API, all operations will be allowed: Read, Create, Update & Delete.
You may want to limit what’s possible, for example only allow reading of data from your API.
To do this go to Your Account page, locate your Spreadsheet API from the list and click «Configure API».

On the next page, under «API Permissions», adjust which operations you’d like enabled, and click «Save».

Authentication
If you have configured your API to
require
authentication then all requests will need to include an Authorization header.
The credentials are constructed like this:
The username and the password are combined with a colon (aladdin:opensesame).
The resulting string is base64 encoded (YWxhZGRpbjpvcGVuc2VzYW1l).
That string should when be included within the Authorization header:
Authorization: Basic YWxhZGRpbjpvcGVuc2VzYW1l

