
Improve Article
Save Article
Like Article
Improve Article
Save Article
Like Article
Word Cloud is a data visualization technique used for representing text data in which the size of each word indicates its frequency or importance. Significant textual data points can be highlighted using a word cloud. Word clouds are widely used for analyzing data from social network websites.
Why Word Cloud?
The reasons one should use word clouds to present the text data are:
- Word clouds add simplicity and clarity. The most used keywords stand out better in a word cloud
- Word clouds are a potent communication tool. They are easy to understand, to be shared, and are impactful.
- Word clouds are visually engaging than a table data.
Implementation in R
Here are steps to create a word cloud in R Programming.
Step 1: Create a Text File
Copy and paste the text in a plain text file (e.g:file.txt) and save the file.
Step 2: Install and Load the Required Packages
Python3
install.packages("tm")
install.packages("SnowballC")
install.packages("wordcloud")
install.packages("RColorBrewer")
library("tm")
library("SnowballC")
library("wordcloud")
library("RColorBrewer")
Step 3: Text Mining
- Load the Text:
The text is loaded using Corpus() function from text mining(tm) package. Corpus is a list of a document.- Start by importing text file created in step 1:
To import the file saved locally in your computer, type the following R code. You will be asked to choose the text file interactively.Python3
text=readLines(file.choose()) - Load the data as a corpus:
Python3
docs=Corpus(VectorSource(text)) - Text transformation:
Transformation is performed using tm_map() function to replace, for example, special characters from the text like “@”, “#”, “/”.Python3
toSpace=content_transformer(function (x, pattern)gsub(pattern," ", x))docs1=tm_map(docs, toSpace,"/")docs1=tm_map(docs, toSpace,"@")docs1=tm_map(docs, toSpace,"#")
- Start by importing text file created in step 1:
- Cleaning the Text:
The tm_map() function is used to remove unnecessary white space, to convert the text to lower case, to remove common stopwords. Numbers can be removed using removeNumbers.
Python3
docs1=tm_map(docs1,content_transformer(tolower))docs1=tm_map(docs1, removeNumbers)docs1=tm_map(docs1, stripWhitespace)
Step 4: Build a term-document Matrix
Document matrix is a table containing the frequency of the words. Column names are words and row names are documents. The function TermDocumentMatrix() from text mining package can be used as follows.
Python3
dtm = TermDocumentMatrix(docs)
m = as.matrix(dtm)
v = sort(rowSums(m), decreasing = TRUE)
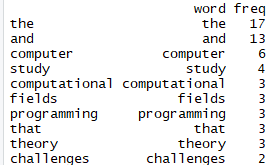
d = data.frame(word = names(v), freq = v)
head(d, 10)
Step 5: Generate the Word Cloud
The importance of words can be illustrated as a word cloud as follows.
Python3
wordcloud(words = d$word,
freq = d$freq,
min.freq = 1,
max.words = 200,
random.order = FALSE,
rot.per = 0.35,
colors = brewer.pal(8, "Dark2"))
The complete code for the word cloud in R is given below.
Python3
install.packages("tm")
install.packages("SnowballC")
install.packages("wordcloud")
install.packages("RColorBrewer")
library("tm")
library("SnowballC")
library("wordcloud")
library("RColorBrewer")
text = readLines(file.choose())
docs = Corpus(VectorSource(text))
toSpace = content_transformer(
function (x, pattern)
gsub(pattern, " ", x))
docs1 = tm_map(docs, toSpace, "/")
docs1 = tm_map(docs, toSpace, "@")
docs1 = tm_map(docs, toSpace, "#")
strwrap(docs1)
docs1 = tm_map(docs1, content_transformer(tolower))
docs1 = tm_map(docs1, removeNumbers)
docs1 = tm_map(docs1, stripWhitespace)
dtm = TermDocumentMatrix(docs)
m = as.matrix(dtm)
v = sort(rowSums(m),
decreasing = TRUE)
d = data.frame(word = names(v),
freq = v)
head(d, 10)
wordcloud(words = d$word,
freq = d$freq,
min.freq = 1,
max.words = 200,
random.order = FALSE,
rot.per = 0.35,
colors = brewer.pal(8, "Dark2"))
Output:
Advantages of Word Clouds
- Analyzing customer and employee feedback.
- Identifying new SEO keywords to target.
- Word clouds are killer visualisation tools. They present text data in a simple and clear format
- Word clouds are great communication tools. They are incredibly handy for anyone wishing to communicate a basic insight
Drawbacks of Word Clouds
- Word Clouds are not perfect for every situation.
- Data should be optimized for context.
- Word clouds typically fail to give the actionable insights that needs to improve and grow the business.
Like Article
Save Article
Introduction: What is a Word Cloud?
Word Clouds have become quite a popular way for marketing campaigns. As more and more information is shown to the viewer, these Word Cloud present a modern graphic way to represent an idea or focus around which the whole concept is born.
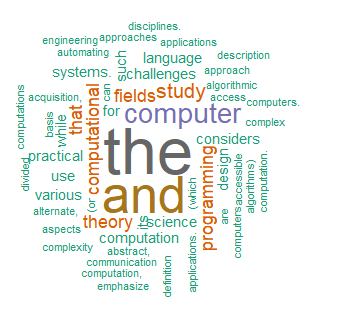
Let us start with simple Word Cloud examples with the topic web 2.0. We can see the main topic in the center (web 2.0) and multiple related topics around that. Here, size and words after the main topic define the importance or relation to the overall topic.
![]()
A Word Cloud for terms related to Web 2.0 Source
A larger font size depicts the higher weight of the particular subject in a given Word Cloud topic. So the topic of Usability, Design, Convergence, Standardization, Economy, and Participation has more influence than Web Standards, Mobility, Data-Driven, CSS, Simplicity, and Microformats.
On a general note, these are also known as a tag cloud, or wordle, or a weighted list. Many online platforms use the tag cloud to represent specific items or tags that are found on that website. Suppose a website has hundreds of posts or content on a website. A tag cloud can separate the use of words on these posts to define the number of views on a specific analysis.
Word Clouds have three main types as frequency, Significance, and Categorization based on meaning rather than their visual appearances. In this post, we will learn step by step process for how to make a Word Cloud in R language.
- Who is using Word Clouds?
- Reason to use Word Clouds to present your text data
- Main steps to create Word Cloud in R
- Word Cloud examples
- When you should use Word Clouds
1. Who is using Word Clouds?
With data analysis gaining focus in almost every industry, these Word Clouds are gaining a lot of importance in getting facts and discovering patterns. Word Clouds are now used across multiple domains as in topics of:
- Research to conclude qualitative information from large amount and multiple forms of data
- Social Media Sites to collect and analyze data in discovering potential current trends, separate miscreant or offenders, and upcoming changes in user behaviors.
- Marketing to uncover present trends, user behavior, and trending products.
- Education to bring more focus on the essential issues that need more attention.
- Politicians and Journalists to get more attention from users.
2. Reason to use Word Clouds to present your text data
Here are the main reasons to use Word Clouds in presenting text data.
- Keeps the Focus: Word Cloud represents a sophisticated communication tool for modern viewers to focus on the main factors or reasons rather than going through the whole document.
- Simple and precise information: A Word Cloud will bring the exact information to the viewers instantly.
- Highly engaging: Word Clouds are more visually engaging in the viewer’s eye.
- Enhance user experience: Overall Word Cloud is a great way to improvise user experience.
3. Main steps to create Word Cloud in R
Here is your guide for creating the first Word Cloud in R.
Step 1: Starting by creating a text file
The first step is choosing the topic or selecting the data and creating a text file for easy processing. You can take any speech from a Politician leader or thousands of social media posts. You can use any editor from your system or online to copy-paste the data and create a specific text file for building a Word Cloud.
Step 2: Install and loading the WordCloud package in R
Then open the RStudio. And for generating Word Cloud in R, you must have the WordCloud package in R and RcolorBrewer package for representing colors, respectively. Here are the commands to use these packages in the RStudio:
#Installalation and loading of packages
install.packages(“wordcloud”)
library(wordcloud)
install.packages(“RColorBrewer”)
library(RColorBrewer)
Users also have the option to use the WordCloud2 package that offers extra designs and funny applications for developing a more engaging Word Cloud in R. Here is the command for that:
install.packages(“wordcloud2)
library(wordcloud2)
Now data or texts take center stage for the whole analysis. Now you need to load your text data as a corpus. Here tm package can help you in this process.
library(tm)
#Command for creating a vector containing only the text
text <- data$text
#Command to Create a corpus
docs <- Corpus(VectorSource(text))
And in case you are using Twitter data, then there is a separate rtweet package that can ease your process too.
Step 3: Text Mining in R: Cleaning the data
Once the text is available with Corpus() function via the text mining ™, then cleaning the data is the next stage. Now you must remove the special characters, punctuation, or any numbers from the complete text for separating words. This will help the WordCloud to focus on words only and be more productive in delivering insights precisely.
There are multiple packages to help you clean data when using the corpus. For the tm package, you can use the following list of commands.
docs <- docs %>%
tm_map(removeNumbers) %>%
tm_map(removePunctuation) %>%
tm_map(stripWhitespace)
docs <- tm_map(docs, content_transformer(tolower))
docs <- tm_map(docs, removeWords, stopwords(“english”))
Text mining in R can have numerous key points in the process.
- Removes all the number present in the data or text (removeNumbers argument)
- Removes all the punctuation marks from the sentences (remove punctuation argument)
- Strips the text for any white space (stripWhitespace argument)
- Transforms all the words into lower case (content_transformer(tolower))
- Removing common stop words such as “we”, “I”, or “the” in the whole document. (removeWords, stopwords )
And in case you are working with Twitter data. Here is a code for refining data for a sample of tweets to clean your texts.
gsub(“https\S*”, “”, tweets$text)
gsub(“@\S*”, “”, tweets$text)
gsub(“amp”, “”, tweets$text)
gsub(“[rn]”, “”, tweets$text)
gsub(“[[:punct:]]”, “”, data$text)
Here is a complete list of R Codes to help you in the text mining process.
# Transforming the text to lower case docs <- tm_map(docs, content_transformer(tolower))
# Removing the numbers docs <- tm_map(docs, removeNumbers)
# Remove english common stopwords docs <- tm_map(docs, removeWords, stopwords(“english”))
# Remove own stop word for any specific document# specify stopwords as a character vector docs <- tm_map(docs, removeWords, c(“example1”, “example2”))
# Removing punctuations docs <- tm_map(docs, removePunctuation)
# Eliminating all the rest of the extra white spaces docs <- tm_map(docs, stripWhitespace)
# Text stemming from the document docs <- tm_map(docs, stemDocument)
Step 4: Creating a document-term-matrix
In the next step, we create a document-term-matrix that defines a mathematical matrix with the frequency of words in a given document.
Once executed, this creates a data frame with two columns, one as a word and the second as their frequency in the document. Here is the code for building a document term matrix for the tm package using the TermDocumentMatrix function.
dtm <- TermDocumentMatrix(docs)
matrix <- as.matrix(dtm)
words <- sort(rowSums(matrix),decreasing=TRUE)
df <- data.frame(word = names(words),freq=words)
There is a tidytext package you can use for creating a document term-matrix more specifically for working with tweets.
tweets_words <- tweets %>%
select(text) %>%
unnest_tokens(word, text)
words <- tweets_words %>% count(word, sort=TRUE)
Step 5: Generating the Word Cloud
Now you can simply use the wordcloud function to generate a Word Cloud from the text. You can set limits for a number of words, frequency, and more to get a final presentation for the Word Cloud.
set.seed(1234) # for reproducibility
wordcloud(words = df$word, freq = df$freq, min.freq = 1,max.words=100, random.order=FALSE, rot.per=0.35, colors=brewer.pal(8, “Dark2”))
![]()
Here are parameters to help you build a more specific Word Cloud.
- words: To define words that you want to see in the cloud
- freq: To define word frequencies
- min.freq: To define the minimum frequency of words to be listed in the Cloud
- max.words: To defines the maximum number of words in the cloud (otherwise you might see every word in the graphic)
- random.order: To represent words in the cloud in random order. (For selecting false you will get them in decreasing order)
- rot.per: To define the vertical text percentage in the given data
- colors: To defines a wide variety of choice for colors in representing data
- Scale: to manage the font size between the smallest and largest words
You may also find some words that are often cropped or don’t show up in the Word Cloud. You can adjust them as per your preference and get more productive by enhancing the quality of results. Another common mistake that one sees in Word Cloud is the use of many words with little frequency. Here you can use min.freq function to further limit the use of words respectively.
4. Word Cloud examples
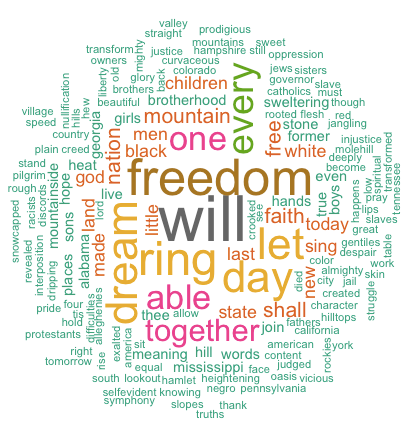
Here is a collective result for a document term matrix from Martin Luther King’s speech titled ‘I have a dream speech.
word freqwill will 17freedom freedom 13ring ring 12day day 11dream dream 11let let 11every every 9able able 8one one 8together together 7
A matrix showing the words and their corresponding frequency in the data And the result for that Word Cloud will be as below:
![]()
On analysis, you can visualize that the top words that came in his speech were will, freedom, let, dream, ringday, every, able, one, together, and then decreasing thereafter.
The WordCloud2 package has more added visualizations and features for users. This package allows you to give custom shapes to the Word Cloud, such as Pentagon or a particular letter ‘L’. Here are your code and visual presentation of UN speeches given by presidents.
wordcloud2(data=df, size=1.6, color=’random-dark’)
![]()
wordcloud2(data=df, size = 0.7, shape = ‘pentagon’)
![]()
5. When you should use Word Clouds
Communication: With the right use of Word Clouds, writers can know the focus points of content and build their content around that. Especially for fiction writing, writers can use Word Clouds to know the importance of any particular character, scene, or emotion to collaborate into a final product.
Business Insights: Here, Word Clouds can help in discovering customers’ strong or weak points from their feedback analysis to be more close to their emotions. Things such as getting the main topic in Word Cloud as long delays showing an essential weaker point in their procedure can be done easily.
While for Business to Consumer analysis, Word Clouds can also pinpoint the specific technical information or Jargon in creating a balance of different words in a single piece of content.
Conclusion
In this age of data analysis, Word Cloud presents a unique and engaging way to simplify data into graphical presentations. Today, organizations and businesses around the world are making sure to build more engaging content. This guide is a comprehensive guide to build Word Cloud examples in R from scratch and get more user attention for their data analysis.
You start by selecting the text file and then learn how to install Wordcloud and other packages. Text mining in R is quite a sophisticated technique to draw Word Cloud and get more user engagement for their platforms. Then create a document-term-matrix and enjoy your first Word Cloud output.
Though Word Cloud in R has gained a lot of popularity with the prominence of Data analysis and provides an engaging way for qualitative insight, still, Word Cloud can’t be used to represent the whole research or any statistical analysis. While many researchers, online platforms, and marketing professionals enjoy showcasing Word Cloud in their field to get more user focus towards their focus, products, or services.
If you are interested in making a career in the Data Science domain, our 11-month in-person Postgraduate Certificate Diploma in Data Science course can help you immensely in becoming a successful Data Science professional.
- R tag cloud generator function : rquery.wordcloud
- Usage
- Required R packages
- Create a word cloud from a plain text file
- Change the color of the word cloud
- Operations on the result of rquery.wordcloud() function
- Frequency table of words
- Operations on term-document matrix
- Create a word cloud of a web page
- R code of rquery.wordcloud function
- Infos
As you may know, a word cloud (or tag cloud) is a text mining method to find the most frequently used words in a text. The procedure to generate a word cloud using R software has been described in my previous post available here : Text mining and word cloud fundamentals in R : 5 simple steps you should know.
The goal of this tutorial is to provide a simple word cloud generator function in R programming language. This function can be used to create a word cloud from different sources including :
- an R object containing plain text
- a txt file containing plain text. It works with local and online hosted txt files
- A URL of a web page
Creating word clouds requires at least five main text-mining steps (described in my previous post). All theses steps can be performed with one line R code using rquery.wordcloud() function described in the next section.
R tag cloud generator function : rquery.wordcloud
The source code of the function is provided at the end of this page.
Usage
The format of rquery.wordcloud() function is shown below :
rquery.wordcloud(x, type=c("text", "url", "file"),
        lang="english", excludeWords = NULL,
        textStemming = FALSE,  colorPalette="Dark2",
max.words=200)- x : character string (plain text, web URL, txt file path)
- type : specify whether x is a plain text, a web page URL or a .txt file path
- lang : the language of the text. This is important to be specified in order to remove the common stopwords (like ‘the’, ‘we’, ‘is’, ‘are’) from the text before further analysis. Supported languages are danish, dutch, english, finnish, french, german, hungarian, italian, norwegian, portuguese, russian, spanish and swedish.
- excludeWords : a vector containing your own stopwords to be eliminated from the text. e.g : c(“word1”, “word2”)
- textStemming : reduces words to their root form. Default value is FALSE. A stemming process reduces the words “moving” and “movement” to the root word, “move”.
- colorPalette : Possible values are :
- a name of color palette taken from RColorBrewer package (e.g.: colorPalette = “Dark2”)
- color name (e.g. : colorPalette = “red”)
- a color code (e.g. : colorPalette = “#FF1245”)
- min.freq : words with frequency below min.freq will not be plotted
- max.words : maximum number of words to be plotted. least frequent terms dropped
Note that, rquery.wordcloud() function returns a list, containing two objects :
— tdm : term-document matrix which can be explored as illustrated in the next sections. — freqTable : Frequency table of words
Required R packages
The following packages are required for the rquery.wordcloud() function :
- tm for text mining
- SnowballC for text stemming
- wordcloud for generating word cloud images
- RCurl and XML packages to download and parse web pages
- RColorBrewer for color palettes
Install these packages, before using the function rquery.wordcloud, as follow :
install.packages(c("tm", "SnowballC", "wordcloud", "RColorBrewer", "RCurl", "XML")Create a word cloud from a plain text file
Plain text file can be easily created using your favorite text editor (e.g : Word). “I have a dream speech” (from Martin Luther King) is processed in the following example but you can use any text you want :
- Copy and paste your text in a plain text file
- Save the file (e.g : ml.txt)
Generate the word cloud using the R code below :
source('http://www.sthda.com/upload/rquery_wordcloud.r')
filePath <- "http://www.sthda.com/sthda/RDoc/example-files/martin-luther-king-i-have-a-dream-speech.txt"
res<-rquery.wordcloud(filePath, type ="file", lang = "english")
Change the arguments max.words and min.freq to plot more words :
- max.words : maximum number of words to be plotted.
- min.freq : words with frequency below min.freq will not be plotted
res<-rquery.wordcloud(filePath, type ="file", lang = "english",
                 min.freq = 1,  max.words = 200)
The above image clearly shows that “Will”, “freedom”, “dream”, “day” and “together” are the five most frequent words in Martin Luther King “I have a dream speech”.
Change the color of the word cloud
The color of the word cloud can be changed using the argument colorPalette.
Allowed values for colorPalete :
- a color name (e.g.: colorPalette = “blue”)
- a color code (e.g.: colorPalette = “#FF1425”)
- a name of a color palette taken from RColorBrewer package (e.g.: colorPalette = “Dark2”)
The color palettes associated to RColorBrewer package are shown below :

Color palette can be changed as follow :
# Reds color palette
res<-rquery.wordcloud(filePath, type ="file", lang = "english",
                      colorPalette = "Reds")
# RdBu color palette
res<-rquery.wordcloud(filePath, type ="file", lang = "english",
                      colorPalette = "RdBu")
# use unique color
res<-rquery.wordcloud(filePath, type ="file", lang = "english",
                      colorPalette = "black")


Operations on the result of rquery.wordcloud() function
As mentioned above, the result of rquery.wordcloud() is a list containing two objects :
- tdm : term-document matrix
- freqTable : frequency table
tdm <- res$tdm
freqTable <- res$freqTable
Frequency table of words
The frequency of the first top10 words can be displayed and plotted as follow :
# Show the top10 words and their frequency
head(freqTable, 10)
word freq
will will 17
freedom freedom 13
ring ring 12
day day 11
dream dream 11
let let 11
every every 9
able able 8
one one 8
together together 7# Bar plot of the frequency for the top10
barplot(freqTable[1:10,]$freq, las = 2,
names.arg = freqTable[1:10,]$word,
col ="lightblue", main ="Most frequent words",
ylab = "Word frequencies")
Operations on term-document matrix
You can explore the frequent terms and their associations. In the following example, we want to identify words that occur at least four times :
findFreqTerms(tdm, lowfreq = 4) [1] "able" "day" "dream" "every" "faith" "free" "freedom" "let" "mountain" "nation"
[11] "one" "ring" "shall" "together" "will" You could also analyze the correlation (or association) between frequent terms. The R code below identifies which words are associated with “freedom” in I have a dream speech :
findAssocs(tdm, terms = "freedom", corlimit = 0.3) freedom
let 0.89
ring 0.86
mississippi 0.34
mountainside 0.34
stone 0.34
every 0.32
mountain 0.32
state 0.32Create a word cloud of a web page
In this section we’ll make a tag cloud of the following web page :
http://www.sthda.com/english/wiki/create-and-format-powerpoint-documents-from-r-software
url = "http://www.sthda.com/english/wiki/create-and-format-powerpoint-documents-from-r-software"
rquery.wordcloud(x=url, type="url")
The above word cloud shows that “powerpoint”, “doc”, “slide”, “reporters” are among the most important words on the analyzed web page. This confirms the fact that the article is about creating PowerPoint document using ReporteRs package in R
R code of rquery.wordcloud function
#++++++++++++++++++++++++++++++++++
# rquery.wordcloud() : Word cloud generator
# - http://www.sthda.com
#+++++++++++++++++++++++++++++++++++
# x : character string (plain text, web url, txt file path)
# type : specify whether x is a plain text, a web page url or a file path
# lang : the language of the text
# excludeWords : a vector of words to exclude from the text
# textStemming : reduces words to their root form
# colorPalette : the name of color palette taken from RColorBrewer package,
  # or a color name, or a color code
# min.freq : words with frequency below min.freq will not be plotted
# max.words : Maximum number of words to be plotted. least frequent terms dropped
# value returned by the function : a list(tdm, freqTable)
rquery.wordcloud <- function(x, type=c("text", "url", "file"),
                          lang="english", excludeWords=NULL,
                          textStemming=FALSE,  colorPalette="Dark2",
                          min.freq=3, max.words=200)
{
  library("tm")
  library("SnowballC")
  library("wordcloud")
  library("RColorBrewer")

  if(type[1]=="file") text <- readLines(x)
  else if(type[1]=="url") text <- html_to_text(x)
  else if(type[1]=="text") text <- x

  # Load the text as a corpus
  docs <- Corpus(VectorSource(text))
  # Convert the text to lower case
  docs <- tm_map(docs, content_transformer(tolower))
  # Remove numbers
  docs <- tm_map(docs, removeNumbers)
  # Remove stopwords for the language
  docs <- tm_map(docs, removeWords, stopwords(lang))
  # Remove punctuations
  docs <- tm_map(docs, removePunctuation)
  # Eliminate extra white spaces
  docs <- tm_map(docs, stripWhitespace)
  # Remove your own stopwords
  if(!is.null(excludeWords))
    docs <- tm_map(docs, removeWords, excludeWords)
  # Text stemming
  if(textStemming) docs <- tm_map(docs, stemDocument)
  # Create term-document matrix
  tdm <- TermDocumentMatrix(docs)
  m <- as.matrix(tdm)
  v <- sort(rowSums(m),decreasing=TRUE)
  d <- data.frame(word = names(v),freq=v)
  # check the color palette name
  if(!colorPalette %in% rownames(brewer.pal.info)) colors = colorPalette
  else colors = brewer.pal(8, colorPalette)
  # Plot the word cloud
  set.seed(1234)
  wordcloud(d$word,d$freq, min.freq=min.freq, max.words=max.words,
            random.order=FALSE, rot.per=0.35,
            use.r.layout=FALSE, colors=colors)

  invisible(list(tdm=tdm, freqTable = d))
}
#++++++++++++++++++++++
# Helper function
#++++++++++++++++++++++
# Download and parse webpage
html_to_text<-function(url){
  library(RCurl)
  library(XML)
  # download html
  html.doc <- getURL(url)
  #convert to plain text
  doc = htmlParse(html.doc, asText=TRUE)
 # "//text()" returns all text outside of HTML tags.
 # We also don’t want text such as style and script codes
  text <- xpathSApply(doc, "//text()[not(ancestor::script)][not(ancestor::style)][not(ancestor::noscript)][not(ancestor::form)]", xmlValue)
  # Format text vector into one character string
  return(paste(text, collapse = " "))
}
Infos
This analysis has been performed using R (ver. 3.1.0).
Enjoyed this article? I’d be very grateful if you’d help it spread by emailing it to a friend, or sharing it on Twitter, Facebook or Linked In.
Show me some love with the like buttons below… Thank you and please don’t forget to share and comment below!!
Avez vous aimé cet article? Je vous serais très reconnaissant si vous aidiez à sa diffusion en l’envoyant par courriel à un ami ou en le partageant sur Twitter, Facebook ou Linked In.
Montrez-moi un peu d’amour avec les like ci-dessous … Merci et n’oubliez pas, s’il vous plaît, de partager et de commenter ci-dessous!
Создаем облако слов в Python
Облако слов в Python представляет собой визуализированный набор слов с наибольшей частотой использования в тексте или базе данных. Чем чаще встречается слово в источнике, тем большим размером шрифта оно написано в облаке слов. Таким образом, благодаря визуальным эффектам, читатель с первого взгляда на, казалось бы, мило перемешанную кашу из слов, способен сформировать общее представление о сути текста или содержимого базы данных. Выходит, эта «каша» — весьма полезное блюдо для анализа данных, поэтому самое время взглянуть на рецепт приготовления и сформировать облако слов в Python!
В качестве примера мы рассмотрим датасет с информацией о статьях текущего сайта. Сформируем облако слов в Python на основе текстовой информации из колонки «Title». Действовать будем поэтапно:
- Сначала мы загрузим датасет
- После этого познакомимся с основным принципом создания облака слов и сформируем стандартное прямоугольное облако на неочищенных данных.
- Затем, используя функции препроцессинга текста, преобразуем наши данные и выведем прямоугольное облако на подготовленных данных.
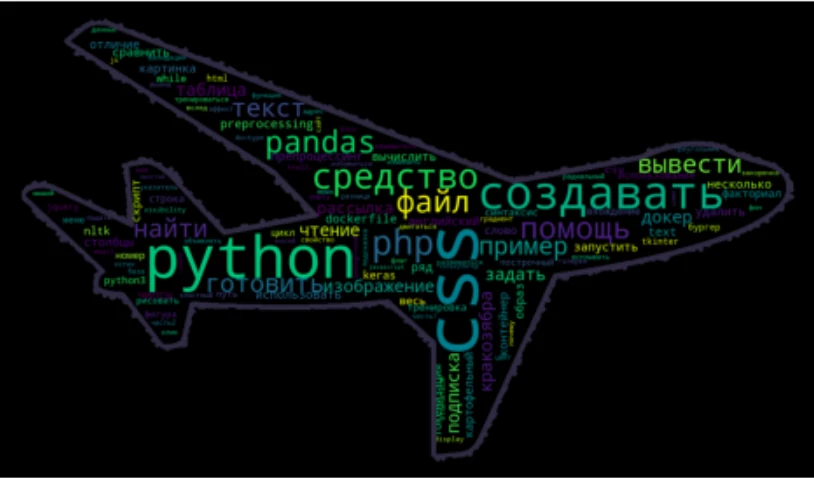
- И в заключение, сформируем облако слов в виде фигуры, загруженной в качестве маски из jpg-изображения. В нашем случае это будет фигура самолета.
Итак, открываем редактор, потому как пришло время покодить!
1. Загружаем датасет
Скачать файл с данными можно по ссылке: «articles.csv». Для загрузки датасета нам необходимо импортировать библиотеку pandas, после чего можно загружать данные из файла в переменную data с помощью функции open(). Так как у меня датасет находится в одной папке со скриптом, то относительный путь, передаваемый в качестве аргумента функции open(), совпадает с названием файла:
import pandas as pd
import matplotlib.pyplot as plt

data = pd.read_csv("articles.csv")
data.head()
Отлично, данные загружены, можно приступать к созданию облака слов!
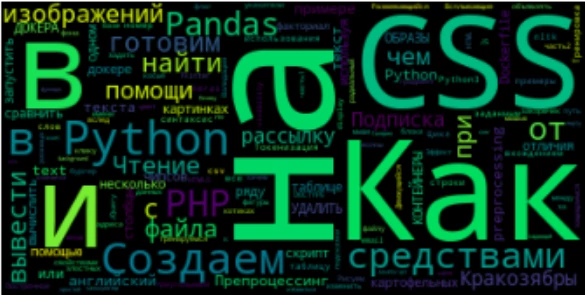
2. Создаем первое облако слов в Python — знакомимся с основным принципом на сырых данных:
Сейчас мы намеренно пропустим процесс подготовки данных, чтобы посмотреть, какое облако слов сформируется из сырого текста. Единственное, что нам потребуется сделать — это объединить данные из колонки «Title» в один текст. Это легко сделать с помощью функции «join» — добавленная строка выделена подсветкой:
import pandas as pd

# Считываем содержимое файла в переменную data
data = pd.read_csv("articles.csv")
data.head()

# Объединяем данные из колонки 'Title'
text = ' '.join(data['Title'])
А теперь загрузим класс WordCloud из библиотеки wordcloud и сгенерируем облако слов с помощью функции generate(). В качестве аргумента функции generate() передадим наш текст. После этого выведем сгенерированное облако с помощью библиотеки matplotlib. Добавленные на этом этапе строки выделены в коде подсветкой:
import pandas as pd
import matplotlib.pyplot as plt
# загружаем класс WordCloud из библиотеки wordcloud
from wordcloud import WordCloud

data = pd.read_csv("articles.csv")
text = ' '.join(data['Title'])

# Генерируем облако слов и сохраняем в переменной cloud
cloud = WordCloud().generate(text)
# Выводим облако слов на экран
plt.imshow(cloud)
# Отключаем отображение осей
plt.axis('off')
В результате исполнения кода, получим:
3. Осуществляем предобработку текста
3.1. Удаляем стоп-слова
На первый взгляд, получилось довольно приятное облако. Однако, после второго взгляда хочется воскликнуть: «Обманули! Подменили!..» и так далее. Ведь мы на самом деле ожидали, что крупным шрифтом будут написаны основные значащие слова, а вместо этого на переднем плане оказались теряющие смысл без контекста предлоги: «как, в, на, и». Эти предлоги называются стоп-словами, и они действительно чаще всего используются в нашей речи, однако в большинстве случаев при анализе текста, являются лишним шумом. Этот фактор был учтен создателями библиотеки wordcloud, и для объекта облака слова WordCloud() был добавлен параметр stopwords. По умолчанию, значение этого параметра «None», это значит, что функция использует встроенный список стоп-слов, среди которых присутствуют английские слова, но нет русских. Поэтому при выводе облака слов на основе английского текста, не нужно менять значение параметра stopwords — предлоги, союзы и прочие артикли будут исключены автоматически. В нашем же случае, необходимо передать параметру stopwords список со стоп-словами русского языка. Этот список есть в библиотеке nltk. Давайте это сделаем! (добавленные строки выделены подсветкой):
import pandas as pd
from wordcloud import WordCloud
import matplotlib.pyplot as plt

# подгружаем библиотеку nltk со стоп-словами
from nltk.corpus import stopwords
# сохраняем список с русскими стоп-cловами в переменную stop_words
stop_words = stopwords.words('russian')

data = pd.read_csv("articles.csv")
text = ' '.join(data['Title'])

# Определяем параметр stopwords при создании объекта облака слов
cloud = WordCloud(stopwords=stop_words).generate(text)

plt.imshow(cloud)
plt.axis('off')
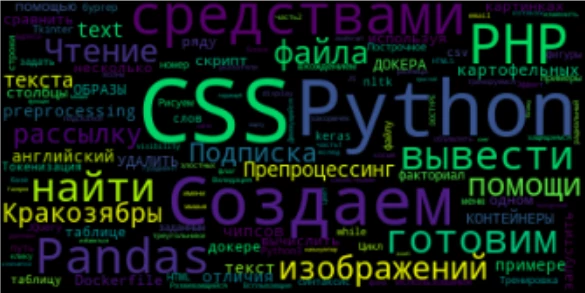
3.2. Разбиваем текст на токены и получаем леммы
Отлично! Теперь предлоги исчезли из облака слов! Однако, выводятся слова с разными склонениями, такие как «помощи», «изображений», «файла» и т. д. Конечно, можно оставить оставить эти слова в покое, однако я предлагаю добавить немного строк кода, чтобы привести их все к основной форме до загрузки текста в функцию generate(). Для этого мы будем использовать библиотеку созданную для лемматизации русского и украинского языков под названием pymorphy2. Однако, предварительно, нам потребуется разбить текст на слова, другими словами, токенизировать текст:
import pandas as pd
from wordcloud import WordCloud
import matplotlib.pyplot as plt

# Импортируем библиотеку для лемматизации русских и украинских слов
import pymorphy2
# Импортируем метод word_tokenize из библиотеки nltk
from nltk.tokenize import word_tokenize

from nltk.corpus import stopwords
stop_words = stopwords.words('russian')

data = pd.read_csv("articles.csv")
text = ' '.join(data['Title'])

# разбиваем текст на токены
# в результате получаем переменную типа list со списком токенов
text = word_tokenize(text)

# инициализируем лемматайзер MorphAnalyzer()
lemmatizer = pymorphy2.MorphAnalyzer()

# функция для лемматизации текста, на вхд принимает список токенов
def lemmatize_text(tokens):
    # создаем переменную для хранения преобразованного текста
    text_new=''
    # для каждого токена в тексте
    for word in tokens:
        # с помощью лемматайзера получаем основную форму
        word = lemmatizer.parse(word)
        # добавляем полученную лемму в переменную с преобразованным текстом
        text_new = text_new + ' ' + word[0].normal_form
    # возвращаем преобразованный текст
    return text_new

# вызываем функцию лемматизации для списка токенов исходного текста
text = lemmatize_text(text)

# генерируем облако слов
cloud = WordCloud(stopwords=stop_words).generate(text)
plt.imshow(cloud)
plt.axis('off')
В код была добавлена токенизация исходного текста, а также функция для лемматизации полученного списка токенов <strong>lemmatize_text()</strong>. По завершению цикла <strong>for</strong> функция <strong>lemmatize_text()</strong> возвращает строку с преобразованным текстом, прошедшим через токенизацию и лемматизацию! Посмотрим на результат:
Отлично! Теперь содержание нашего облака на высоте, а значит, пришло время побаловаться с параметрами WordCloud и поправить обертку! Для начала я предлагаю изменить форму облака слов!
4. Меняем форму облака слов
Чтобы изменить форму облака слов, нужно:
- Загрузить изображение, которое будет использоваться в качестве маски при формировании облака, и преобразовать его в матрицу
- Передать параметру mask в качестве значения полученную матрицу
- По желанию добавить параметры обводки полученной фигуры: contour_width и contour_color
Реализуем задуманное: загрузим изображение «plane.jpg» и определим параметры в WordCloud():
import pandas as pd
from wordcloud import WordCloud
import matplotlib.pyplot as plt
import pymorphy2
import nltk
from PIL import Image
# импортируем библиотеку numpy для преобразования изображения в массив
import numpy as np
from nltk.tokenize import word_tokenize
from nltk.corpus import stopwords
stop_words = stopwords.words('russian')

data = pd.read_csv("articles.csv")
text = ' '.join(data['Title'])

text = word_tokenize(text)
lemmatizer = pymorphy2.MorphAnalyzer()

def lemmatize_text(tokens):
    text_new=''
    for word in tokens:
        word = lemmatizer.parse(word)
        text_new = text_new + ' ' + word[0].normal_form
    return text_new
text = lemmatize_text(text)

# загружаем изображение с самолетом и преобразуем в матрицу
cake_mask = np.array(Image.open('plane.jpg'))

# генерируем облако слов
cloud = WordCloud(stopwords=stop_words, mask=cake_mask, contour_width=10, contour_color='#2e3043').generate(text)
# увеличим размер выводимой фигуры
plt.figure(figsize=(9,5))
plt.imshow(cloud)
plt.axis('off')
Посмотрим на результат:
Неплохо, однако, не мешало бы поиграться с параметрами WordCloud, изменить размеры изображения и цвета на свой вкус.

У нас появился Telegram-канал для изучающих Python! Подписывайтесь по ссылке: «Кодим на Python! Вместе «питонить» веселее! 😉
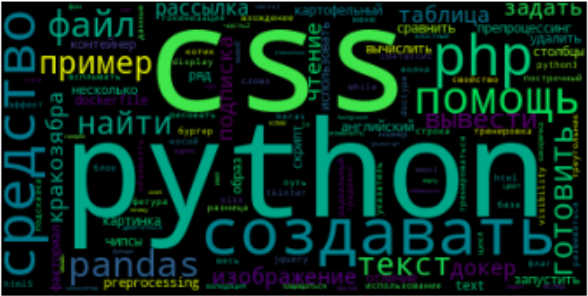
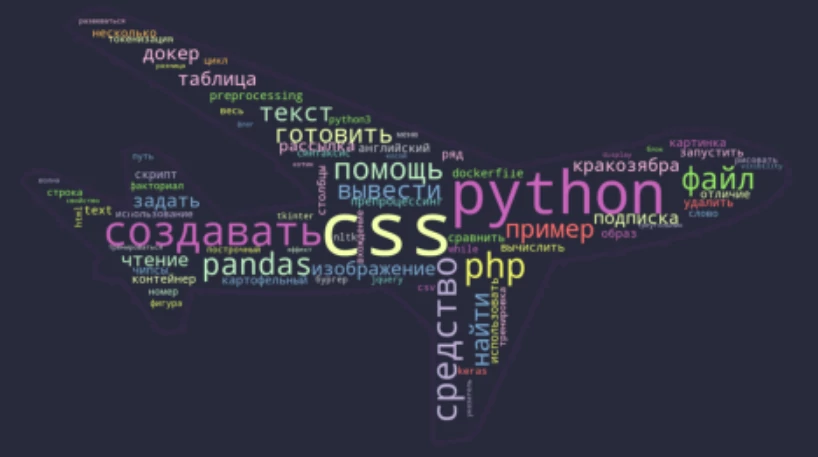
Редактируем облако слов в Python: меняем фон, цветовую схему и максимальное количество слов
У объекта WordCloud довольно много настраиваемых параметров. Описание всех параметров можно найти по ссылке в документации. Сейчас мы изменим значения лишь некоторых из них:
- background_color — цвет фона, заданный по умолчанию черный цвет фона я хочу поменять на background-color=’#272d3b’
- colormap — цветовая схема — это набор цветов, которыми будут раскрашены буквы в облаке слов. Полный набор цветовых схем можно посмотреть по ссылке: Цветовые схемы matplotlib. Я установлю значение colormap=’Set3′
- Максимальное количество слов в облаке — параметр max_words. Уменьшу количество слов до 80, max_words=80
Таким образом, после внесенных изменений итоговый код имеет вид:
import pandas as pd
from wordcloud import WordCloud
import matplotlib.pyplot as plt
import pymorphy2
import nltk
from PIL import Image
# импортируем библиотеку numpy для преобразования изображения в массив
import numpy as np
from nltk.tokenize import word_tokenize
from nltk.corpus import stopwords
stop_words = stopwords.words('russian')
data = pd.read_csv("articles.csv")
text = ' '.join(data['Title'])
text = word_tokenize(text)
lemmatizer = pymorphy2.MorphAnalyzer()
def lemmatize_text(tokens):
text_new=''
for word in tokens:
word = lemmatizer.parse(word)
text_new = text_new + ' ' + word[0].normal_form
return text_new
text = lemmatize_text(text)
# загружаем изображение с самолетом и преобразуем в матрицу
cake_mask = np.array(Image.open('plane.jpg'))
# генерируем облако слов
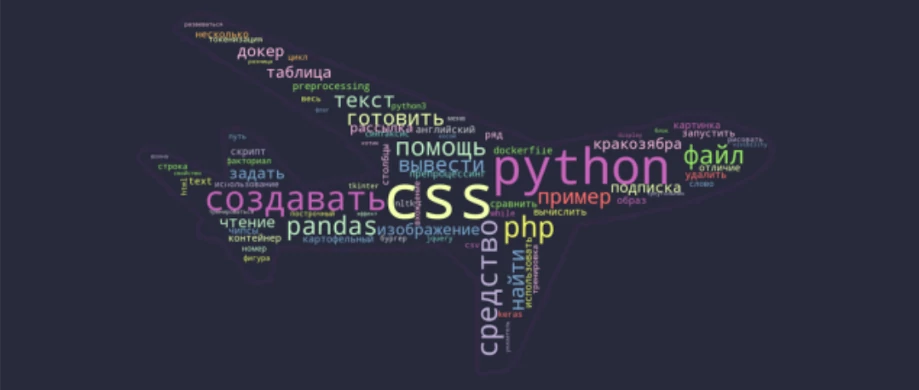
cloud = WordCloud(stopwords=stop_words, mask=cake_mask, contour_width=10, contour_color='#2e3043', background_color='#272d3b', colormap='Set3', max_words=80).generate(text)
# увеличим размер выводимой фигуры
plt.figure(figsize=(9,5))
plt.imshow(cloud)
plt.axis('off')
Отлично! Теперь полученное облако слов выводится в виде симпатичного самолета:
Заключение:
Поздравляю вас с успешно проделанной работой! Мы изучили основной принцип формирования облака слов в Python, подготовили русский текст для формирования корректного облака, а также научились менять цвет и форму облака слов. В итоге у нас получилось 2 вида облаков: стандартное облако в виде прямоугольника, и облако в форме самолета!
The Value of Our Free Word Cloud Generator
Speak’s AI word cloud generator uses machine learning and artificial intelligence to reveal insights, help with writer’s block, be a root as an AI content generator and more.
Word clouds are a great way to highlight the most important words, topics and phrases in a text passage based on frequency and relevance. Generate word clouds from your text data to create an easily understood visual breakdown for deeper analysis. Use our free word cloud generator below!
Speak’s online tool demo is the best free word cloud generator that can serve as your word cloud maker, allowing you to get a word cloud online and be a great tool for brainstorming word clouds so that you can present meaningful visualizations.
More than a free word cloud creator or a basic word cloud, Speak can generate clickable word clouds. Speak makes word cloud creation instant so you can make your own word cloud, word cloud art, tag cloud, Twitter word cloud generator or other variations of keyword cloud generators to drive value and understanding for stakeholders. You can even create a free wordle generator! The possibilities are endless with a word cloud creator free of risk and technical difficulties.
You can also check out how to transcribe a YouTube video to effortlessly bring valuable video content into Speak for transcription and analysis so that you can produce free word cloud generation.
What Is A Word Cloud?
Word clouds, also known as tag clouds, are visual representations of text data. They are used to provide insight into the structure, content, and meaning of a text by displaying the most frequently used words in the text.
What Data Is Good For Word Clouds?
Drop your text, call transcripts, customer reviews, blog content, website copy and more and instantly see brands, locations, numbers, events, products and more visualized. With a Speak account, you can add custom keywords and phrases that will also appear in your visualizations!
What Is The Purpose Of A Word Cloud?
This information can be useful for a variety of purposes, from market research to data analysis.
Words clouds are often used to explore relationships between words and phrases, allowing users to quickly gain an understanding of the text. For example, word clouds can be used to compare the language used in different files, identify the most frequently used words in a particular text, or uncover the meaning of a text by displaying the words in a visually appealing way.
The purpose of word clouds is to quickly convey information. By displaying the most frequently used words in a text, they can help to identify the main themes and topics of the text. This makes them a useful tool for market research, as they can help to identify the main topics that customers are interested in, as well as the language they use to talk about those topics.
Word clouds can also be used to compare multiple texts, audio files, video files and other types of unstructured language data media. Comparing the words used in each text can help to identify the similarities and differences between them. This can be useful for data analysis, as it can help to identify patterns and trends in the data.
Word clouds can also be used to help to get an understanding of the general sentiment of the text. For example, media full of negative words might imply a negative sentiment, while media with more positive words might imply a positive sentiment.
Word clouds can also be a useful tool for search engine optimization. Displaying the most important words and recurring words used in media can give you ideas and help you optimize your content for search engines.
Who Uses Word Clouds?
Word clouds are a popular tool for businesses of all sizes to visualize large amounts of data in a visually pleasing way. Word clouds are used by businesses to gain insights from customer feedback, surveys, and other sources of data. They are used to provide an overall picture of how customers feel about a product, service, or company.
Word clouds are used by small and medium-sized businesses, marketing agencies, market research firms, organizations with 51 to 1,000 employees, marketers, qualitative researchers, customer experience managers, market researchers, product researchers, SEO specialists, business analysts, data scientists, academic researchers, business owners and more.
Small & Medium Sized Businesses
Small and medium-sized businesses can use word clouds to gain insight into customer feedback and to get an overall picture of how customers feel about their product or service.
Word clouds can help small businesses gain a better understanding of the customer’s needs and wants, as well as what they are looking for in terms of product or service offerings. This understanding can be used to create better marketing campaigns and to help the business better understand its customer base.
Marketing Agencies
Marketing agencies can use word clouds to help them create more targeted campaigns. By understanding the customer’s needs and wants, marketing agencies can create campaigns that are more likely to resonate with the customer. Word clouds can also help marketing agencies identify the most popular words and phrases associated with a business or product, which can help them create more effective campaigns.
Market Research Firms
Market research firms can use word clouds to gain insights into customer feedback and to get a better understanding of customer sentiment. By understanding the customer’s needs and wants, market research firms can create better surveys and polls to gain more accurate feedback. Word clouds can also help market research firms identify the most common words and phrases associated with a business or product, which can help them create more effective surveys and polls.
Advantages And Disadvantages Of Word Clouds
It is also worthwhile to explore the advantages and disadvantages of using word clouds to visualize data. We’ll look at why they are useful for business owners and professionals, and how they can be detrimental if not used correctly. After reading this article, you should have a better understanding of what word clouds can do and how to best use them for your business needs.
Advantages of Word Clouds
Easily Interpretable
Word clouds make complex data more easily interpretable by transforming it into an eye-catching visual that can be understood by even those who aren’t familiar with interpreting data reports. This makes it easier for customers and business owners alike to identify trends within their data sets quickly and accurately.
Quickly Identify Keywords
By filtering out unnecessary words and displaying only the most common terms in a visually appealing manner, word clouds allow users to quickly identify keywords that are relevant to their search query or project objectives.
Creates Aesthetic Visuals
Word clouds are an aesthetically pleasing way to present data in a way that looks visually appealing without sacrificing accuracy or readability. This makes them great for presentations or online content that requires visual appeal for maximum impact on viewers.
Affordable & Easy To Set Up
Setting up a word cloud is relatively easy and affordable compared to other types of data visualization tools. Many online tools allow users to quickly set up word clouds with minimal effort required, making them ideal for those who don’t want to invest too much time or money into creating visuals from their data sets.
Disadvantages of Word Clouds
May Not Be Accurate Representation Of Data
While word clouds do provide an aesthetically pleasing representation of selected terms within a given data set, they cannot accurately represent the full scope of the information contained within it due to their simplified nature – meaning that any conclusions drawn from these visuals should be taken with a grain of salt until confirmed by further analysis.
Reduced Readability
Since the sizes of words displayed in a word cloud are determined by frequency rather than grammar rules, it can be difficult for readers to parse out individual words without enough context surrounding them which can lead to difficulties in understanding what is being presented – particularly when trying to spot patterns within dense data sets with multiple terms involved.
Not Customizable Enough For Complex Projects
Although word clouds are great for quickly presenting basic information in an attractive visual format, they may not be detailed enough when working on more complex projects as there aren’t many options available when it comes to customization or formatting features offered with most available services or software programs – like changing colours/backgrounds/fonts etc., which could limit its effectiveness depending on the type project being worked on or result desired from the visualization process.
What Is The Best Word Cloud Generator?
We’ve got a little bias here at Speak AI that our software is the best word cloud generator, but to help guide you on our journey we’ve also created a list of the best word cloud generator software so your data visualization journey is as successful as possible!
Use Our Free Speak Word Cloud Generator Tool!
Word clouds can offer businesses several advantages when used correctly including providing an easy-to-interpret visual representation of text-based data sets as well as identifying common keywords quickly and creating aesthetically pleasing visuals for presentations or online content purposes.
However, there are several drawbacks that need to be considered before using this tool such as reduced accuracy due to oversimplification and limited customization options which could limit its effectiveness depending on the project’s requirements or desired outcome from the visualization process.
As with any tool or technique used in business applications, understanding all potential advantages and disadvantages is key – so consider carefully before deciding if this tool is right for you and your business needs!