
I’ve been playing around with building some Stock Tracking tools for Excel and I’ve learned a lot about how to query data from Yahoo! Finances API to get it into Excel while it’s all fresh in my memory, I figured I would take some time and document some of the techniques I’ve been using in my spreadsheets.
Breakdown Of The Yahoo! Finance Query URL
The premise behind how you query stock information in your web browser ultimately boils down to the URL address. Here is the standard URL address formula with two inputs (the Ticker Symbol and the Data Type).
https://download.finance.yahoo.com/d/quotes.csv?s= [Ticker Symbol] &f= [Data Type]
A Few Examples
To get this data from a web address into an Excel spreadsheet, we can use the WEBSERVICE() function. I’ll also wrap a NUMBERVALUE() function around to convert the import text from Yahoo! Finance into a numerical value we can use inside Excel.
Example 1: Pull The «Current Stock Price» for Microsoft’s Stock
=NUMBERVALUE(WEBSERVICE(«https://download.finance.yahoo.com/d/quotes.csv?s=MSFT&f=l1«))
Example 2: Pull The «Current Dividend» for Microsoft’s Stock
=NUMBERVALUE(WEBSERVICE(«https://download.finance.yahoo.com/d/quotes.csv?s=MSFT&f=d«))
Example 3: Pull «% change From 52 Week Low» for Microsoft
This one is a little bit trickier because the results from the url have a plus sign or a negative sign in front of the resulting % change which the NUMBERVALUE() function does not like. In the following formula, I am taking the result from Yahoo! finance and removing the first character (ie +/-) from the result.
=NUMBERVALUE(REPLACE(WEBSERVICE(«https://download.finance.yahoo.com/d/quotes.csv?s=MSFT&f=j6«),1,1,»»))
Example 4: Link your Ticker Symbols to a Spreadsheet Cell
If you want to use the same formula for a bunch of different ticker symbols, you can link your formula using a cell reference. Here is the same formula from Example 1, however it is now point to a ticker symbol in cell A2.
=NUMBERVALUE(WEBSERVICE(«https://download.finance.yahoo.com/d/quotes.csv?s=» & A2 & «&f=l1«))
Data Type Tables
Yahoo! has a whole collection of data points you can pull about a specific ticker symbol. Here is a list of the variables and what they pull in:
I’m not sure what the end goal is for this move, maybe they will begin offerring a paid service in the future. Due to this recent event, the below VBA code to pull historical data from Yahoo! finance will not long work unless they bring back the old API method.
Yahoo! Finance has a ton of historical data for stocks and harnessing VBA’s automating power to pull this data in seconds can allow you to perform some unbelievable tailor-made analysis. Let’s take this very simple setup in Excel where we have the Stock Ticker in Cell B2 and the Start/End date range you want to pull in Cell C4 and Cell F4 respectively. Also, the Excel Table is named «StockTable».
See if you can follow along with the VBA as it pulls data directly from Yahoo! Finance and places it into Excel. There is a little extra clean up you need to do since the query is pulled into excel as a CSV (comma separated values) data set.
ALSO NOTE: Through some testing, it seems you will need to have at least one extra column in your table (ie the black section in the image above) in order to retain the Table Object after the VBA performs the TextToColumns function. You can just leave this extra column blank if you do not need to perform any extra calculations.
Sub YahooFinanceQuery()
‘PURPOSE: Pull Historical Stock Data From Yahoo! Finance
‘SOURCE: www.TheSpreadsheetGuru.com
Dim EndDate As Date
Dim StartDate As Date
Dim StockTicker As String
Dim QueryURL As String
Dim QueryDataRange As Range
Dim QueryLocation As Range
Dim tbl As ListObject
‘Optimize Code
Application.ScreenUpdating = False
Application.DisplayAlerts = False
‘Query Parameters
StartDate = Range(«C4»).Value
EndDate = Range(«F4»).Value
StockTicker = Range(«B2»).Value
‘Store Table Object to a Variable
Set tbl = ActiveSheet.ListObjects(«StockTable»)
‘Determine Where To Place Query (Column Prior To Table)
Set QueryLocation = tbl.Range(1, 1).Offset(0, -1)
QueryLocation.EntireColumn.Insert Shift:=xlToRight, CopyOrigin:=xlFormatFromLeftOrAbove
Set QueryLocation = QueryLocation.Offset(0, -1)
‘Delete all table rows except first row
With tbl.DataBodyRange
If .Rows.Count > 1 Then
.Offset(1, 0).Resize(.Rows.Count — 1, .Columns.Count).Rows.Delete
End If
End With
‘Create Web Address To Query Historic Stock Data
QueryURL = «http://ichart.finance.yahoo.com/table.csv?s=» & StockTicker
QueryURL = QueryURL & «&a=» & Month(StartDate) — 1 & «&b=» & Day(StartDate) & _
«&c=» & Year(StartDate) & «&d=» & Month(EndDate) — 1 & «&e=» & _
Day(EndDate) & «&f=» & Year(EndDate) & «&g=» & QueryLocation & «&q=q&y=0&z=» & _
StockTicker & «&x=.csv»
‘Pull Query Into Excel
With ActiveSheet.QueryTables.Add(Connection:=»URL;» & QueryURL, Destination:=QueryLocation)
.BackgroundQuery = True
.TablesOnlyFromHTML = False
.Refresh BackgroundQuery:=False
.SaveData = True
End With
‘Determine Stock Data Range
ActiveSheet.UsedRange
Set QueryDataRange = ActiveSheet.Range(QueryLocation, Cells(ActiveSheet.Cells _
(ActiveSheet.Rows.Count, QueryLocation.Column).End(xlUp).Row — 1, QueryLocation.Column))
‘Sort Data in Ascending Order
ActiveSheet.Sort.SortFields.Clear
ActiveSheet.Sort.SortFields.Add Key:=QueryDataRange, _
SortOn:=xlSortOnValues, Order:=xlAscending, DataOption:=xlSortNormal
With ActiveSheet.Sort
.SetRange QueryDataRange
.Header = xlYes
.MatchCase = False
.Orientation = xlTopToBottom
.SortMethod = xlPinYin
.Apply
End With
‘Delimit Stock Data into Table
QueryDataRange.TextToColumns Destination:=QueryLocation.Offset(0, 2), DataType:=xlDelimited, _
TextQualifier:=xlDoubleQuote, ConsecutiveDelimiter:=False, Tab:=True, _
Semicolon:=False, Comma:=True, Space:=False, other:=False
‘Delete Yahoo! Finance Stock Query
QueryLocation.EntireColumn.Delete
‘Optimize Code
Application.ScreenUpdating = True
Application.DisplayAlerts = True
End Sub
About The Author
Hey there! I’m Chris and I run TheSpreadsheetGuru website in my spare time. By day, I’m actually a finance professional who relies on Microsoft Excel quite heavily in the corporate world. I love taking the things I learn in the “real world” and sharing them with everyone here on this site so that you too can become a spreadsheet guru at your company.
Through my years in the corporate world, I’ve been able to pick up on opportunities to make working with Excel better and have built a variety of Excel add-ins, from inserting tickmark symbols to automating copy/pasting from Excel to PowerPoint. If you’d like to keep up to date with the latest Excel news and directly get emailed the most meaningful Excel tips I’ve learned over the years, you can sign up for my free newsletters. I hope I was able to provide you with some value today and I hope to see you back here soon!
— Chris
Founder, TheSpreadsheetGuru.com
Содержание
- EXCEL: Загружаем исторические данные из Yahoo Fianance
- Последовательность шагов
- Шаг 1
- Шаг 2
- Шаг 3
- Шаг 4
- Шаг 5
- Шаг 6
- Шаг 7
- Шаг 8
- Шаг 9
- Шаг 10
- How to pull Yahoo Finance data into spreadsheets (Google Sheets and Excel)
- An Excel Blog For The Real World
- Use Yahoo! Finance To Pull Stock Information Into Excel
- WARNING.
- Breakdown Of The Yahoo! Finance Query URL
- A Few Examples
- Data Type Tables
- Refreshing The Formulas
- VBA Macro To Pull Historical Data
- ALERT!
- Get The VBA Example File
- About The Author
EXCEL: Загружаем исторические данные из Yahoo Fianance
Любой инвестор, которому приходится работать с котировками фондового рынка, постоянно решает для себя проблему доступности этой информации. Кроме того, часто повторяющиеся действия по загрузке данных всегда желательно делать максимально быстро и эффективно.
В этой публикации мы расскажем, как загружать данные из Yahoo Finance в EXCEL. Yahoo Finance по праву считается самым популярным из бесплатных источников данных. Здесь можно найти информацию по тысячам ценных бумаг из разных площадок: NYSE, NASDAQ, LSE, ММВБ (не всё). Большим преимуществом Yahoo Finance является наличие исторических данных по большому количеству индексов.
Еще одним довольно важным преимуществом данных, доступных в Yahoo Finance, являются расчетные котировки, которые учитывают выплаченные дивиденды. В Yahoo Finance они называются Adjusted Close (Adj. Close).
Последовательность шагов
На практике самый простой способ загрузить данные выглядит следующим образом.
Шаг 1
Итак, мы переходим на главную страницу Yahoo Fianance и вводим в поисковик Тикер нужной бумаги. Возьмем для примера SPY (ETF SPDR S&P 500):

Шаг 2
Переходим в раздел исторических данных:

Шаг 3
В окне оформляем запрос на нужный промежуток дат и выставляем периодичность (ежедневные данные, еженедельные, ежемесячные):

Шаг 4
Прокручиваем вниз до конца страницы и загружаем данные в текстовом формате:

Шаг 5
Открываем EXCEL и переходим в закладку «Данные», раздел «Получение внешних данных»:

Шаг 6
Находим загруженный файл (формат *.csv). В первом окне диалога загрузки данных выбираем формат данных «с разделителями» и «мои данные содержат заголовки»:

Шаг 7
Следующее окно диалога посвящено выбору разделителя между данными. В Yahoo Finance для этого используется запятая:

Шаг 8
На следующем этапе мы определяем формат каждой из колонок данных. Вмешательство потребуется только для колонки Date (первая колонка). По американской системе дата указывается в формате ГГГГ.ММ.ДД Указываем это в диалоге:

Шаг 9
На этом же окне важно указать, что разделителем целой и дробной части является «.» (точка), а не «,» (запятая) как это принято в русскоязычном EXCEL:

Шаг 10
После этого нажимаем на «Готово» и указываем EXCEL, куда загружать данные:

Нажимая на «ОК», мы получаем все данные на странице EXCEL. Дальше с ними можно работать по своему усмотрению.
Источник
How to pull Yahoo Finance data into spreadsheets (Google Sheets and Excel)
Do you prefer using spreadsheets for deeper analysis? If so, you are likely familiar with the problem of pulling high-quality, up-to-date data into a spreadsheet.
So far, Google Sheets has been my go-to app for tracking the performance of various stocks. At first, manually inputting data seemed like a great idea. However, with the growing number of stocks to track, I found that I needed a more efficient method. And here it is.
Yahoo Finance API for automated research on stocks
Yahoo Finance provides great access to metrics for the numerous stock tickers, then allows one to input the information into a spreadsheet. However, the process is still manual, which is exactly what I wanted to avoid.
So, I started researching tools to automate my routine. I found that the data could be scraped out of the Yahoo Finance website. Or, if I wanted to be more sophisticated, I could use the Yahoo Finance API to pull the data into spreadsheets using the IMPORTXML formula or the ImportJSON script. Of course, I could apply my programming skills to solve this issue, but I would rather save my time and use a no-code solution.
After a long search, I discovered the easiest way to pull real-time Yahoo Finance data into my spreadsheets with no code. Apparently, Google Sheets offers a large range of add-ons. The Google Sheets add-on is a customizable application integrated into the spreadsheet to extend its functionality. The add-ons make our beloved spreadsheets infinitely powerful!
No-coding solution for stock research
There were many good add-ons for my problem but this one, called WebDataHub, does exactly what I needed, without any knowledge of coding. It pulls all financial data I need for my research, like real-time quotes, price history, summary details, financial data, key statistics, ESG scores, income statements, cash flow statements, and balance sheet statements.
And thanks to Yahoo Finance, it is not limited to equity stocks. The add-on pulls data for various indices, currency exchange rates, cryptocurrency, ETF, mutual funds, etc. — all real-time, high-quality data in my single spreadsheet!
The WebDataHub add-on can be found and installed from the Google G Suite Marketplace directly through this link.
For those who prefer Excel over Google Sheets, I suggest first loading the data with the add-on into Google Sheets and then downloading XLSX from Google Sheets, as shown in the video.
Thanks for reading this far! I won’t tell you what analysis to perform on this type of data, as you know better than I do. However, in the comments, you can share your ideas regarding analysis using Yahoo Finance data. It would also be great if you could brainstorm ideas of what data sources can be meshed to create unique and profitable insights. For example, I’m wondering whether meshing real estate data from Zillow or Realtor.com, finance data from Yahoo Finance, short rental data from Airbnb, and travel data from Tripadvisor can help one find undervalued properties that are good for investing. Please share your thoughts in the comments.
I recently learned a few ways how the Yahoo Finance data is used for analysis and I would like to share them in the article, since the article gained a lot of attention.
First, the add-on becomes a great engine for a personal stock market portfolio tracker. The next video demonstrates how such a portfolio tracker can be configured in Google Sheets.
Second, cryptocurrencies are taking over the financial world. And as a result more investors started getting crypto data for analysis. The video below shows how to pull historical prices into spreadsheets.
Third, the CALL and PUT options are very advanced financial instruments. And the options data can be also pulled from Yahoo Finance into Google Sheets for analysis. Here is the video about how it can be done.
The comments are always welcome!
This article is for informational purposes only. It should not be considered Financial or Legal Advice. Consult a financial professional before making any major financial decisions.
Источник
An Excel Blog For The Real World
A blog focused primarily on Microsoft Excel, PowerPoint, & Word with articles aimed to take your data analysis and spreadsheet skills to the next level. Learn anything from creating dashboards to automating tasks with VBA code!
Use Yahoo! Finance To Pull Stock Information Into Excel
WARNING.
As of Q3 2017, the Yahoo! Finance capabilities in Excel have been disabled (by Yahoo!, after Verizon bought them).
Luckily, more recent versions of Excel now have built-in features that can replace the need to pull data from Yahoo! Finance. Check out these articles for more information:
I’ve been playing around with building some Stock Tracking tools for Excel and I’ve learned a lot about how to query data from Yahoo! Finances API to get it into Excel while it’s all fresh in my memory, I figured I would take some time and document some of the techniques I’ve been using in my spreadsheets.
Breakdown Of The Yahoo! Finance Query URL
The premise behind how you query stock information in your web browser ultimately boils down to the URL address. Here is the standard URL address formula with two inputs (the Ticker Symbol and the Data Type).
https://download.finance.yahoo.com/d/quotes.csv?s= [Ticker Symbol] &f= [Data Type]
A Few Examples
To get this data from a web address into an Excel spreadsheet, we can use the WEBSERVICE() function. I’ll also wrap a NUMBERVALUE() function around to convert the import text from Yahoo! Finance into a numerical value we can use inside Excel.
Example 1: Pull The «Current Stock Price» for Microsoft’s Stock
=NUMBERVALUE(WEBSERVICE(«https://download.finance.yahoo.com/d/quotes.csv?s=MSFT&f=l1«))
Example 2: Pull The «Current Dividend» for Microsoft’s Stock
=NUMBERVALUE(WEBSERVICE(«https://download.finance.yahoo.com/d/quotes.csv?s=MSFT&f=d«))
Example 3: Pull «% change From 52 Week Low» for Microsoft
This one is a little bit trickier because the results from the url have a plus sign or a negative sign in front of the resulting % change which the NUMBERVALUE() function does not like. In the following formula, I am taking the result from Yahoo! finance and removing the first character (ie +/-) from the result.
=NUMBERVALUE(REPLACE(WEBSERVICE(«https://download.finance.yahoo.com/d/quotes.csv?s=MSFT&f=j6«),1,1,»»))
Example 4: Link your Ticker Symbols to a Spreadsheet Cell
If you want to use the same formula for a bunch of different ticker symbols, you can link your formula using a cell reference. Here is the same formula from Example 1, however it is now point to a ticker symbol in cell A2.
=NUMBERVALUE(WEBSERVICE(«https://download.finance.yahoo.com/d/quotes.csv?s=» & A2 & «&f=l1«))
Data Type Tables
Yahoo! has a whole collection of data points you can pull about a specific ticker symbol. Here is a list of the variables and what they pull in:
Stock Pricing
Averages
| Variable | Description |
|---|---|
| a | Ask |
| b | Bid |
| b2 | Ask (Real-time) |
| b3 | Bid (Real-time) |
| p | Previous Close |
| o | Open |
| c1 | Change |
| c | Change & Percent Change |
| c6 | Change (Real-time) |
| k2 | Change Percent (Real-time) |
| p2 | Change in Percent |
| d1 | Last Trade Date |
| d2 | Trade Date |
| t1 | Last Trade Time |
Dividends
| Variable | Description |
|---|---|
| y | Dividend Yield |
| d | Dividend per Share |
| r1 | Dividend Pay Date |
| q | Ex-Dividend Date |
| Variable | Description |
|---|---|
| c8 | After Hours Change (Real-time) |
| c3 | Commission |
| g | Day’s Low |
| h | Day’s High |
| k1 | Last Trade (Real-time) With Time |
| l | Last Trade (With Time) |
| l1 | Last Trade (Price Only) |
| t8 | 1-Year Target Price |
| m5 | Change From 200 Day Moving Average |
| m6 | % Change From 200 Day Moving Average |
| m7 | Change From 50 Day Moving Average |
| m8 | % Change From 50 Day Moving Average |
| m3 | 50-Day Moving Average |
| m4 | 200-Day Moving Average |
Volume
| Variable | Description |
|---|---|
| v | Volume |
| a5 | Ask Size |
| b6 | Bid Size |
| k3 | Last Trade Size |
| a2 | Average Daily Volume |
52-Week Pricing
Ticker Related Information
| Variable | Description |
|---|---|
| k | 52-Week High |
| j | 52-Week Low |
| j5 | Change From 52-Week Low |
| k4 | Change From 52-Week High |
| j6 | Percent Change From 52-Week Low |
| k5 | Percent Change From 52-Week High |
| w | 52-Week Range |
| g1 | Holdings Gain Percent |
| g3 | Annualized Gain |
| g4 | Holdings Gain |
| g5 | Holdings Gain Percent (Real-time) |
| g6 | Holdings Gain (Real-time) |
| Variable | Description |
|---|---|
| i | More Info |
| j1 | Market Capitalization |
| j3 | Market Cap (Real-time) |
| f6 | Float Shares |
| n | Name |
| n4 | Notes |
| s | Symbol |
| s1 | Shares Owned |
| x | Stock Exchange |
| j2 | Shares Outstanding |
Financial Ratios
| Variable | Description |
|---|---|
| e | Earnings per Share |
| e7 | EPS Estimate Current Year |
| e8 | EPS Estimate Next Year |
| e9 | EPS Estimate Next Quarter |
| b4 | Book Value |
| j4 | EBITDA |
| p5 | Price / Sales |
| p6 | Price / Book |
| r | P/E Ratio |
| r2 | P/E Ratio (Real-time) |
| r5 | PEG Ratio |
| r6 | Price / EPS Estimate Current Year |
| r7 | Price / EPS Estimate Next Year |
| s7 | Short Ratio |
Miscellaneous
| Variable | Description |
|---|---|
| t7 | Ticker Trend |
| t6 | Trade Links |
| i5 | Order Book (Realtime) |
| l2 | High Limit |
| l3 | Low Limit |
| v1 | Holdings Value |
| v7 | Holdings Value (Realtime) |
| s6 | Revenue |
| w1 | Day’s Value Change |
| w4 | Day’s Value Change (Realtime) |
| p1 | Price Paid |
| m | Day’s Range |
| m2 | Day’s Range (Realtime) |
| c4 | Currency |
Refreshing The Formulas
As you might imagine, if you are pulling realtime data from Yahoo! Finance, Excel is not going to recalculate your WEBSERVICE() formulas every second. Therefore, you will need to manually recalculate your sheet (keyboard shortcut F9) in order to refresh your formulas.
VBA Macro To Pull Historical Data
ALERT!
As of May 2017, it has been reported that Yahoo! has terminated the iChart platform which allowed us to pull historical information into Excel for free. I found this response from a Yahoo employed moderator in their forums:
I’m not sure what the end goal is for this move, maybe they will begin offerring a paid service in the future. Due to this recent event, the below VBA code to pull historical data from Yahoo! finance will not long work unless they bring back the old API method.
Yahoo! Finance has a ton of historical data for stocks and harnessing VBA’s automating power to pull this data in seconds can allow you to perform some unbelievable tailor-made analysis. Let’s take this very simple setup in Excel where we have the Stock Ticker in Cell B2 and the Start/End date range you want to pull in Cell C4 and Cell F4 respectively. Also, the Excel Table is named «StockTable».
See if you can follow along with the VBA as it pulls data directly from Yahoo! Finance and places it into Excel. There is a little extra clean up you need to do since the query is pulled into excel as a CSV (comma separated values) data set.
ALSO NOTE: Through some testing, it seems you will need to have at least one extra column in your table (ie the black section in the image above) in order to retain the Table Object after the VBA performs the TextToColumns function. You can just leave this extra column blank if you do not need to perform any extra calculations.
Sub YahooFinanceQuery()
‘PURPOSE: Pull Historical Stock Data From Yahoo! Finance
‘SOURCE: www.TheSpreadsheetGuru.com
Dim EndDate As Date
Dim StartDate As Date
Dim StockTicker As String
Dim QueryURL As String
Dim QueryDataRange As Range
Dim QueryLocation As Range
Dim tbl As ListObject
‘Optimize Code
Application.ScreenUpdating = False
Application.DisplayAlerts = False
‘Query Parameters
StartDate = Range(«C4»).Value
EndDate = Range(«F4»).Value
StockTicker = Range(«B2»).Value
‘Store Table Object to a Variable
Set tbl = ActiveSheet.ListObjects(«StockTable»)
‘Determine Where To Place Query (Column Prior To Table)
Set QueryLocation = tbl.Range(1, 1).Offset(0, -1)
QueryLocation.EntireColumn.Insert Shift:=xlToRight, CopyOrigin:=xlFormatFromLeftOrAbove
Set QueryLocation = QueryLocation.Offset(0, -1)
‘Delete all table rows except first row
With tbl.DataBodyRange
If .Rows.Count > 1 Then
.Offset(1, 0).Resize(.Rows.Count — 1, .Columns.Count).Rows.Delete
End If
End With
‘Create Web Address To Query Historic Stock Data
QueryURL = «http://ichart.finance.yahoo.com/table.csv?s=» & StockTicker
QueryURL = QueryURL & «&a=» & Month(StartDate) — 1 & «&b=» & Day(StartDate) & _
«&c=» & Year(StartDate) & «&d=» & Month(EndDate) — 1 & «&e=» & _
Day(EndDate) & «&f=» & Year( End Date) & «&g=» & QueryLocation & «&q=q&y=0&z=» & _
StockTicker & «&x=.csv»
‘Pull Query Into Excel
With ActiveSheet.QueryTables.Add(Connection:=»URL;» & QueryURL, Destination:=QueryLocation)
.BackgroundQuery = True
.TablesOnlyFromHTML = False
.Refresh BackgroundQuery:= False
.SaveData = True
End With
‘Determine Stock Data Range
ActiveSheet.UsedRange
Set QueryDataRange = ActiveSheet.Range(QueryLocation, Cells(ActiveSheet.Cells _
(ActiveSheet.Rows.Count, QueryLocation.Column). End (xlUp).Row — 1, QueryLocation.Column))
‘Sort Data in Ascending Order
ActiveSheet.Sort.SortFields.Clear
ActiveSheet.Sort.SortFields.Add Key:=QueryDataRange, _
SortOn:=xlSortOnValues, Order:=xlAscending, DataOption:=xlSortNormal
With ActiveSheet.Sort
.SetRange QueryDataRange
.Header = xlYes
.MatchCase = False
.Orientation = xlTopToBottom
.SortMethod = xlPinYin
.Apply
End With
‘Delimit Stock Data into Table
QueryDataRange.TextToColumns Destination:=QueryLocation.Offset(0, 2), DataType:=xlDelimited, _
TextQualifier:=xlDoubleQuote, ConsecutiveDelimiter:=False, Tab:=True, _
Semicolon:=False, Comma:=True, Space:= False , other:=False
‘Delete Yahoo! Finance Stock Query
QueryLocation.EntireColumn.Delete
‘Optimize Code
Application.ScreenUpdating = True
Application.DisplayAlerts = True
Get The VBA Example File
If you need a little head start or are not comfortable with VBA quite yet, I have put together a great little example Excel file with the examples covered in this article.
If you would like to get a copy of the Excel file I used throughout this article, feel free to directly download the spreadsheet by clicking the download button below.
Hey there! I’m Chris and I run TheSpreadsheetGuru website in my spare time. By day, I’m actually a finance professional who relies on Microsoft Excel quite heavily in the corporate world. I love taking the things I learn in the “real world” and sharing them with everyone here on this site so that you too can become a spreadsheet guru at your company.
Through my years in the corporate world, I’ve been able to pick up on opportunities to make working with Excel better and have built a variety of Excel add-ins, from inserting tickmark symbols to automating copy/pasting from Excel to PowerPoint. If you’d like to keep up to date with the latest Excel news and directly get emailed the most meaningful Excel tips I’ve learned over the years, you can sign up for my free newsletters. I hope I was able to provide you with some value today and I hope to see you back here soon!
Источник
Last Updated on January 26, 2023 by
In this article and video, I show you how to download price data from Yahoo Finance into Excel.
Table of Contents
Yahoo Finance is the best source of free historical price data on the internet. If you regularly use Yahoo price data in Excel, this article will save you time and help you download the data quickly and easily.
Anyone who is interested in Market Analysis, Technical Indicators, and Backtesting will benefit from this article.
What is the Free Spreadsheet?
I have created a spreadsheet to automate the download process.
This spreadsheet uses VBA to automate the downloading process. Making it quicker and easier for you to get the data you need for your analysis.
How to Use the Spreadsheet
When you open the spreadsheet you will see options to select the market, date range and frequency (period).
You then click the button, and the data is imported in your spreadsheet.
The spreadsheet was designed in Excel for Windows but should also work in Excel for Mac.

Watch The Video
In this YouTube video, I demonstrate the formulas and how to use the spreadsheet.
Get the Free Spreadsheet
You can download the spreadsheet for free by signing up to my mailing list:
Excel Formulas
If you want to create your own spreadsheet you can see the formulas that I used to create it.
URL Information Needed to Download the Data
Sample URL
Every time you download data from Yahoo Finance it generates a URL that corresponds to your query.
The URL format looks like this:
https://query1.finance.yahoo.com/v7/finance/download/%5EGSPC?period1=1530489600&period2=1593561600&interval=1wk&events=history
Market Code
The market code is the information used by Yahoo to identify the stock, ETF or currency. These codes are not always the same as the codes you will find used elsewhere.
If you don’t know the code, you can get it by going to the Yahoo Finance page for the market you are

Date Range
You need to specify the date range of the price data.
The dates are expressed in UNIX format. The formula to calculate the Unix Code is:
=(Current Date-DATE(1970,1,1))*86400
Interval (Period)
Yahoo Finance Data is available for daily, weekly and monthly periods. In the URL it is 1d, 1wk and 1mo.
The Next Step: Backtest Your Strategy
“The goal of a successful trader is to make the best trades. Money is secondary.”
Dr Alexander Elder
I do all my backtesting in Excel. Over many years I have developed a backtesting system that is easy to use for anyone familiar with Excel.
You can use it to test everything from simple investment ideas to complex quantitative strategies.
Tradinformed Backtest Models help you test your strategies, develop new strategies, and find the best settings.
Tradinformed Members get:
- A new backtest model including my results and analysis every month.
- Direct access to me through the Members Webinars.
- Exclusive tutorials so that you can quickly understand and use the models.

Mark Ursell
My name is Mark Ursell, and I am an individual trader and investor. I am continually working on developing new trading strategies and improving my existing strategies. I have developed a series of Excel backtest models, and you can learn more about them on this site.
In this article, we are going to show you how to download historical stock prices using the Yahoo Finance API called « table.csv » and discuss the following topics that will allow you successfully import data in Excel from Yahoo in a simple and automatic way:
- Yahoo Finance API
- Import external data into Excel
- Import data automatically using VBA
- Dashboard and user inputs
- Conclusion
Before we delve into the details of this subject, we assume that you know how to program in VBA or, at least, that you have already some notions of programming, as we are not going to introduce any basic programming concepts in this article. However, we hope to post other articles in a near future about more simple aspects of programming in VBA.
You can find the whole code source of this tutorial on GitHub, or you can download the following Excel file that contains the VBA code together with the Dashboard and a list of stock symbols: yahoo-hist-stock.xlsm.
Yahoo Finance API
Yahoo has several online APIs (Application Programming Interface) that provides financial data related to quoted companies: Quotes and Currency Rates, Historical Quotes, Sectors, Industries, and Companies. VBA can be used to import data automatically into Excel files using these APIs. In this article, we use the API for Historical Quotes only.
It is of course possible to access Yahoo Finance’s historical stock data using a Web browser. For example, this is a link to access Apple’s historical data, where you can directly use the Web interface to display or hide stock prices and volumes.

Now, the first step before writing any line of code is to understand how the Yahoo Finance API for Historical Stock Data is working, which implies to first learn how URL (Uniform Resource Locator) are built and used to access content on the Web. A URL is a Web address that your browser uses to access a specific Web page. We give here some two examples of Yahoo’s URLs.
- This is how a URL look like when navigating on Yahoo Finance’s Web site:
http://finance.yahoo.com/quote/GOOGL/history?ltr=1 - And this is how the URL of Yahoo Finance API look like when accessing historical stock data:
http://ichart.finance.yahoo.com/table.csv?s=GOOGL&a=0&b=1&c=20 14&d=5&e=30&f=2016&g=d
Note that these URLs both access stock data related to symbol GOOGL, i.e. the stock symbol for Google.
However, except the fact that there are tow distinct URLs, they are also quite different in the result they return. If you click on them, the first simply returns a Web page (as you would expect), while the second returns a CSV file called table.csv that can be saved on your computer. In our case, we are going to use the table.csv file.
Here is an example of data contained in this file. The table.csv file contains daily stock values of Google from the 24th to 30th December 2015.
Date,Open,High,Low,Close,Volume,Adj Close

2015-12-31,787.820007,788.330017,777.320007,778.01001,1629300,778.01001

2015-12-30,793.960022,796.460022,787.200012,790.299988,1428300,790.299988

2015-12-29,786.98999,798.690002,786.200012,793.960022,1921500,793.960022

2015-12-28,770.00,782.820007,767.72998,782.23999,1557800,782.23999

2015-12-24,768.52002,769.200012,764.390015,765.840027,520600,765.840027
As you can see, the returned CSV file always contains headers (column names) in the first line, columns are separated by comma, and each line contains measurements for a specific day. The number of lines contained in the file depends on the given parameters (start data, end date and frequency). However, the number of columns (7) will always be the same for this API.
The first column [Date] contains the date for every measurement. Columns 3 to 5 [Open,High,Low,Close] contains stock prices, where [Open] represents the recorded price when the market (here NasdaqGS) opened, [High] is the highest recorded price for a specific time interval (e.g. day), [Low] is the lowest price for a specific time interval, and [Close] is the price after the market closed. [Volume] represents the number of transactions executed during the given time interval (e.g. for a day, between market opening and closure). Finally, the [Adj Close] stands for « Adjusted Close Price » and represents the final price at the end of the day after the market closed. It may not necessary be equal to the [Close] price because of different business reasons. So, usually, we prefer to use the Adjusted Close Price instead of the Close Price.
Now, if you look more closely at URL, we can see that it is composed of two main parts (one fixed and one variable): (1) the Web site and file name [http://ichart.finance.yahoo.com/table.csv] that is fixed, and (2) the parameters that can be modified in order to get historical data from other companies and/or for different periods of time [s=GOOGL&a=0&b=1&c=20 14&d=5&e=30&f=2016&g=d]. These two parts are separated with a special character: the question mark [?].
Let’s take a closer look at the the URL parameters following the question mark. Parameter name and value must always be passed together and are separated by an equal sign “=“. For example, parameter name “s” with value “GOOGL” gives parameter “s=GOOGL” that is then attached to the URL just after the question mark “?” as follow:
http://ichart.finance.yahoo.com/table.csv?s=GOOGL
Note here that only parameter “s” is mandatory. This means that the above URL is valid and will download a file containing all historical stock data from Google (on a daily basis), i.e. since the company was first quoted on the stock exchange market. All other parameters are optional.
Additional parameters are separated with symbol “&” from each other. For example, if the next parameter is “g=d” (for daily report), the URL becomes:
http://ichart.finance.yahoo.com/table.csv?s=GOOGL&g=d
Note the difference between “g” and “d”, where “g” is the parameter name whereas “d” is the parameter value (meaning “daily”). Note also that the order in which parameters are appended to the URL is NOT important: “s=GOOGL&g=d” is equivalent to “g=d&s=GOOGL”.
For the Stock Symbol parameter “s”, a list of symbols (called tickers) can be found here.
Additionally, one might also want to to target a specific period of time. Fortunately, the API also accept parameters that allows us to reduce or increase the time window by using more parameters. Here is an exhaustive list of all parameters from the Historical Stock API:
| Parameter Name | Description | Parameter Values |
|---|---|---|
| s | Stock Symbol | Any valid ticker (e.g. GOOGL, APPL, FB, etc.) |
| a | Start Month | [0 – 11] (0=January, 1=February, …, 11=December) |
| b | Start Day | [1 – 31] (depending on start month) |
| c | Start Year | [0 – this year] (e.g. 2017) |
| d | End Month | [0 – 11] (0=January, 1=February, …, 11=December) |
| e | End Day | [1 – 31] (depending on end month) |
| f | End Year | [0 – this year] |
| g | Frequency | {d, w, m, v} (Daily, Weekly, Monthly, or Dividend respectively) |
Again, only parameter “s” is mandatory. Omitting all other parameters gives you the whole historical data for the given stock.
In short, there are 4 things that you can pass to the API (using the above 8 parameters).
- company [s]
- starting date [a, b, c]
- end date [d, e, f]
- frequency [g]
As explained above, the parameter s can take any valid stock symbol.
Parameter “a” represents the starting month and can have values from 0 to 11, where 0 is January, 1 is February, 2 is March, … and 11 is December. (Yeah, this does not make sense!) Parameter “b” represents the starting day and accept values from 1 to 31 (but, of course, this depends on the given month as not all months have 31 days). Parameter “c” represents the starting year. Parameters “d”, “e”, “f” represent the ending month, day and year, respectively, which have the same constraints as parameters “a” “b” and “c”. Finally, parameter “g” represents the data frequency and can take 4 distinct values: “d” for daily, “w” for weekly, “m” for monthly and “v” for yearly.
Hence, using all the above parameters can give, for example, the following URL:
http://ichart.finance.yahoo.com/table.csv?s=GOOGL&a=0&b=1&c=20 14&d=5&e=30&f=2016&g=d
Try to modify, add and remove the different parameters and their value to get a better understanding on how the Yahoo Finance API behaves.
Importing external data in Excel
Excel offers you several ways of importing external data into worksheets. You can import data from the following data sources: text files, Web pages, Access, SQL Server, or any another SQL database. Here, we are only going to deal with text files (such as CSV) and tables displayed on Web pages.

Import from Text Files
First, we show you how to import a CSV file stored locally on your computer into Excel. This part is crucial, as this will allow you to import and format CSV files automatically in a very simple and efficient way.
Start by downloading the table.csv file manually using this link: http://ichart.finance.yahoo.com/table.csv?s=GOOGL
(If this does not work, you can download the file directly from here: table.csv)
If you open the above file directly using Excel, chances are that (depending on your regional settings) that the file won’t be formatted as a regular table, but rather as a list of lines separated by comma. If your Windows is using US reginal settings, the CSV file will normally be formatted just fine. However, if you live in France, the CSV file will probably not be interpreted correctly. This is because in most (if not all) countries in Europe, the semi-colon is used as separator, whereas in the comma is used as separator.

Note: the difference in regional settings between countries (including but not limited to list separator, date and time) is actually the source of many bugs in software systems.
For this reason, you need to import the content of the CSV file into Excel using the “Text Import Wizard”, which will allow you to properly interpret the CSV format. To do so, open Excel and create a new Workbook. Then, click on the “Data” tab and select « From Text » in the “Get External Data” group. Locate and select the table.csv file and click OK. You should now be prompted with the “Text Import Wizard” window.
In Step 1, chose “Delimited”, as the different column in the file are delimited using a special character, namely the comma. Do not forget to precise that your file has headers (i.e. columns names) contained in the first line. Click Next.

In Step 2, you have to choose the delimiter that separate columns. Select “Comma” and deselect “Tab”. Leave the text qualifier as double-quote and click next.

In Step 3, leave all field formats to “General” and click Finish. Optionally, you can select “Date” as data format for the first column and choose YMD (Year-Month-Day) as date type, but dates will be formatted correctly even if you leave the format to “General”.

Finally, select the sheet and range where you want the data to be imported. The selected cell represents the upper-right corner of the new table containing the CSV data. Click OK.

You should obtain the following result:

Import from Web pages
Another way to import data into Excel is to import data directly from a table displayed on a Web page. The main difference from importing data from Text File is that the source and format is quite different from a text file. In fact, in this case, we the source is expected to be an HTML table (with tag <table>). Any other tag will not be considered. So, this means that if your data is not contained inside a table, you cannot (easily) import the data into Excel.
For instance, let’s assume that we want to import some data contained in the following Web page:
http://finance.yahoo.com/q/hp?s=GOOGL
To do so, you need to use the “New Web Query” wizard, which will allow you import a Web table into Excel. To do so, open Excel and create a new Workbook. Then, click on the “Data” tab and select « From Web » in the “Get External Data” group. Copy the above URL in to “Address” text box and click on the “Go” button. If you want other stock data, you can type http://finance.yahoo.com/, look for a specific stock symbol and click on “Historical Prices” menu item.

Note that Excel is using a legacy browser to access Web pages and you might be prompt with the following error multiple times:

Simply ignore this kind of errors by clicking Yes (or No) each time this pop-up window appears.
When this is over, you can finally select the table of interest as follow and click “Import”.

Note that it is possible to select and thus import several tables at once. If you want, you can also modify the “Set Date Range” parameters to obtain specific historical data for the current stock. In the example above, we selected weekly stock values from the 1st of January to 14th of March 2017, which gives the following URL:
http://finance.yahoo.com/q/hp?s=GOOGL&a=00&b=1&c=2017&d=02&e=14&f=2017&g=w
Note here that the resulting URL parameters are then same as the Yahoo Finance API (as explained in the previous chapters).
Finally, choose the target range where you want the Web table to be imported and click “OK”.

You should obtain the following result:
Congratulation, you now know how to import external data to Excel!

Import data automatically using VBA
We are going to show you how to automatically import historical stock data directly using Yahoo Finance API, but without having to download the file locally before importing it (as shown in the previous chapter).
The problem here is that we want to read data from an URL that returns a text file instead of a HTML page. However, if you try to access the Yahoo Finance API (e.g. http://ichart.finance.yahoo.com/table.csv?s=GOOGL) using the “New Web Query” wizard from Excel, a pop-up window will ask you to manually download the file locally. And of course, you cannot access online data source using the “Text Import Wizard”.
Fortunately, it is possible to use this API from Excel. However, for this purpose, we first need to better understand how Excel is working and, more precisely, what VBA code is generated when we import external data into Excel.
First you need to have access to and know how to record a macro in Excel.
One of the best feature of Excel is that you can generate VBA code based on your actions performed in Excel. The Office Web site explain how you can generate a macro using Excel and how to display the “Developer” tab. Here we just gives a brief summary.
To generate a macro in Excel, click on the “Developer” tab and select “Record macro”.

Give a name to the macro you are going to generate and click OK (e.g. “LoadExternalData”).

Now, any action that you do in Excel will be recorded in this Macro (in a new module called Module1). And by “any action”, we mean that everything that you do will generate equivalent VBA code.
For instance, if now you click on cell B2 and write “Hello”, the following code will be generated:
Range(« B2 »).Select
ActiveCell.FormulaR1C1 = « Hello »
If later you decide to execute the macro again, all actions that you performed will be re-executed at once. Here, cell B2 will be selected and “Hello” will be written in B2.
As you might expect, Excel can do more than recording simple actions. In fact, Excel can also record more complex action such as importing external data. (Now you know where we am going!) The idea is to first start recording a macro and then import external data as shown in the previous chapter.
Hence, if you import the CSV file called table.csv from your computer, the following macro is generated:
Sub LoadExternalData()

    With ActiveSheet.QueryTables.Add(
            Connection:="TEXT C:Usersjulien.ribonDesktoptable.csv ", _
            Destination:=Range("$A$1"))
        .CommandType = 0
        .Name = "table_1"
        .FieldNames = True
        .RowNumbers = False
        .FillAdjacentFormulas = False
        .PreserveFormatting = True
        .RefreshOnFileOpen = False
        .RefreshStyle = xlInsertDeleteCells
        .SavePassword = False
        .SaveData = True
        .AdjustColumnWidth = True
        .RefreshPeriod = 0
        .TextFilePromptOnRefresh = False
        .TextFilePlatform = 850
        .TextFileStartRow = 1
        .TextFileParseType = xlDelimited
        .TextFileTextQualifier = xlTextQualifierDoubleQuote
        .TextFileConsecutiveDelimiter = False
        .TextFileTabDelimiter = False
        .TextFileSemicolonDelimiter = False
        .TextFileCommaDelimiter = True
        .TextFileSpaceDelimiter = False
        .TextFileColumnDataTypes = Array(1, 1, 1, 1, 1, 1, 1)
        .TextFileTrailingMinusNumbers = True
        .Refresh BackgroundQuery:=False
    End With

End Sub
Note that if you are using Mac OSX, Excel will generate the following code, with the TextFilePlatform property set to xlMacintosh:
Sub LoadExternalData()

    With ActiveSheet.QueryTables.Add(
            Connection:="TEXT;Macintosh HD:Users:julien:Desktop:table.csv", _
            Destination:=Range("A1"))
        .Name = "table"
        .FieldNames = True
        .RowNumbers = False
        .FillAdjacentFormulas = False
        .RefreshOnFileOpen = False
        .BackgroundQuery = True
        .RefreshStyle = xlInsertDeleteCells
        .SavePassword = False
        .SaveData = True
        .AdjustColumnWidth = True
        .TextFilePromptOnRefresh = False
        .TextFilePlatform = xlMacintosh
        .TextFileStartRow = 1
        .TextFileParseType = xlDelimited
        .TextFileTextQualifier = xlTextQualifierDoubleQuote
        .TextFileConsecutiveDelimiter = False
        .TextFileTabDelimiter = False
        .TextFileSemicolonDelimiter = False
        .TextFileCommaDelimiter = True
        .TextFileSpaceDelimiter = False
        .TextFileColumnDataTypes = Array(1, 1, 1, 1, 1, 1, 1)
        .Refresh BackgroundQuery:=False
        .UseListObject = False
    End With

End Sub
On the other hand, if you import data from a Web page, the following macro is generated instead:
Sub LoadExternalData()

    With ActiveSheet.QueryTables.Add(
            Connection:= "URL;http://finance.yahoo.com/q/hp?s=GOOGL", _
            Destination:=Range("$A$1"))
        .CommandType = 0
        .Name = "hp?s=GOOGL"
        .FieldNames = True
        .RowNumbers = False
        .FillAdjacentFormulas = False
        .PreserveFormatting = True
        .RefreshOnFileOpen = False
        .BackgroundQuery = True
        .RefreshStyle = xlInsertDeleteCells
        .SavePassword = False
        .SaveData = True
        .AdjustColumnWidth = True
        .RefreshPeriod = 0
        .WebSelectionType = xlSpecifiedTables
        .WebFormatting = xlWebFormattingNone
        .WebTables = "15"
        .WebPreFormattedTextToColumns = True
        .WebConsecutiveDelimitersAsOne = True
        .WebSingleBlockTextImport = False
        .WebDisableDateRecognition = False
        .WebDisableRedirections = False
        .Refresh BackgroundQuery:=False
    End With

End Sub
When you are done, finish recording by clicking on “Stop recording” in the “Developer” tab.

Note that if you try to re-execute either of these macros, you will get the following error:

To solve this problem, remove the following line and your Macro should work like a charm.
.CommandType = 0
Now, let’s compare these two macros to illustrate both their similarities and differences.
As you can see, both macro are using an essential object to import external data, namely the QueryTable object. You can think of this object as containing a Query that produces a Table once executed.
Here is the official definition: the QueryTable object “represents a worksheet table built from data returned from an external data source, such as an SQL server or a Microsoft Access database” (or in our case Web pages and text files).
To create and execute a QueryTable, you need to first provide three things:
- a Worksheet that holds the QueryTable (e.g. Sheet1),
- a destination cell (e.g. $A$1) that holds the received data, and
- a connection string that contains the type of data source and its location in form of a URL.
Depending on the method chosen to import data, that connection string can be quite different. In our case, we have the following connections.
- From Text: « TEXT; C:Usersjulien.ribonDesktoptable.csv »
- From Web: « URL;http://finance.yahoo.com/q/hp?s=GOOGL »
The rest of the Macro is actually composed of parameters that configures the QueryTable object to obtain the appropriate behavior. There are two groups of parameters: general parameters shared by both Macros and specific parameters that are related to the data source (i.e. Web vs. Text).
We are not going to explain every parameters here (you can read the official documentation to this purpose), but only the most important ones.
General parameters shared by both macros:
.Name = "table"
.FieldNames = True
.RowNumbers = False
.FillAdjacentFormulas = False
.PreserveFormatting = True
.RefreshOnFileOpen = False
.RefreshStyle = xlInsertDeleteCells
.SavePassword = False
.SaveData = True
.AdjustColumnWidth = True
.RefreshPeriod = 0
...
.Refresh BackgroundQuery:=False
RefreshStyle property tells how the data should be written into the given Excel sheet. Should the new table override exiting data or should it be inserted? xlInsertDeleteCells tells Excel in shift existing column to the right before importing new data. Instead, you should use xlOverwriteCells in order to override cells containing data.
Refresh is not a property but a method: it execute the query and start importing the data in your Excel sheet. If you omit this line, nothing will happen. Additionally, this method can take an optional parameter called BackgroundQuery. This tells Excel if the query should execute synchronously or asynchronously. Meaning that the user either have to wait for data to arrive (BackgroundQuery:=False) or if it can continue to work without the data (BackgroundQuery:=True).
Specific parameters for Text files:
.TextFilePromptOnRefresh = False
.TextFilePlatform = 850
.TextFileStartRow = 1
.TextFileParseType = xlDelimited
.TextFileTextQualifier = xlTextQualifierDoubleQuote
.TextFileConsecutiveDelimiter = False
.TextFileTabDelimiter = False
.TextFileSemicolonDelimiter = False
.TextFileCommaDelimiter = True
.TextFileSpaceDelimiter = False
.TextFileColumnDataTypes = Array(1, 1, 1, 1, 1, 1, 1)
.TextFileTrailingMinusNumbers = True
These parameters all start with “TextFile” and represent the different option that you can choose in the “Text File Wizard” (as explained above).
TextFileParseType indicates whether the fields in your text files are delimited by specific characters such as commas or tabs (xlDelimited), or if columns are delimited by specific width (xlFixedWidth). In our case, the CSV file is delimited by characters.
TextFileCommaDelimiter indicates that the CSV file is (or not) delimited by commas.
TextFileTextQualifier designates the type of text qualifier, i.e. the character that indicates the starting and ending point of a text. In our case, we let the default value (xlTextQualifierDoubleQuote), i.e. double quote (« ).
Specific parameters for Web pages:
.WebSelectionType = xlSpecifiedTables
.WebFormatting = xlWebFormattingNone
.WebTables = "15"
.WebPreFormattedTextToColumns = True
.WebConsecutiveDelimitersAsOne = True
.WebSingleBlockTextImport = False
.WebDisableDateRecognition = False
.WebDisableRedirections = False
These parameters are not important for the remaining of our task. However, the WebTables property is an essential parameter to import data from Web pages, as it indicates which tables that appear on the Web page should be imported. In this case, table number 15 is imported, but it is possible to import more than one table at once. For example, writing « 6,9,13,15 » will import the 6th , 9th 13th and 15th table displayed on the Web page.
The key idea is then to set up a QueryTable objet for a text file (as this corresponds to the returned data), while uing the address of the Yahoo Finance API in the connection string. The resulting connection string is therefore as follow:
« TEXT; http://ichart.finance.yahoo.com/table.csv?s=GOOGL »
And these are parameters (with their values) that should be used to configure and correctly import the data from the received CSV file:
| Property | Value | Description |
| RefreshStyle | xlOverwriteCells | Replace cell values |
| BackgroundQuery | False | Synchronous query (wait for response) |
| TextFileParseType | xlDelimited | Separate columns with a character |
| TextFileTextQualifier | xlTextQualifierDoubleQuote | Value Delimiter = double-quote (”) |
| TextFileCommaDelimiter | True | Column Separator = comma (,) |
Now, using the above connection string and parameters, we can build a macro that is able to automatically download historical data from Yahoo Finance:
Sub LoadExternalData()
    Dim url As String
    url = "TEXT;http://ichart.finance.yahoo.com/table.csv?s=GOOGL"

    With ActiveSheet.QueryTables.Add(url, Range("$A$1"))
        .RefreshStyle = xlOverwriteCells
        .BackgroundQuery = False
        .TextFileParseType = xlDelimited
        .TextFileTextQualifier = xlTextQualifierDoubleQuote
        .TextFileCommaDelimiter = True
        .Refresh ' run query and download data
    End With
End Sub
Not only is this solution elegant, it is also very efficient! In fact, we do not need to parse or format the using a (slow) loop, as this is directly done by the QueryTable object.
Voilà! You have successfully imported external data from one of Yahoo Finance APIs using Excel and VBA.
Now, the last step is to provide a dashboard in Excel so that users can directly interact with Yahoo Finance, without having to work with VBA.
Dashboard and user inputs
In this last chapter we are going to build an interface in Excel so that users can directly interact with the worksheet without having to modify VBA macros. We are therefore going to:
- read user input from specific Excel cells,
- transform these inputs into values in order to build a correct URL for Yahoo Finance,
- download the appropriate historical data based on the URL.
First, let’s build a simple interface. Start by defining cells that will holds user inputs and cells that will holds the downloaded data. This can, for example, look like the following worksheet:

Base on the above worksheet, we can define the following cells:
- Cell B2 contains the stock symbol (or ticker),
- Cell B3 contains the starting date,
- Cell B4 contains the ending date,
- Cell B5 contains the frequency, and
- Cell D1 will hold the external data.
Warning: you should NOT create or insert any table in columns D to J, because this will prevent the creation of QueryTable as we will see in the next section.
Now, it is important to properly define user inputs in order to avoid errors. To this extent, we can use “Data Validation” to limit the values that the user can enter. Select cell B2, Click on the “Data” tab and select “Data Validation” in the “Data Tools” group.

Now, select “List” under “Allow”, as we want to provide a whole list of stock symbols. Uncheck “Ignore blank” as the symbol is mandatory.

Under “Source”, you should select a list of existing symbols: the simplest approach is to store an exhaustive list of symbols in another worksheet. This list can be downloaded here.

For both B3 and B4, you should define a “Data Validation” that correspond to a date, where date in B3 (starting date) cannot be higher than B4 (ending date).
This is the data validation for B3:

And this is the data validation for B4:

Finally, you should also limit the number of values that users can enter in cell B5 (Frequency), where cell can only be one of the following value: Daily (d), Weekly (w), Monthly (m), and Dividend Only (v).
Again, this can be done using a data validation based on a list:

Finally, you can create a button called “Load” that will allow users to execute your macros and download the data from Yahoo Finance: on the “Developer” tab, click on “Insert” and then select the “Button” under “Form Controls”.

Now, this is how your dashboard should look like:

The Dashboard is now ready! We just need to implement the macro that will read and transform user inputs.
Reading and transforming user inputs
Write a Macro Sheet that read user inputs (StockSymbol, Start Date, End Date and Frequency) and format them so that they will be compatible with the URL of Yahoo Finance.
First, if are using data validation with a correct list of stock symbol, then there is nothing to be done for cell B2 (as the symbol can directly passed as such in the URL).
Now for dates, this is another story. In fact, you should split dates into three parts, namely day, month, and year, because each date is represented by three URL parameters. To extract each part, you can use the VBA functions called Day, Month, and Year, respectively. This is an example that illustrate how to extract these values out of the starting date:
Dim startDate As Date
Dim startDay As Integer , startMonth As Integer, startYear As Integer

startDate = Range("B3").Value
startDay = Day(startDate)
startMonth = Month(startDate) - 1
startYear = Year(startDate)
Warning: since URL parameters for months accept value between 0 and 11, you have to subtract 1 from the extracted month.
Finally, frequency should be mapped from the given values (e.g. “Daily”) to the appropriate symbol (e.g. “d”). This can easily be done using a condition, as follow:
Dim frequency As String
frequency = Range("B5").Value

Select Case frequency
Case "Daily"
    frequency = "d"
Case "Weekly"
    frequency = "w"
Case "Monthly"
    frequency = "m"
Case "Dividends Only"
    frequency = "v"
Case Else
    frequency = "" ' unknown frequency
End Select
Of course, you might want to directly use symbols d, w, m and v as list values in data validation so that you do not need to map values using VBA as explained above.
Note also that you might want to test if user inputs are empty, as only the stock symbol in mandatory for Yahoo Finance API.
Building the URL:
Now, it is time to build the URL for the QueryTable objet. The following macro builds and concatenates the different part of the URL string for Yahoo Finance:
Dim url As String
url = "http://ichart.finance.yahoo.com/table.csv"

' Add to the URL parameters based on the extracted values.
url = url & "?s=" & stockSymbol
url = url & "&a=" & startMonth
url = url & "&b=" & startDay
url = url & "&c=" & startYear
url = url & "&d=" & endMonth
url = url & "&e=" & endDay
url = url & "&f=" & endYear
url = url & "&g=" & frequency
Now, you just have to pass the resulting URL variable into the QueryTable Object as follow.
ActiveSheet.QueryTables.Add(url, Range("$A$1"))
Note that you might want to change the destination sheet and range according to your need.
Finally, depending on size of external data, i.e. the number of rows in the table, you prbably want to completely clear the range containing data before importing new data. This can easily be done with the following code (assuming that cell A1 is contained inside the data table):
Range("A1").CurrentRegion.ClearContents
This removes the whole table (but keeps the format) and thus avoids old data from the previous import to still be present in the worksheet.
Conclusion
Voilà! This concludes this article about importing Yahoo’s historical stock data using Excel and VBA. If you click on the “Load” button of the dashboard, you should obtain the following result:

You can find the whole code source of this tutorial on GitHub, or you can download the following Excel file that contains the VBA code together with the Dashboard and a list of stock symbols: yahoo-hist-stock.xlsm.
Please, feel free to write any comment about this article. We are looking forward to your feedback.
References
- QueryTable documentation
- Use Yahoo Finance as data source
- A List of All Yahoo Finance Stock Tickers
- Yahoo Finance – Historical Data (Web)
- Yahoo Finance – Historical Data (API)
- Google Code – Yahoo Finance Managed
There are a few different ways you can pull stock prices into Excel. You can use the new STOCKHISTORY function, pull data from Google Sheets which has a native stock function, or you can also use Power Query. In this post, Power Query is what I am going to focus on and show you how you can pull data right from Yahoo Finance. Of course, if you don’t want to do it yourself, I also have a template that is ready to use and download (at the bottom of the page).
Creating the query
For this example, let’s pull Apple’s stock history for the past month. To do this, we can simply go to the Yahoo Finance page that shows the stock’s recent price history, located here and select any interval, whether it is five days, one month, or three, it doesn’t matter.
To get the complete data set, I’m going to copy the actual CSV download link from that page, not simply the URL. That way, it is possible to pull a much wider range than the default of 100 days.
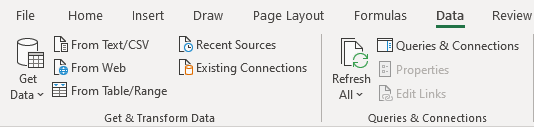
I’m going to use that link to set up the query. To create it, go into the Data tab, select the From Web button next to Get Data:
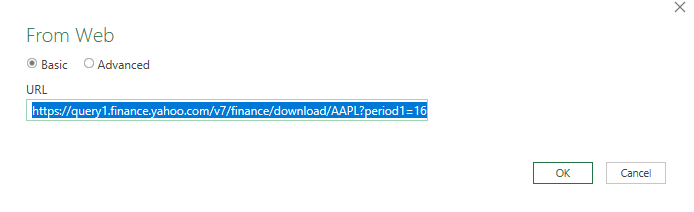
On the next page, you’ll be given a place to enter a URL, and this is where I am going to enter the download link from Yahoo Finance:
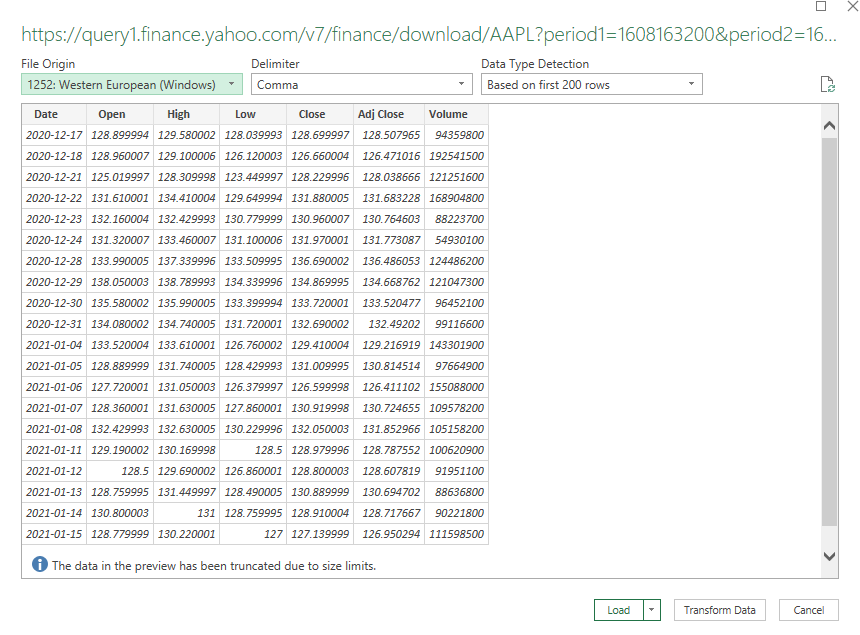
Click on OK and Power Query will connect to the web page. Next, you will see a preview of the data and if it looks okay, you can just click on the Load button:
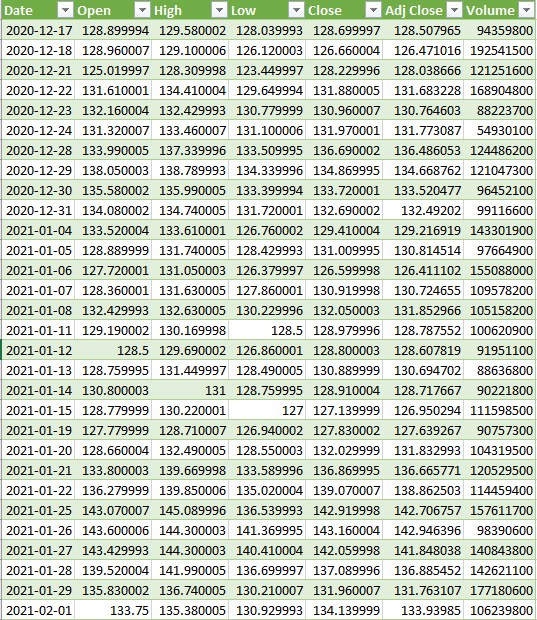
Then, the data will load into your spreadsheet and it should look something like this:
If that’s all you need, you can stop here. The only downside is if you wanted to look at a different ticker or change the date range, you would need to get a new link, and update the query manually, which is not ideal at all. This can be automated and takes a little more effort but it can be done by adding some variables and making some tweaks to the query.
Setting up the variables
In Power Query, you can utilize named ranges. In this case, I’ll set them up for the ticker symbol, as well as the start and end dates. That way, I can pull up a stock’s history for a specific time frame. The three named ranges I’m going to create are called Ticker, StartDate, and EndDate which can be entered all in the same place:

For the dates to work on Yahoo Finance, they need to be converted to a timestamp. This is what that calculation looks like:
=(A1-DATE(1970,1,1))*60*60*24
Where A1 is the date. This is what the dates look like when converted into this format:
Those timestamps are needed for the Yahoo Finance URL to populate properly. These are the values that need to be tied to a named range.
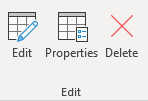
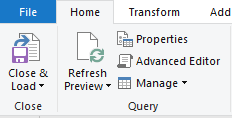
Next, these ranges need to be coded into Power Query. To do this, click anywhere on the table that the query created, and you should now see a section for Query in the Ribbon and click on the Edit button:
That will launch the editor. From there, you will want to click on the Advanced Editor button:
Then, you’ll see how the query is coded:
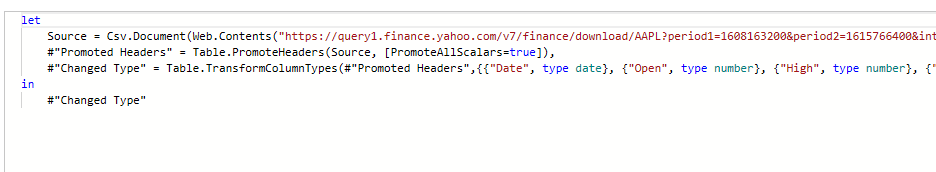
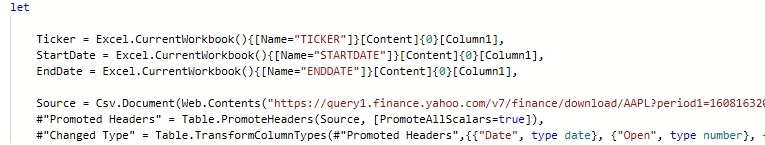
You can see the source variable is where the URL goes. To insert a named range from the Excel document into this code, we need to use the following format:
VariableName = Excel.CurrentWorkbook(){[Name=”namedrange“]}[Content]{0}[Column1]
Creating the ticker variable will look as follows:
Ticker = Excel.CurrentWorkbook(){[Name=”TICKER”]}[Content]{0}[Column1]
To keep things simple, I kept the name of the variable the same as the named range within the Excel file. Here is what the editor looks like after adding in the variables for the ticker, start date, and end date:
The one thing that I still need to adjust is the source. This is a hardcoded URL and it needs to be more dynamic, utilizing the variables.
In this part, I’ll need to adjust the query carefully to ensure that it is generated correctly. I will put the ticker variable where the ticker should go, and put the start and end dates (in Unix format). This is an excerpt of how the updated source data looks like:
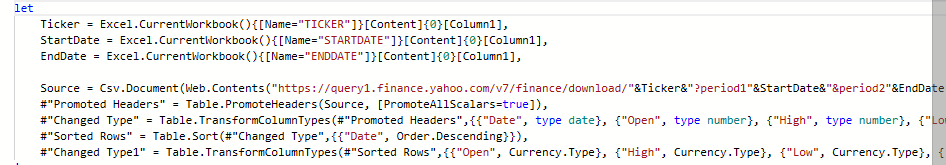
Note that for the start and end date named ranges, I included the = sign to ensure the variable is read as text.
Now that the source is changed, all you need to do is update the variables and click on the Refresh All button on the data tab, and the table will update based on what you have entered.

If you want to download my template, you can do so here.
If you liked this post on how to get stock quotes from Yahoo Finance using Power Query, please give this site a like on Facebook and also be sure to check out some of the many templates that we have available for download. You can also follow us on Twitter and YouTube.