
Tableau users often come across scenarios where they need to export data from Tableau into Excel.
Tableau allows users to choose between exporting the filtered data underlying a visualization or the whole dataset from a data source. Tableau also provides the flexibility to export the data to Excel in multiple formats.
In this blog post, we’ll cover 5 quick ways to export data from a Tableau view onto Excel.
Exporting the data underlying your Visual
A Visual can be exported to Excel in the following ways:
- Crosstab
- Data
- Image
If you have several visuals on your dashboard, first select the visual you would like to export, then follow one of the options below.
📌 [Tableau Hacks] Saving Dashboard Space With Hidden Containers >>
1. Export the visualization as a Crosstab
There are two methods to export as a crosstab:
a. Use the Menu Option Worksheet, Export and Crosstab to Excel.
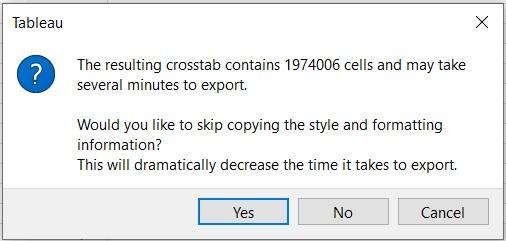
If there is a significant amount of data to export this can take a long time to export as Tableau applies formatting to this exported data.
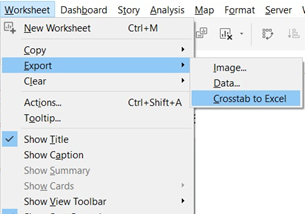
You may be prompted with a warning message and be given the option to export without formatting. This can reduce the amount of time it takes to export.
b. Alternatively use the Menu Option Worksheet, Copy and Crosstab. Then open Excel and paste the crosstab.
This second method is a much faster way to export crosstab data to Excel. However, numbers are converted to text fields so these will need to be converted back to numeric values before further analysis can be undertaken in Excel.
📌 Supercharge OBIEE With Tableau [eBook] >>
In addition, if you export numeric fields, the formatting applied in the visual is applied in your pasted data. For example, if decimal places are not visible in the visual then the numeric figures will be rounded to zero decimal places in your pasted excel copy of the data.
2. Export the visualization as data
a. Use the Menu Option Worksheet, Copy and Data. Then open Excel and paste the data.
When you export data or a crosstab from Tableau to Excel, only the filtered data within the visual is exported (i.e. only the data included in the Columns, Rows and Colors shelves will be included in the data or crosstab). Any filters on the filters shelf will need to be added to the Tooltips on the Marks Card for the information relevant to the filter to be visible in the data or crosstab.
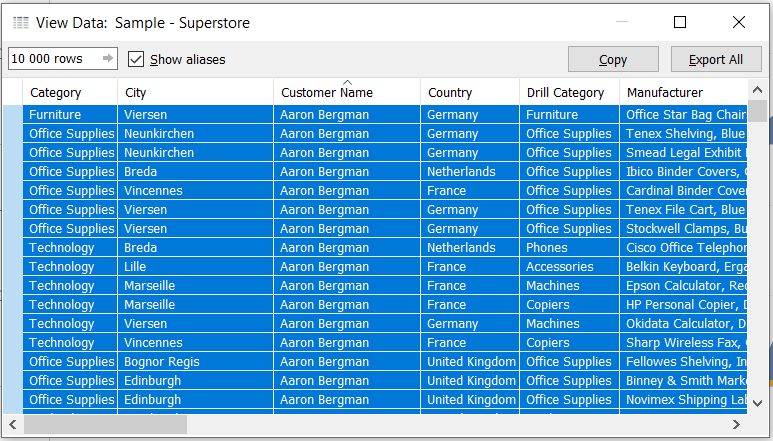
b. You can also export the filtered data by right clicking on the visual and selecting View Data. The summary view will contain the same data as that accessed using WorksheetCopy and Data.
Within this data pane you can use the Full Data tab selection on the bottom to get the full view of the data underlying the visual. In order to select this full version of the data, click just to the left of the top header. The selected data will be highlighted in blue.
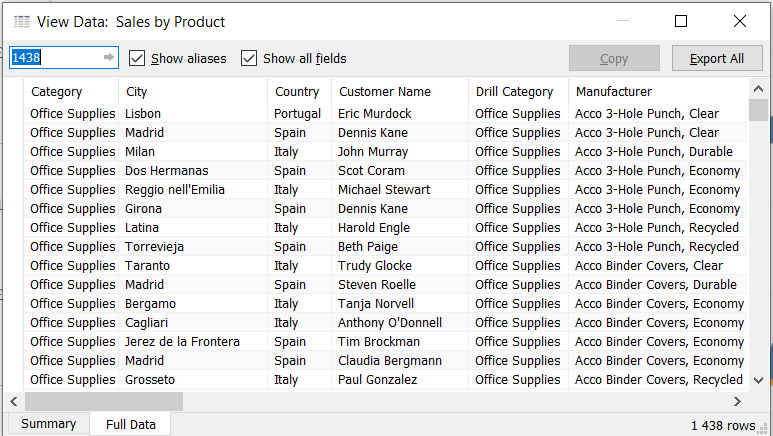
Use the copy button to copy to the clipboard and then paste in Excel.
📌 5 Must-haves of Tableau OBIEE Connectors [Infographic] >>
3. Export the visualization as an image
You may also want to export an image from Tableau, and this can be done as follows:
Use the Menu Option Worksheet, Copy and Image. Select the layout to apply to your image. You have the option of showing or hiding the Title, View, Caption and Legend. There’s also an option to have legends displayed to the right or bottom of the image.

Then open Excel and paste the image.
With this we have seen 3 ways to export the underlying data to Excel from a Tableau visualization.
Now let’s take a look at the two more ways with which the whole dataset of a data source can be exported to Excel.
📌 Tableau Row Level Security (RLS) Setup – Simplified Guide >>
Export the Data from the Underlying Data Source
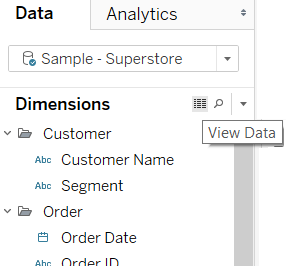
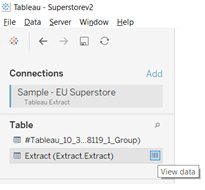
An unfiltered view of the data can be extracted from the underlying data source either through the Dimensions pane or from the Data Source View.
Select the View Data icon in the Dimensions pane. A data pane will popup with the data underlying the data source.
You can use this data pane to change the order of your columns by dragging and dropping the columns. You can also change the number of rows displayed in the rows box at the top.
📌 [Tableau Hacks] How to Improve Interactiveness With Parameter Actions? >>
Once you have finalized your view, select all the rows by right-clicking on the top left of the header. The selected rows will get highlighted in blue. Use the copy button to copy to the clipboard and then paste in Excel.
Navigate to the data source and select the View Data icon for the data source from which you want to extract the data.
This will bring up the View Data pane.
As in the previous example use the data pane to finalize the order of columns and number of rows you would like to export. Select the rows and use the copy button to copy to the clipboard. Then paste it in Excel.
Now that we’ve seen 5 ways to export data from Tableau view to Spreadsheets, you may also look for ways to export several visuals within your report to Excel in one shot.
Let’s also take a brief look at how to use the Export All Extension for Tableau Server.
Export All Extension for Tableau Server
If you have several visuals within your report that need to be saved to Excel, Tableau Server has an extension that makes this process simpler.
Once you have installed the Tableau extension the export option is activated by placing a button on your dashboard. This button will allow you to select and export multiple sheets with a single click into an Excel workbook.
📌 Tableau Certified Connector for OBIEE, OAC & OAS – Try it Now >>
The extension can be found in the extensions gallery at the following link https://extensiongallery.tableau.com/products/25
Hopefully, this feature will soon be made available on the Tableau desktop as well!
Try BI Connector free trial.
Use with Power BI, Qlik, Tableau Desktop edition.
Tableau is a powerful data visualization tool. It combines various components like labels and colors to present data visually. This makes it easy for anyone to extract insights from the data, even non-analysts.
You can use Tableau to join tables from one or more connections and make generalizations like creating calculated fields, groups, pivot fields, extract filters, etc. After that, you may need to reuse the data in the new form or even share it. This means that you’ll have to export the data. In this article, you will learn about the procedure for Exporting Tableau to Excel and the limitations of the procedure.
Table of Contents
- Introduction to Tableau
- Procedures for Exporting Data from Tableau to Excel
- Exporting Tableau to Excel Part 1: Export Crosstab of Data
- Exporting Tableau to Excel Part 2: Copy the Data to Clipboard
- Exporting Tableau to Excel Part 3: Copy the Crosstab of Data to Clipboard
- Exporting Tableau to Excel Part 4: Exporting Visualizations as Images
- Exporting Tableau to Excel Part 5: Extracting Data using Dimensions Pane
- Limitations of the Procedure
- Conclusion
Introduction to Tableau
Tableau is a tool that is used for applications related to Business Intelligence and Data Visualization. This can help you get important insights by analyzing the data and provide objective measurements to support and help in strategic decision-making in a business organization.
The platform supports an easy-to-learn user interface and additional functionalities to collaborate with other employees in the organization. The user can get data from multiple sources and perform analyses on the aggregated data. Tableau is helping industries to reduce the analysis time and provides functionalities while ensuring flexibility, security, and reliability.
Official documentation about Tableau can be found here.
Procedures for Exporting Data from Tableau to Excel
Below are the 5 procedures that you are required to carry out to export data from Tableau to Excel
- Exporting Tableau to Excel Part 1: Export Crosstab of Data
- Exporting Tableau to Excel Part 2: Copy the Data to Clipboard
- Exporting Tableau to Excel Part 3: Copy the Crosstab of Data to Clipboard
- Exporting Tableau to Excel Part 4: Exporting Visualizations as Images
- Exporting Tableau to Excel Part 5: Extracting Data using Dimensions Pane
Exporting Tableau to Excel Part 1: Export Crosstab of Data
This is one of the ways of exporting Tableau data into Excel. You can export the data used to generate a visualization in Tableau into Excel in the crosstab format. Once you export the view as a crosstab, the Excel application will be automatically opened and a crosstab version of the view will be pasted into an Excel workbook.
This method provides Tableau users with an easier way to export Tableau data to other applications, but the performance of the export may be affected since copying and formatting of the data is done simultaneously. If the view to be exported has a lot of data, a dialog box asking you whether to export the formatting will be opened. If you decide to exclude exporting the formatting, you may get improved performance.
If you’ve added many visuals to your dashboard, select the visual that is to be exported.
On Tableau Desktop, follow the steps given below:
Step 1: Select “Worksheet”.
Step 2: Choose “Export”, and then “Crosstab to Excel”. For Mac users, this will open a dialog box where the file can be saved. You should then open the file manually in Excel.
On Tableau Online or Tableau Server, follow the steps given below:
Step 1: Open the dashboard or view and select “Download”.
Step 2: Choose “Crosstab”. Select sheets from the workbook from where you need to export the data.
Exporting Tableau to Excel Part 2: Copy the Data to Clipboard
You can still copy the data that was used to generate the visualization into clipboard.
You can then paste the data into an application of choice such as Excel. The following steps demonstrate this:
Step 1: Create the view.
Step 2: Select “Worksheet”, -> “Copy”, -> “Data”.
Step 3: Open your Excel application, then paste the data into it.
Note that when copying the data, any field which is an external filter will not be copied.
Hevo Data, a No-code Data Pipeline helps to transfer data from 100+ sources to a Data Warehouse/Destination of your choice and visualize it in your desired BI tool such as Tableau. Hevo is fully managed and completely automates the process of not only loading data from your desired source but also enriching the data and transforming it into an analysis-ready form without having to write a single line of code. Its fault-tolerant architecture ensures that the data is handled in a secure, consistent manner with zero data loss.
It provides a consistent & reliable solution to manage data in real-time and always have analysis-ready data in your desired destination. It allows you to focus on key business needs and perform insightful analysis using a BI tool of your choice.
GET STARTED WITH HEVO FOR FREE
Check out what makes Hevo amazing:
- Secure: Hevo has a fault-tolerant architecture that ensures that the data is handled in a secure, consistent manner with zero data loss.
- Schema Management: Hevo takes away the tedious task of schema management & automatically detects the schema of incoming data and maps it to the destination schema.
- Minimal Learning: Hevo, with its simple and interactive UI, is extremely simple for new customers to work on and perform operations.
- Hevo Is Built To Scale: As the number of sources and the volume of your data grows, Hevo scales horizontally, handling millions of records per minute with very little latency.
- Incremental Data Load: Hevo allows the transfer of data that has been modified in real-time. This ensures efficient utilization of bandwidth on both ends.
- Live Support: The Hevo team is available round the clock to extend exceptional support to its customers through chat, email, and support calls.
- Live Monitoring: Hevo allows you to monitor the data flow and check where your data is at a particular point in time.
Simplify your data analysis with Hevo today!
SIGN UP HERE FOR A 14-DAY FREE TRIAL!
Exporting Tableau to Excel Part 3: Copy the Crosstab of Data to Clipboard
It’s possible to copy the crosstab version of the view to transfer or paste the data into Excel. The pasted data will always appear as a crosstab, even in cases where the initial view didn’t use the crosstab format.
However, when copying a crosstab, you are restricted by the following conditions:
- All records in the view must be copied. You’re not allowed to copy only a subset of the records.
- This option is only valid for aggregate views. You can’t apply it on disaggregated data views since a crosstab is an aggregated view of data. This means that you must select the “Aggregate Measures” option from the Analysis menu so that the process of copying the crosstab may work correctly.
- A crosstab cannot be copied if the view contains continuous dimensions like continuous times and dates.
- Other restrictions may be applied based on the view data.
After making sure that you meet the above conditions, follow the steps given below to copy the crosstab:
Step 1: Create the view.
Step 2: Select “Worksheet” -> “Copy” -> “Crosstab”.
Step 3: Open your Excel application and paste the crosstab there.
Exporting Tableau to Excel Part 4: Exporting Visualizations as Images
Tableau also allows you to export images. Simply follow the following steps:
Step 1: Select “WorkSheet” -> “Copy” -> “Image” from the Menu option.
Step 2: Choose the layout that you need to apply to the image. You can hide or show the Title, Caption, or the Legend of the image. You can also choose to have the legends displayed at the bottom or to the right of the image.
Step 3: Open Excel and paste the image there.
Exporting Tableau to Excel Part 5: Extracting Data using Dimensions Pane
Follow the steps given below:
Step 1: Click the “View Data” icon from the Dimensions pane. This will open a data pane that shows the data contained in the data source.
You can use the data pane to modify how the columns are ordered by dragging and dropping the data columns. You can also modify the number of rows shown from the rows box shown at the top.
Step 2: After finalizing the view, right-click the top left of the header to select the rows.
Step 3: Click the “Copy” button to copy the data to the clipboard. Paste into Excel.
Limitations of the Procedure
The following are the limitations of exporting data from Tableau into Excel:
- The process of exporting data from Tableau into Excel is lengthy and complex. It requires an individual with expertise in using Tableau.
- It’s not possible to export real-time data from Tableau into Excel.
Conclusion
In this article, you will learn about the procedure for Exporting Tableau to Excel and the limitations of the procedure.
Integrating and analyzing data from a huge set of diverse sources can be challenging, this is where Hevo comes into the picture. Hevo Data, a No-code Data Pipeline helps you transfer data from a source of your choice in a fully automated and secure manner without having to write the code repeatedly. Hevo with its strong integration with 100+ sources & BI tools, allows you to not only export & load Data but also transform & enrich your Data & make it analysis-ready in a jiffy.
VISIT OUR WEBSITE TO EXPLORE HEVO
Get started with Hevo today!
SIGN UP and experience the feature-rich Hevo suite first hand. You can also have a look at the unbeatable pricing that will help you choose the right plan for your business needs.
Introduction to Tableau Export to Excel
The following article provides an outline for Tableau Export to Excel. Tableau users can select to export either the entire dataset from a data source or just the filtered data that supports a visualization. Tableau also gives users the option to transfer data in a variety of forms to Excel. For example, to use in presentations and documents, we could export information from a workbook or an image that represents a view.

Overview of Tableau Export to Excel
Data can be obtained from several sources, and the client can then analyze the combined data. Therefore, it is essential to examine the data and offer impartial analyses to assist and support strategic decision-making in a company organization. Tableau makes computations and joins tables from one or more connections to export data.
Creating a Tableau capability extension enables you to quickly configure, alter, and export your data to Excel files.
Our Tableau XLS Extension allows you to:
- First, create a custom export format.
- Next, choose the information you want to export.
- Then, insert chart graphics into the Excel file that is exported.
In the export template, enable custom colors and business branding. The export efficiency may be affected since this option offers a direct means for sending the data to another program while also copying and formatting the data. A dialogue box asking if we want to export the formatting opens if the view we are exporting has a lot of data. In this situation, export performance might be enhanced if we leave the design out of the export.
Tableau Export to Excel Data
Follow these procedures to export data from Tableau to Excel:
- First, choose the view you wish to export from Tableau.
- Export > Crosstab can be found by clicking the File menu.
- Click Save after deciding where to save the file.
- The.csv file should be opened in Excel and saved as an.xlsx file.
This is one method to import data from Tableau into Excel. The data used to create a visualization in Tableau can be exported into Excel in crosstab type. The Excel program will launch automatically after users export the vision as a crosstab, and a crosstab version of the view will be copied into an Excel workbook.
Tableau users now have a more straightforward way to export Tableau data to other programs; however, since duplicating and structuring the data are done simultaneously, the export’s efficiency may suffer. A dialogue box requesting whether it should transfer the formatting will be presented if the view that needs to be exported contains a lot of data.
As an Excel file, save. Comma-separated values (CSV) files, which do not enable advanced Excel features like formatting, charts, or pivot tables, are the default format in which the data is downloaded. To prevent losing modifications, you should save it as an Excel file.
- Excel’s top menu will change to the File tab.
- Choose Save As.
- Remove the “.csv” from the filename and choose a folder. Then, select “Excel Workbook (*.xlsx)” from the filename drop-down menu.
- Press Save. Two copies of the data, one in CSV format and the other in Excel, should now be available. The CSV file may be eliminated.
Step 1: Let’s import some data as an example.
Microsoft Excel, for instance, provides the file location by selecting data> Excel.
C:/documents/superstore.xls
The following data will be imported from an excel file (see the preview).
Three sheets are listed in the left-hand column; if we pick one of them, Tableau will display a preview of that sheet (bottom). Here, we can also add filters to track data. We can see that the Data source window is open in the bottom (left) corner.
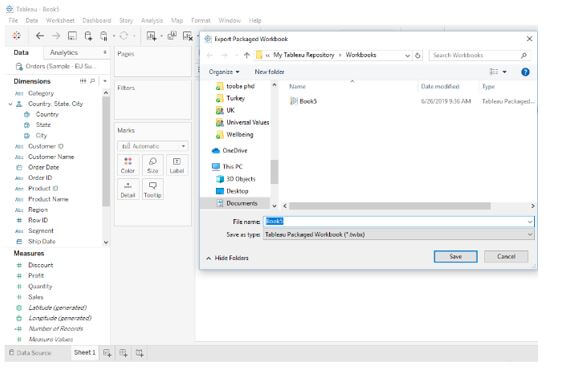
Tableau Export to Excel CSV File
To transfer the work from Tableau to another application and exchange the data, users can export from Tableau. The data from the Tableau information source can be sent forth. One of the most accessible structured formats for knowledge is the CSV format. A wide range of tools, databases, and computer languages support it. Using our experiences, we can demonstrate how to export data from Tableau to Excel. It explains how and where to exchange the information displayed in a view while maintaining style. Additionally, it describes the exporting of data from the Tableau Server.
In Tableau, two significant ways to export the data to an a.csv file are through the Data Source tab and the view. According to the Data Source page: To export all the content in the data source to an a.csv file, go to the Data Source panel and choose Data > Export Data to CSV.
From the view: Select the View Data icon in the Data pane, drag a field to the Rows or Columns shelf on the sheets tab, and then select the export All button.
The steps involved are given here:
1. Select Worksheet > Export > Data in Tableau Desktop.
2. Choose a location and give your Access database or.csv file a name.
3. Press Save.
4. Let’s now create a read to join a tableau process. Though if Tableau’s initial observation of the data didn’t hire a crosstab format, the pasted data still shows in that format.
Choose Worksheet > Copy > Information or Data.
Paste the data into the page in another program, such as Word.
By default, a crosstab is an aggregated view of the data. This means that for duplicating a crosstab to work correctly, the Aggregate Measure choice under the Research menu must be enabled.
Conclusion
As a result, in this Tableau Export, we saw the step-by-step process for exporting data from Excel and CSV files to Tableau. Compared to Tableau Data Extract, the Tableau Web Connector gives significantly more adaptability by enabling dynamic data refreshment inside Tableau. In Tableau, we can export data in a variety of methods. For example, information from the Tableau data source, including all or some of the records from the original data, can be exported. Alternatively, we can export the data necessary to create a particular view.
Recommended Articles
This is a guide to Tableau Export to Excel. Here we discuss the introduction and tableau export to excel data & excel CSV files. You may also have a look at the following articles to learn more –
- Tableau BI Tool
- Tableau Reporting
- Tableau Dashboard
- Tableau Gauge Chart

There are several ways you can export data in Tableau. You can export data in the Tableau data source i.e., including all or part of the records from the original data. Or you can export only portion of data used to generate a view.
Export data in the data source
After you establish your Tableau data source (i.e., after you join/union tables and make general customizations such as renaming fields, creating new calculated fields, pivoting fields, creating groups, applying data source or extract filters, etc.). You might want to share or reuse the data in its new form.

You can do that by exporting the data in the data source.
And there are three ways you can export data from the Tableau data source to a CSV file.
On the Data Source Page, select data menu >> Export Data to CSV >> ‘Select file or table to export.’

On the data pane (sheet level), click the view data Icon and click Export All button.

On the data pane, right-click on the data source >> Export Data to CSV >> ‘Select file or table to export’.

Export data used in the view.
After you create your view, you can also export data used to generate the view.
Note, when you export data used in the view, the fields that are exported are the ones added into the shelves of the worksheet. If you want to include other fields with the exported ones — without changing the baseline of the view – you can do that by placing those fields on the detail shelf.
There are two ways you can export data used in the view.
Export data in the view to Microsoft Access.
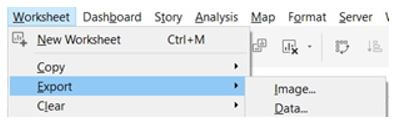
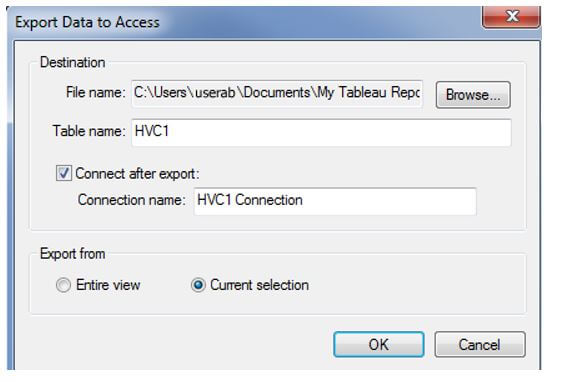
To export data used in the view to Microsoft Access, go to the Worksheet menu >> Export >> Data…

On the dialogue box, name your file and save it.

Export crosstab of data in the view to Microsoft Excel.
Go to Worksheet menu >> Export >> Crosstab to Excel.

When you export your view this way, Tableau automatically opens the excel application and pastes a crosstab version of the current view into the Excel workbook.
I hope this article was helpful to you. To receive more of the Tableau tips, kindly join our mailing list by subscribing below.
Thank you for reading.
Содержание
- From tableau to excel
- Tableau Desktop and Web Authoring Help
- Make the connection and set up the data source
- Microsoft Excel data source example
- Get more data
- Set Excel table options
- Use Data Interpreter to clean your data
- About .ttde and .hhyper files
- Changes to the way values are computed
- See also
- From tableau to excel
- Tableau Desktop and Web Authoring Help
- Export data in the data source
- Export your data to .csv file
- Extract your data
- Export the data source
- Export data used in the view
- Export data in the view to Microsoft Access or .csv
- Export crosstab of data in the view to Excel
- Copy data in the view to clipboard
- Copy crosstab of data in the view to clipboard
From tableau to excel
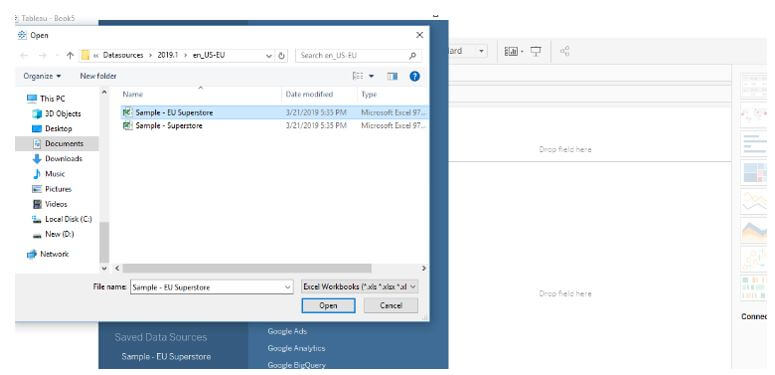
This article describes how to connect Tableau to Microsoft Excel file data and set up the data source. Tableau connects to .xls and .xlsx files.
To connect to a .csv file, use the Text file connector.
Make the connection and set up the data source
After you open Tableau, under Connect , click Excel .
Select the Excel workbook you want to connect to, and then click Open .
NOTE: Beginning with Tableau 2020.2, legacy Excel and Text connections are no longer supported. See the Legacy Connection Alternatives document in Tableau Community for alternatives to using the legacy connection.
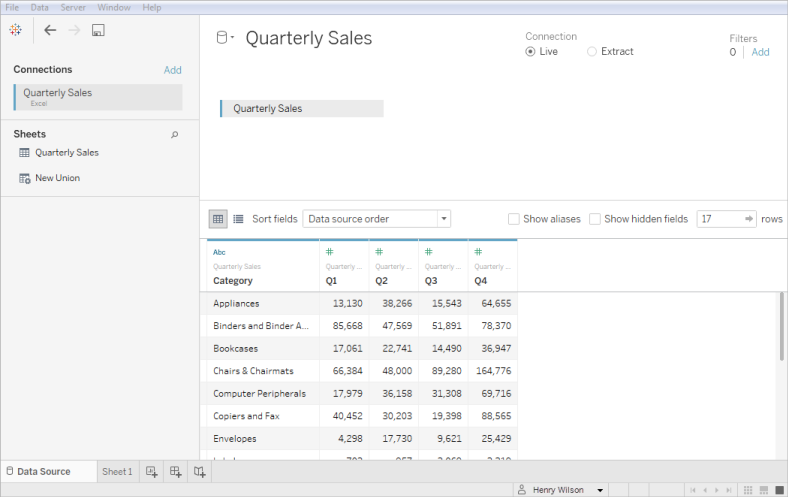
On the Data Source page, do the following:
(Optional) Select the default data source name at the top of the page, and then enter a unique data source name for use in Tableau. For example, use a data source naming convention that helps other users of the data source figure out which data source to connect to.
If your Excel file has one table, click the sheet tab to start your analysis.
Use custom SQL to connect to a specific query rather than the entire data source. For more information, see Connect to a Custom SQL Query.
You can also connect to a named range or an Excel table (also known as an Excel list) in the same way you connect to a worksheet. Both the named range and Excel table function as a table inВ Tableau.
You create named ranges in Excel by selecting a range of cells and then selecting Define Name on the Formulas tab. Similar to named ranges, you can create an Excel table in Excel by selecting a range of cells, and then selecting Insert > Table . When you connect to a named range or Excel table in Tableau, an icon appears next to the sheet in the Data Source page as shown below.

You can connect to multiple Excel workbooks at the same time as long as each connection in the data source has a unique name.
Note: Tableau does not support pivot tables in Excel.
Microsoft Excel data source example
The following is an example of a Microsoft Excel data source.
Note: If the Excel file contains columns that are more than 254 characters wide, Tableau Desktop can’t use these fields for workbooks that were created before Tableau Desktop 8.2. Also, you cannot use the legacy connection to connect to this data. Either remove the columns, modify them to fit within 254 characters prior to connecting in Tableau Desktop, or upgrade the Excel data source. For more information about upgrading data sources, see Upgrade Data Sources.
Get more data
Get more data into your data source by adding more tables or connecting to data in a different database.
Add more data from the current file:В From the left pane, drag additional tables to the canvas to combine data using a join or union. For more information, see Join Your Data or Union Your Data.
Add more data from different databases:В In the left pane, click Add next to Connections. For more information, see Join Your Data.
If a connector you want is not listed in the left pane, select Data > New Data Source to add a new data source. For more information, see Blend Your Data.
Set Excel table options
Excel table options are scoped to the connection. To change the table options, on the canvas, click the table drop-down arrow and then specify whether the data includes field names in the first row. If so, these names will become the field names in Tableau. If field names are not included, Tableau generates them automatically. You can rename the fields later.
Use Data Interpreter to clean your data
If Tableau detects that it can help optimize your data source for analysis, it prompts you to use Data Interpreter. Data Interpreter can detect sub-tables that you can use and remove unique formatting that might cause problems later on in your analysis. For more information, see Clean Data from Excel, CSV, PDF, and Google Sheets with Data Interpreter.
About .ttde and .hhyper files
You might notice .ttde or .hhyper files when navigating your computer’s directory. When you create a Tableau data source that connects to your data, Tableau creates a .ttde or .hhyper file. This file, also known as a shadow extract, is used to help improve the speed your data source loads in Tableau Desktop. Although a shadow extract contains underlying data and other information similar to the standard Tableau extract, a shadow extract is saved in a different format and can’t be used to recover your data.
Changes to the way values are computed
Starting from version 10.5, when you are working with extract data sources as well as data sources that use live connections to file-based data like Excel, the values in your data can be computed differently from previous versions of Tableau. This change means that you might see differences between the data and the marks in your view between version 10.4 (and earlier) and version 10.5 (and later). The purpose of this change is to improve the efficiency and scalability of your Excel data source. For more information, see Changes to values and marks in the view.
In the case of an Excel data source, one example of this change is with case sensitivity. In version 10.4 (and earlier), for comparing and sorting purposes, string values are treated as case insensitive and therefore treated the same and stored as a single string value. In version 10.5 (and later), for sorting and comparing purposes, values remain case insensitive. However, values are case sensitive for storing purposes. This becomes evident when values are displayed on the data source page.
For example, suppose you have a column in your data that contains the values «House,» «HOUSE,» and «houSe.»В You see the following string values depending on the version of Tableau you are using:
In version 10.4 and earlier, both on the data source page and view, you see:В «House,» «House,» and «House.»
In version 10.5 and later, on the data source page you see:В «House,» «HOUSE,» and «houSe.» But in the view you see: «House,» «House,» and «House.»
If you need to maintain case sensitivity for your data when performing a join, you can enable the Maintain Character Case (Excel) option from the Data menu. For more information about this option, see Join Your Data (Link opens in a new window) .
See also
- Set Up Data Sources – Add more data to this data source or prepare your data before you analyze it.
- Build Charts and Analyze Data – Begin your data analysis.
-
Data Prep with Text and Excel Files (Link opens in a new window) — Watch the Tableau video (registration or sign in required).
Источник
From tableau to excel
Tableau Desktop and Web Authoring Help
You can export the data in a Tableau data source, including all or part of the records from your original data. Alternatively, you can export only the portion of data used to generate the view.
Note: If you’re using Tableau Cloud or Tableau Server, instead see Download Views and Workbooks and Link to a PNG, PDF, or CSV of a View.
Export data in the data source
After you join tables from one or more connections and make general customizations (for example, create a calculated field, pivot fields, create groups, apply data source or extract filters, etc.) to your Tableau data source, you might want to share or reuse the data in its new form. You can do this by using one of the methods listed below.
Note: The export may exclude some table calculations and level of detail expressions.
Export your data to .csv file
Because the .csvВ format is one of the most simple structured formats for data, it’s supported by a wide range of tools, databases, and programming languages. Exporting your data in the Tableau data source using this format creates an independent data set and can be a convenient and flexible way to share your data with others.
There are two primary ways you can export your data in the data source to a .csv file in Tableau:В from the Data Source page and from the view.
From the Data Source page:В On the Data Source page, select Data > Export Data to CSV to export all the data in your data source to .csv file.
From the view: On the sheet tab, drag a field to the Columns or Rows shelf, click the View Data icon in the Data pane, and click the Export All button.

Another way to export all of your data or a subset of your data in the data source is to create an extract (.hyper) file. An extract functions as an independent data set, which you can use to connect directly from Tableau. For more information, see Extract Your Data.
Export the data source
After you connect to your data, you can export and save your data source as a Tableau data source (.tds) file. Saving the data source creates a shortcut to your remote data and allows you to avoid having to create a new connection to a specific data set each time. For more information, see Save Data Sources.
Export data used in the view
After you create a view, you can also export just the data used to generate that view.
The fields that are exported come from the fields on the shelves of the sheet. However, fields that function as external filters, in other words, the fields that appear only on the Filters shelf, are not included in the export. If you want to include other fields with the exported data without changing the baseline view, you can place those fields on the Detail shelf.
The various methods for exporting the data used to generate the view is listed below.
Export data in the view to Microsoft Access or .csv
Export the data that is used to generate the view as an Access database (Windows only) or .csv file (Mac only).
In Tableau Desktop, select Worksheet > Export > Data .
Select a location and type a name for your Access database or .csv file.
If you’re on Windows, the Export Data to Access dialog box displays to give you the option to immediately use the new Access database and continue working in Access without interrupting your work flow.
Export crosstab of data in the view to Excel
You can export directly to Excel the data used to generate the view formatted as a crosstab. When you export your view as a crosstab, Tableau automatically opens the Excel application and pastes a crosstab version of the current view into a new Excel workbook.
Although this option provides a direct method for exporting your data to another application, performance of the export can be affected because it is simultaneously copying and formatting the data. If the view you are exporting contains a lot of data, a dialog box opens asking whether you want to export the formatting. In this case, if you choose to exclude the formatting from the export, performance of the export might improve.
- In Tableau Desktop: select Worksheet > Export > Crosstab to Excel .
If you’re using a Mac, this option opens a dialog box where you can save the file. You must then manually open the file in Excel. - In Tableau Server or Tableau Cloud, open a view or dashboard and select Download > Crosstab .
Select which sheets from the workbook to export data from.
Copy data in the view to clipboard
Copy the data used to generate the view so that you can paste it into another application.
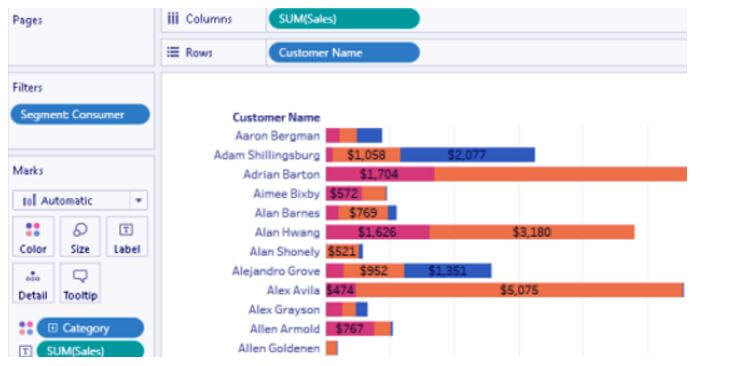
Select Worksheet > Copy > Data .
Open another application, such as Word, and paste the data into the document.
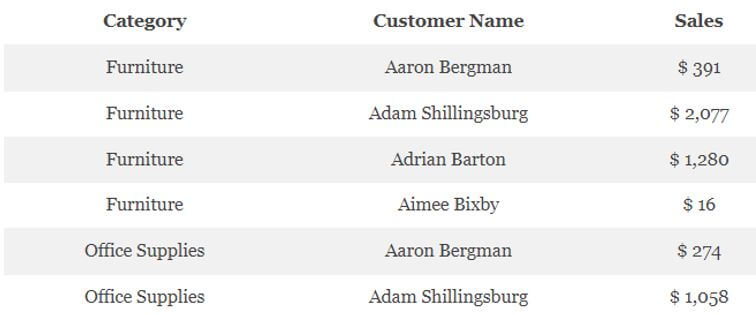
In this example, the fields placed on the Columns, Rows, and Color shelves are copied into the document. However, the Customer Segment field is not copied because it is an external filter because it appears only on the Filters shelf.
Copy crosstab of data in the view to clipboard
You can copy a crosstab version of a view so that you can paste or transfer the data into another application. The pasted data always appears as a crosstab, even if the initial view of the data in Tableau did not use a crosstab format.
Copying a crosstab is restricted by some general conditions:
You must copy all records in the view. You cannot copy a subset of records.
This option is valid for aggregated views only. It cannot be used on disaggregated views of data because a crosstab is by definition an aggregated view of data. This means the Aggregate Measures option on the Analysis menu must be selected in order for copying a crosstab to work properly.
You cannot copy a crosstab if the view contains continuous dimensions such as continuous dates and times.
Other restrictions may apply depending on the data in your view.
After the general conditions are met, copy the crosstab.
Select Worksheet > Copy > Crosstab .
Open another application, such as Excel, and paste the crosstab.
Источник
From tableau to excel
Tableau Desktop and Web Authoring Help
You can export the data in a Tableau data source, including all or part of the records from your original data. Alternatively, you can export only the portion of data used to generate the view.
Note: If you’re using Tableau Cloud or Tableau Server, instead see Download Views and Workbooks and Link to a PNG, PDF or CSV of a View.
Export data in the data source
After you join tables from one or more connections and make general customisations (for example, create a calculated field, pivot fields, create groups, apply data source or extract filters, etc.) to your Tableau data source, you might want to share or reuse the data in its new form. You can do this using one of the methods listed below.
Note: The export may exclude some table calculations and level of detail expressions.
Export your data to .csv file
Because the .csvВ format is one of the most simple structured formats for data, it is supported by a wide range of tools, databases, and programming languages. Exporting your data in the Tableau data source using this format creates an independent data set and can be a convenient and flexible way to share your data with others.
There are two primary ways you can export your data in the data source to a .csv file in Tableau:В from the Data Source page and from the view.
From the Data Source page:В On the Data Source page, select Data > Export Data to CSV to export all the data in your data source to .csv file.
From the view: On the sheet tab, drag a field to the Columns or Rows shelf, click the View Data icon in the Data pane, and click the Export All button.
Another way to export all of your data or a subset of your data in the data source is to create an extract (.hyper) file. An extract functions as an independent data set, which you can use to connect directly from Tableau. For more information, see Extract Your Data.
Export the data source
After you connect to your data, you can export and save your data source as a Tableau data source (.tds) file. Saving the data source creates a shortcut to your remote data and allows you to avoid having to create a new connection to a specific data set each time. For more information, see Save Data Sources.
Export data used in the view
After you create a view, you can also export just the data used to generate that view.
The fields that are exported come from the fields on the shelves of the sheet. However, fields that function as external filters, in other words, the fields that appear only on the Filters shelf, are not included in the export. If you want to include other fields with the exported data without changing the baseline view, you can place those fields on the Detail shelf.
The various methods for exporting the data used to generate the view is listed below.
Export data in the view to Microsoft Access or .csv
Export the data that is used to generate the view as an Access database (Windows only) or .csv file (Mac only).
In Tableau Desktop, select Worksheet > Export > Data .
Select a location and type a name for your Access database or .csv file.
If you’re on Windows, the Export Data to Access dialog box displays to give you the option to immediately use the new Access database and continue working in Access without interrupting your work flow.
Export crosstab of data in the view to Excel
You can export directly to Excel the data used to generate the view formatted as a crosstab. When you export your view as a crosstab, Tableau automatically opens the Excel application and pastes a crosstab version of the current view into a new Excel workbook.
Although this option provides a direct method for exporting your data to another application, performance of the export can be affected because it is simultaneously copying and formatting the data. If the view you are exporting contains a lot of data, a dialog box opens asking whether you want to export the formatting. In this case, if you choose to exclude the formatting from the export, performance of the export might improve.
- In Tableau Desktop: select Worksheet > Export > Crosstab to Excel .
If you’re using a Mac, this option opens a dialog box where you can save the file. You must then manually open the file in Excel. - In Tableau Server or Tableau Cloud, open a view or dashboard and select Download > Crosstab .
Select which sheets from the workbook to export data from.
Copy data in the view to clipboard
Copy the data used to generate the view so that you can paste it into another application.
Select Worksheet > Copy > Data .
Open another application, such as Word, and paste the data into the document.
In this example, the fields placed on the Columns, Rows, and Colour shelves are copied into the document. However, the Customer Segment field is not copied because it is an external filter because it appears only on the Filters shelf.
Copy crosstab of data in the view to clipboard
You can copy a crosstab version of a view so that you can paste or transfer the data into another application. The pasted data always appears as a crosstab, even if the initial view of the data in Tableau did not use a crosstab format.
Copying a crosstab is restricted by some general conditions:
You must copy all records in the view. You cannot copy a subset of records.
This option is valid for aggregated views only. It cannot be used on disaggregated views of data because a crosstab is by definition an aggregated view of data. This means the Aggregate Measures option on the Analysis menu must be selected in order for copying a crosstab to work properly.
You cannot copy a crosstab if the view contains continuous dimensions such as continuous dates and times.
Other restrictions may apply depending on the data in your view.
After the general conditions are met, copy the crosstab.
Select Worksheet > Copy > Crosstab .
Open another application, such as Excel, and paste the crosstab.
Источник
- In Tableau Desktop: select Worksheet > Export > Crosstab to Excel .


