
| Title | Converting other format files into Stata dataset files | |
| Author | Nicholas J. Cox, Durham University, UK |
-
1. A rule to remember
2. How to get information from Excel into Stata
3. Other methods for transferring information-
3.1 Copy and paste
3.2 import delimited command
3.3 ODBC and odbc load
4. Copying a Stata graph into Excel or any other package
5. Common problems-
5.1 Nonnumeric characters
5.2 Spaces
5.3 Cell formats
5.4 Variable names
5.5 Missing rows and columns
5.6 Leading zeros
5.7 Filename and folder
-
3.1 Copy and paste
1. A rule to remember
Stata expects one matrix or table of data from one sheet,
with at most one line of text at the start defining the contents of
the columns.
2. How to get information from Excel into Stata
Stata can directly import data from Excel (both .xls and .xlsx) files.
Select File > Import > Excel Spreadsheet from Stata’s menus.
Also, see import excel for more
information on importing Excel spreadsheets directly into Stata.
3. Other methods for transferring information
3.1 Copy and paste
Using your Windows or Mac computer,
- Start Excel.
- Enter data in rows and columns or read in a previously saved file.
-
Highlight the data of interest, and then select Edit and click
Copy. -
Start Stata and open the Data Editor (type edit at the Stata dot
prompt). - Paste data into editor by selecting Edit and clicking Paste.
3.2 import delimited command
The following section is based on material originally written by James Hardin,
University of South Carolina, and Ted Anagnoson, California State Los Angeles.
- Launch Excel and read in your Excel file.
-
Save as a text file (tab delimited or comma delimited) by
selecting File and clicking Save As.
If the original filename is
filename.xls, then save the file under the name
filename.txt or filename.csv.
(Use the Save as type list—specifying an extension such as
.txt is not sufficient to produce a text file.) - Quit Excel if you wish.
-
Launch Stata if it is not already running. (If Stata is already running,
then either
save or
clear
your current data.) -
In Stata, type import delimited using filename.ext,
where filename.ext is the name of the file that you
just saved in Excel. Give the complete filename, including the
extension. -
In Stata, type
compress. -
Save the data as a Stata dataset using the
save
command.
3.3 ODBC and odbc load
The following section is provided by Kevin Turner, StataCorp.
- You will have to download and install an Excel ODBC driver from
Microsoft’s website to work with Excel files. - Launch Stata.
- List the ODBC data sources that have been defined by
Windows using the odbc list command. - Click DSN (data source name) listing provided by odbc
list to query that DSN.
odbc list will then list a default entry called
“Excel Files” that you can
use to choose any Excel (*.xls) file to load via ODBC. You
must select an Excel file every time you issue an
odbc command using this DSN. You can also
define your own DSN that always points to a specific Excel
file. On Windows, you would define this special DSN via the
Control Panel called “Administrative Tools”, and
then select “Data Sources (ODBC)”. More
documentation is available from Microsoft concerning how to
define your own Data Sources. - Click the sheet/table corresponding to your data within the
Excel file to describe the contents. You may need to
issue the odbc query command with the
dialog(complete) option if you selected an arbitrary
Excel file in the previous list. - If you are satisfied with the previous description of the
sheet/table, you can click to load the described table. - If all goes well, your data will load into Stata. There are,
however, a few general reasons why loading Excel via ODBC
may be problematic, and those are covered in
section 5.
4. Copying a Stata graph into Excel or any other package
Once you have a suitable graph in Stata’s Graph window,
- Select Edit and click Copy Graph.
- Open or switch to Excel and move to where you want to paste the graph.
- Select Edit and click Paste.
These steps should also work in other packages that accept input in this
manner.
5. Common problems
The following section is from material by Ted Anagnoson, California State
Los Angeles; Dan Chandler, Trinidad, CA; Ronan Conroy, Royal College of
Surgeons, Dublin; David Moore, Hartman Group; Paul Wicks, South Manchester
University Hospitals Trust; Eric Wruck, Positive Economics; and Colin
Fischbacher, University of Edinburgh.
The problems mentioned in it are primarily with respect to text-based methods of importing data from Excel to Stata, such as copying and pasting and import delimited. import excel handles most of these issues.
5.1 Nonnumeric characters
One cell containing a nonnumeric character, such as a letter, within a
column of data is enough for Stata to make that variable a string variable.
It is often easiest to fix this in Excel. Within Stata,
suppose the problematic string variable is named foo.
Here are three alternative ways to identify the rogue observations:
        . tab foo if real(foo) == .
        . edit foo if real(foo) == .
        . list foo if real(foo) == .
If appropriate, they can be replaced by missing, and then the variable as a
whole can be converted to numeric by typing:
        . replace foo = "" if real(foo) == .
        . gen newfoo = real(foo)
        . drop foo
        . rename newfoo foo
You could also use
destring:
. destring foo, replace
destring includes an option for stripping
commas, dollar signs, percent signs, and other nonnumeric characters. It
also allows automatic conversion of percentage data.
5.2 Spaces
What appear to be purely numeric data in Excel are often treated by
Stata as string variables because they include spaces. People may
inadvertently enter space characters in cells that are otherwise
empty. Although Excel strips leading and trailing spaces from numeric
entries, it does not trim spaces from character entries. One or more
space characters by themselves constitute a valid character entry and
are stored as such. Stata dutifully reads the entire column as a
string variable.
Excel has a search and replace capability that enables you to delete these
stray spaces, or you can use a text-processing program or a text editor on
the text file. You can also use the solution in
nonnumeric characters.
5.3 Cell formats
Much of the formatting in Excel interferes with Stata’s ability to interpret
the data reasonably. Just before saving the data as a text file, make sure
that all formatting is turned off, at least temporarily. You can do this by
highlighting the entire spreadsheet, selecting Format, then
selecting Cells, and clicking General.
However, no solution solves all problems. Here is a cautionary tale. A text
file included address data. One column included house numbers, and a few
were in the form 4/2. Excel decided these few were dates and converted them
to 4th February. Setting all cells to a General format does not help
because it converts these unwanted dates to 5 digit Excel date codes. One
solution is to apply a Text format to the offending column when
offered the option during Excel’s text import process. But even this works
only if you have manageably few columns to look through and are aware of the
possibility of the problem.
5.4 Variable names
Stata limits variable names to 32 characters and does not allow
any characters that it uses as operators or delimiters. Also,
variable names should start with a letter. People who are Excel
users first and Stata users second are often creative with the names
they apply to columns. Stata converts illegal column (field) names to labels
and makes a best guess at a sensible variable name. Stata’s best guess,
however, may not be as good as the name a user would choose knowing Stata’s
naming restrictions.
For example, Stata will make variable names using the first 32 characters
of the variable name and use the rest for a label. If the first 32
characters are not unique, subsequent occurrences will be called
var1, var2, etc., or v1, v2, etc. (If you paste
the data, the variable stub is var; if you use insheet, the
stub is v, so be careful writing do-files.)
5.5 Missing rows and columns
Stata completely ignores empty rows in a spreadsheet but not
completely empty columns. A completely empty column gets read
in as a variable with missing values for every observation. Of
course, no harm is done in either case, but spreadsheet users who wish
to add blank columns and/or rows to enhance legibility may wish to
note this difference.
It is best if the first row of data is complete with no missing data.
If necessary, add a dummy row with every value present, and then once in
Stata type
. drop in 1
The missings command by Nicholas J. Cox, which allows
variables or observations that are all missing to be easily dropped, was published in Stata
Journal 15(4). Type search dm0085 for information on this command.
5.6 Leading zeros
With integer-like codes, such as ICD-9 codes or U.S. Social Security
numbers, that do not contain a dash, leading zeros will get dropped when
pasted into Stata from Excel. One solution is to flag
the variable as a string in the first line: add a nonnumeric character in Excel on that
line, and then remove it in Stata.
The missing leading zeros can also be replaced in a conversion to string
with one Stata command line; for example,
. gen svar = string(nvar, "%012.0f")
The second argument on the right-hand side of this command is a format
specifying leading zeros on conversion of nvar to its string
equivalent. For more details on formats, see
format.
5.7 Filename and folder
Confirm the filename and location of the file you are trying to read.
Use Explorer or its equivalent to check.
For example, you may have inadvertently produced a file named
filename.txt.txt, or more generally, a name that ends with two
extensions, which may or may not be the same extension. This naming is
possible if you have an option checked in Windows Explorer under
View, Folder Options to hide file extensions for known or
registered file types. Manually rename the file, or use the correct
filename in your Stata command. You may also wish to uncheck this option to
avoid similar mistakes in the future.
Содержание
- Русские Блоги
- Несколько методов импорта данных Stata
- оглавление
- 1. Метод 1: Ctrl + C / Ctrl + V (применимо, когда объем данных небольшой)
- 2. Метод 2. Импортируйте файл Excel напрямую (применимо, если файл большой).
- 3. Способ 3. Дважды щелкните файл dta, чтобы открыть его с помощью Stata.
- 4. Метод 4: импортировать сохраненный файл в Stata.
- 5. Метод 5. Введите команду использования.
- Интеллектуальная рекомендация
- Проверка полномочий на основе JWT и фактические боевые учения
- [Android Development Fast Getsing] Запустите стойку регистрации приложения для подсказки для тостов
- Установите Raspberry Pi из Raspberry Pi в беспроводной маршрутизатор (Wi -Fi Hotspot AP, RTL8188CUS Chip)
- [Серия исходного кода Java] строка (2) Проблема нового, а не новой
- 05-Vue News Mobile Project
- Вам также может понравиться
- 1008 Рассматривая задача Element Element Cycle (20 баллов)
- Linux centos7 виртуальная машина установить Docker (5) —. Netcore
- Разработать интерфейс мониторинга состояния здоровья
- [Реабилитация] #C Language Array Joseph Проблема
- From excel to dta
- 1 item has been added to your cart.
- Stata/MP4 Annual License (download)
- Stata: Data Analysis and Statistical Software
- How do I get information from Excel into Stata?
- 1. A rule to remember
- 2. How to get information from Excel into Stata
- 3. Other methods for transferring information
- 3.1 Copy and paste
- 3.2 import delimited command
- 3.3 ODBC and odbc load
- 4. Copying a Stata graph into Excel or any other package
- 5. Common problems
- 5.1 Nonnumeric characters
- 5.2 Spaces
- 5.3 Cell formats
- 5.4 Variable names
- 5.5 Missing rows and columns
- 5.6 Leading zeros
- 5.7 Filename and folder
Русские Блоги
Несколько методов импорта данных Stata
оглавление
1. Метод 1: Ctrl + C / Ctrl + V (применимо, когда объем данных небольшой)
2. Метод 2. Импортируйте файл Excel напрямую (применимо, если файл большой).
3. Способ 3. Дважды щелкните файл dta, чтобы открыть его с помощью Stata.
4. Метод 4: импортировать сохраненный файл в Stata.
- Используйте SPSS, чтобы открыть сохраненный файл, SPSS может вывести файл в формат Stata

- Выберите сохранить, чтобы получить файл dta, дважды щелкните, чтобы открыть данные с помощью Stata

5. Метод 5. Введите команду использования.
Войдите в область команд Stata
Вы можете использовать файл dta.Как правило, удобнее открыть папку напрямую и дважды щелкнуть ее, чтобы открыть.
- Stata не обеспечивает операций отмены, а несохраненные данные хранятся в области памяти. Используйте команду clear, чтобы удалить данные в области памяти. Обратите внимание на своевременное сохранение и резервное копирование при выполнении операций редактирования данных.
- Stata чувствительна к регистру.
Интеллектуальная рекомендация

Проверка полномочий на основе JWT и фактические боевые учения
Предисловие: Большинство систем, за исключением большинства финансовых систем, требуют строгой системы безопасности (такой как shiro), общие требования к безопасности системы не очень высоки, требуетс.

[Android Development Fast Getsing] Запустите стойку регистрации приложения для подсказки для тостов
1. Реализуйте переднюю и заднюю часть приложения Цель:Чтобы снять риск захвата интерфейса Android, сообщите пользователям, что приложение работает в фоновом режиме. Обычно нажимает клавишу Home, чтобы.
Установите Raspberry Pi из Raspberry Pi в беспроводной маршрутизатор (Wi -Fi Hotspot AP, RTL8188CUS Chip)
Эта статья основана на USB Wireless Network Card (RTL8188CUS Chip), приобретенной на определенном востоке, чтобы создать беспроводные горячие точки. Первоначально я хотел сделать один сценарий. Просто.

[Серия исходного кода Java] строка (2) Проблема нового, а не новой
Серия строк: 【Серия исходного кода Java】 строка (1) под анализом базовой структуры [Серия исходного кода Java] строка (2) Проблема нового, а не новой [Серия исходного кода Java] Строка (3) Общий анали.

05-Vue News Mobile Project
1 Javascri не добавляет при добавлении толстой кишки При получении и изменении атрибутов реквизит плюс this. $router.push( ) 2 Axios Установка и использование Цитата в main.js 2.1axios, чтобы отправит.
Вам также может понравиться
1008 Рассматривая задача Element Element Cycle (20 баллов)
Массив A содержит n (> 0) целое число, не позволяя использовать дополнительные массивы, чтобы повернуть каждое целое число в положение правого m (≥0), данные в (A 0) A1 ⋯ A N-1) (An-M ⋯ A N-1 A .

Linux centos7 виртуальная машина установить Docker (5) —. Netcore
Текущая версия: версия Docker (например, Docker 17.03.2) .netcore версия 3.1 1 Постройте зеркало 2 запустить зеркало 3 Доступ Введите контейнер Nginx: Посещение в контейнере Выйдите из контейнера, что.

Разработать интерфейс мониторинга состояния здоровья
1. Требование Интерфейс должен содержать логическую обработку и чтение базы данных. 2. Реализация 1) Разработать доступ к интерфейсу к базе данных, успешный доступ, код статуса возврата 200, ненормаль.
[Реабилитация] #C Language Array Joseph Проблема
Я не двигал код в течение года. Теперь мой мозг не хорош, я использовал глупость, чтобы решить проблему Йозефа кольца. Написание здесь является запись, которая спасает свой собственный беспорядок. Воп.
Источник
From excel to dta

Строго говоря, мне нужно конвертировать только один файл: cpi-98-18.dta в https://www.researchgate.net/post/Co. if_you_have_it
В одном месте прочитал, что самый простой способ – это с помощью программы Stata, но не смог её найти.
В списке программ для открытия dta – файлов https://www.filetypeadvisor.com/ru/extension/dta увидел даже Microsoft Office. Но никакие его программы у меня делать это не хотели.
В https://stackoverflow.com/questions/. stata-software приведёно много других разных советов. В частности, программа SPSS, но она тоже что-то не пошла. Попробовал скачать там и некоторые другие рекомендуемые программы, но не смог найти … Целый день сегодня с этим провозился и решил написать на форум.
Может, кто знает конкретную программу, которая свободно лежит в сети и которую там можно взять и использовать для конвертации? Или, может, кто просто поможет конвертировать упомянутый файл (всего то — один)?


__________________
Есть две бесконечные вещи, Вселенная и глупость.
Впрочем, на счет Вселенной, я не уверен
Какая-то программа работы с со статистикой.
Родная, судя по всему, к таким («dta») файлам — это программа stata. Хотя, это условно: похоже, и другие программы с этим расширением работают как с родным.
Я бы тоже хотел получше узнать что за файл, но, судя по тому, что откуда я его скачал — было много благодарностей за файл и никто не спросил (кроме меня в самом конце) что это за фал — это какой-то стандартный, в каких-то «статистических кругах» формат.
В сети пишут, что с форматом работает программа stata так, что склоняюсь к выводу, что изначально он для этой программы и был создан. Но в свободном доступе в сети найти её не смог.
Источник
1 item has been added to your cart.

Stata/MP4 Annual License (download)
![]()
Stata: Data Analysis and Statistical Software
How do I get information from Excel into Stata?
| Title | Converting other format files into Stata dataset files |
| Author | Nicholas J. Cox, Durham University, UK |
1. A rule to remember
2. How to get information from Excel into Stata
3. Other methods for transferring information
3.1 Copy and paste
3.2 import delimited command
3.3 ODBC and odbc load
4. Copying a Stata graph into Excel or any other package
5. Common problems
5.1 Nonnumeric characters
5.2 Spaces
5.3 Cell formats
5.4 Variable names
5.5 Missing rows and columns
5.6 Leading zeros
5.7 Filename and folder
1. A rule to remember
Stata expects one matrix or table of data from one sheet, with at most one line of text at the start defining the contents of the columns.
2. How to get information from Excel into Stata
Stata can directly import data from Excel (both .xls and .xlsx) files.
Select File > Import > Excel Spreadsheet from Stata’s menus.
Also, see import excel for more information on importing Excel spreadsheets directly into Stata.
3. Other methods for transferring information
3.1 Copy and paste
Using your Windows or Mac computer,
- Start Excel.
- Enter data in rows and columns or read in a previously saved file.
- Highlight the data of interest, and then select Edit and click Copy.
- Start Stata and open the Data Editor (type edit at the Stata dot prompt).
- Paste data into editor by selecting Edit and clicking Paste.
3.2 import delimited command
The following section is based on material originally written by James Hardin, University of South Carolina, and Ted Anagnoson, California State Los Angeles.
- Launch Excel and read in your Excel file.
- Save as a text file (tab delimited or comma delimited) by selecting File and clicking Save As. If the original filename is filename.xls, then save the file under the name filename.txt or filename.csv. (Use the Save as type list—specifying an extension such as .txt is not sufficient to produce a text file.)
- Quit Excel if you wish.
- Launch Stata if it is not already running. (If Stata is already running, then either save or clear your current data.)
- In Stata, type import delimited usingfilename.ext, where filename.ext is the name of the file that you just saved in Excel. Give the complete filename, including the extension.
- In Stata, type compress.
- Save the data as a Stata dataset using the save command.
3.3 ODBC and odbc load
The following section is provided by Kevin Turner, StataCorp.
- You will have to download and install an Excel ODBC driver from Microsoft’s website to work with Excel files.
- Launch Stata.
- List the ODBC data sources that have been defined by Windows using the odbc list command.
- Click DSN (data source name) listing provided by odbc list to query that DSN. odbc list will then list a default entry called “Excel Files” that you can use to choose any Excel (*.xls) file to load via ODBC. You must select an Excel file every time you issue an odbc command using this DSN. You can also define your own DSN that always points to a specific Excel file. On Windows, you would define this special DSN via the Control Panel called “Administrative Tools”, and then select “Data Sources (ODBC)”. More documentation is available from Microsoft concerning how to define your own Data Sources.
- Click the sheet/table corresponding to your data within the Excel file to describe the contents. You may need to issue the odbc query command with the dialog(complete) option if you selected an arbitrary Excel file in the previous list.
- If you are satisfied with the previous description of the sheet/table, you can click to load the described table.
- If all goes well, your data will load into Stata. There are, however, a few general reasons why loading Excel via ODBC may be problematic, and those are covered in section 5.
4. Copying a Stata graph into Excel or any other package
Once you have a suitable graph in Stata’s Graph window,
- Select Edit and click Copy Graph.
- Open or switch to Excel and move to where you want to paste the graph.
- Select Edit and click Paste.
These steps should also work in other packages that accept input in this manner.
5. Common problems
The following section is from material by Ted Anagnoson, California State Los Angeles; Dan Chandler, Trinidad, CA; Ronan Conroy, Royal College of Surgeons, Dublin; David Moore, Hartman Group; Paul Wicks, South Manchester University Hospitals Trust; Eric Wruck, Positive Economics; and Colin Fischbacher, University of Edinburgh.
The problems mentioned in it are primarily with respect to text-based methods of importing data from Excel to Stata, such as copying and pasting and import delimited. import excel handles most of these issues.
5.1 Nonnumeric characters
One cell containing a nonnumeric character, such as a letter, within a column of data is enough for Stata to make that variable a string variable. It is often easiest to fix this in Excel. Within Stata, suppose the problematic string variable is named foo. Here are three alternative ways to identify the rogue observations:
If appropriate, they can be replaced by missing, and then the variable as a whole can be converted to numeric by typing:
destring includes an option for stripping commas, dollar signs, percent signs, and other nonnumeric characters. It also allows automatic conversion of percentage data.
5.2 Spaces
What appear to be purely numeric data in Excel are often treated by Stata as string variables because they include spaces. People may inadvertently enter space characters in cells that are otherwise empty. Although Excel strips leading and trailing spaces from numeric entries, it does not trim spaces from character entries. One or more space characters by themselves constitute a valid character entry and are stored as such. Stata dutifully reads the entire column as a string variable.
Excel has a search and replace capability that enables you to delete these stray spaces, or you can use a text-processing program or a text editor on the text file. You can also use the solution in nonnumeric characters.
5.3 Cell formats
Much of the formatting in Excel interferes with Stata’s ability to interpret the data reasonably. Just before saving the data as a text file, make sure that all formatting is turned off, at least temporarily. You can do this by highlighting the entire spreadsheet, selecting Format, then selecting Cells, and clicking General.
However, no solution solves all problems. Here is a cautionary tale. A text file included address data. One column included house numbers, and a few were in the form 4/2. Excel decided these few were dates and converted them to 4th February. Setting all cells to a General format does not help because it converts these unwanted dates to 5 digit Excel date codes. One solution is to apply a Text format to the offending column when offered the option during Excel’s text import process. But even this works only if you have manageably few columns to look through and are aware of the possibility of the problem.
5.4 Variable names
Stata limits variable names to 32 characters and does not allow any characters that it uses as operators or delimiters. Also, variable names should start with a letter. People who are Excel users first and Stata users second are often creative with the names they apply to columns. Stata converts illegal column (field) names to labels and makes a best guess at a sensible variable name. Stata’s best guess, however, may not be as good as the name a user would choose knowing Stata’s naming restrictions.
For example, Stata will make variable names using the first 32 characters of the variable name and use the rest for a label. If the first 32 characters are not unique, subsequent occurrences will be called var1, var2, etc., or v1, v2, etc. (If you paste the data, the variable stub is var; if you use insheet, the stub is v, so be careful writing do-files.)
5.5 Missing rows and columns
Stata completely ignores empty rows in a spreadsheet but not completely empty columns. A completely empty column gets read in as a variable with missing values for every observation. Of course, no harm is done in either case, but spreadsheet users who wish to add blank columns and/or rows to enhance legibility may wish to note this difference.
It is best if the first row of data is complete with no missing data. If necessary, add a dummy row with every value present, and then once in Stata type
The missings command by Nicholas J. Cox, which allows variables or observations that are all missing to be easily dropped, was published in Stata Journal 15(4). Type search dm0085 for information on this command.
5.6 Leading zeros
With integer-like codes, such as ICD-9 codes or U.S. Social Security numbers, that do not contain a dash, leading zeros will get dropped when pasted into Stata from Excel. One solution is to flag the variable as a string in the first line: add a nonnumeric character in Excel on that line, and then remove it in Stata.
The missing leading zeros can also be replaced in a conversion to string with one Stata command line; for example,
The second argument on the right-hand side of this command is a format specifying leading zeros on conversion of nvar to its string equivalent. For more details on formats, see format.
5.7 Filename and folder
Confirm the filename and location of the file you are trying to read. Use Explorer or its equivalent to check.
Источник
Время на прочтение
5 мин
Количество просмотров 63K
Excel — это чрезвычайно распространённый инструмент для анализа данных. С ним легко научиться работать, есть он практически на каждом компьютере, а тот, кто его освоил, может с его помощью решать довольно сложные задачи. Python часто считают инструментом, возможности которого практически безграничны, но который освоить сложнее, чем Excel. Автор материала, перевод которого мы сегодня публикуем, хочет рассказать о решении с помощью Python трёх задач, которые обычно решают в Excel. Эта статья представляет собой нечто вроде введения в Python для тех, кто хорошо знает Excel.

Загрузка данных
Начнём с импорта Python-библиотеки pandas и с загрузки в датафреймы данных, которые хранятся на листах sales и states книги Excel. Такие же имена мы дадим и соответствующим датафреймам.
import pandas as pd
sales = pd.read_excel('https://github.com/datagy/mediumdata/raw/master/pythonexcel.xlsx', sheet_name = 'sales')
states = pd.read_excel('https://github.com/datagy/mediumdata/raw/master/pythonexcel.xlsx', sheet_name = 'states')
Теперь воспользуемся методом .head() датафрейма sales для того чтобы вывести элементы, находящиеся в начале датафрейма:
print(sales.head())
Сравним то, что будет выведено, с тем, что можно видеть в Excel.
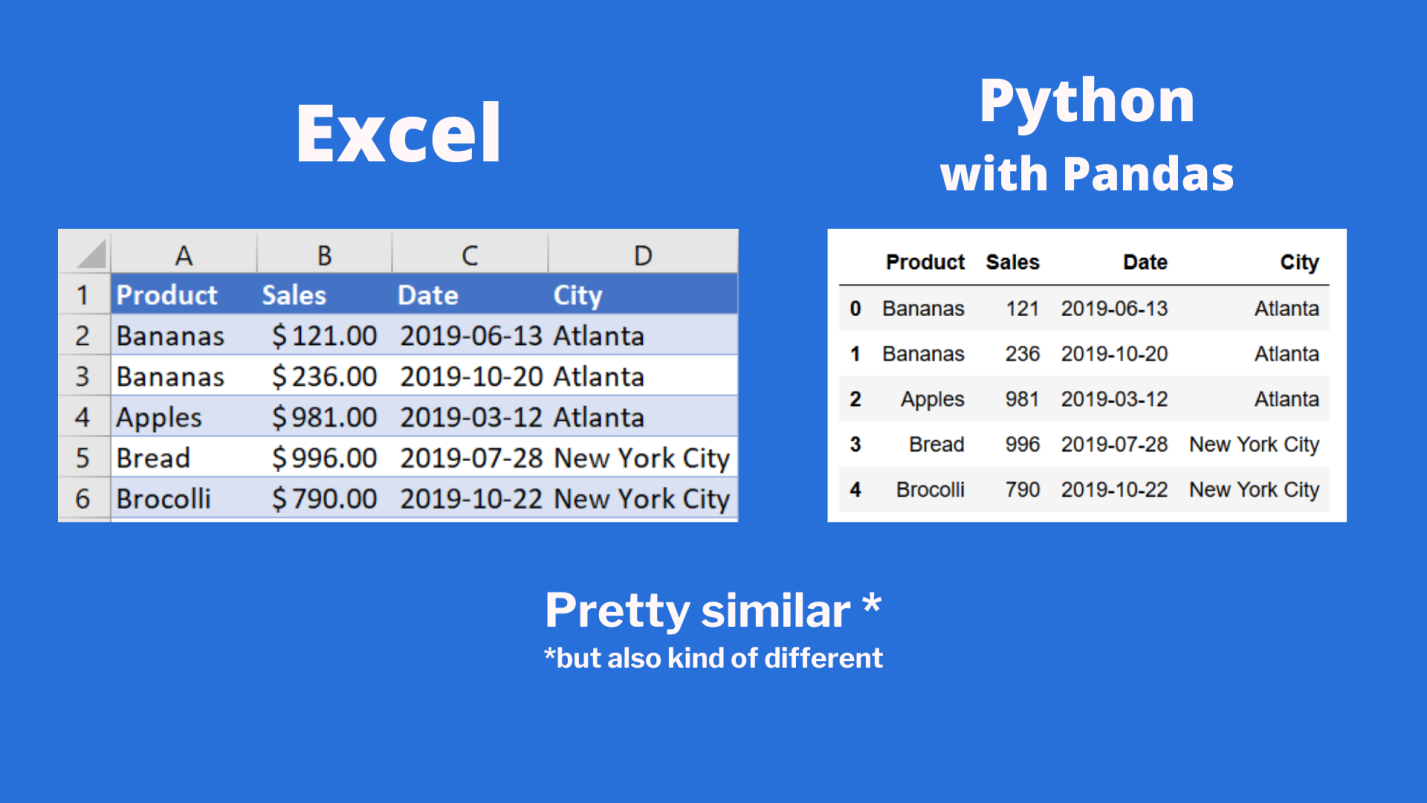
Сравнение внешнего вида данных, выводимых в Excel, с внешним видом данных, выводимых из датафрейма pandas
Тут можно видеть, что результаты визуализации данных из датафрейма очень похожи на то, что можно видеть в Excel. Но тут имеются и некоторые очень важные различия:
- Нумерация строк в Excel начинается с 1, а в pandas номер (индекс) первой строки равняется 0.
- В Excel столбцы имеют буквенные обозначения, начинающиеся с буквы
A, а в pandas названия столбцов соответствуют именам соответствующих переменных.
Продолжим исследование возможностей pandas, позволяющих решать задачи, которые обычно решают в Excel.
Реализация возможностей Excel-функции IF в Python
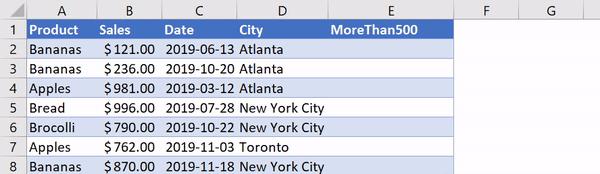
В Excel существует очень удобная функция IF, которая позволяет, например, записать что-либо в ячейку, основываясь на проверке того, что находится в другой ячейке. Предположим, нужно создать в Excel новый столбец, ячейки которого будут сообщать нам о том, превышают ли 500 значения, записанные в соответствующие ячейки столбца B. В Excel такому столбцу (в нашем случае это столбец E) можно назначить заголовок MoreThan500, записав соответствующий текст в ячейку E1. После этого, в ячейке E2, можно ввести следующее:
=IF([@Sales]>500, "Yes", "No")
Использование функции IF в Excel
Для того чтобы сделать то же самое с использованием pandas, можно воспользоваться списковым включением (list comprehension):
sales['MoreThan500'] = ['Yes' if x > 500 else 'No' for x in sales['Sales']]
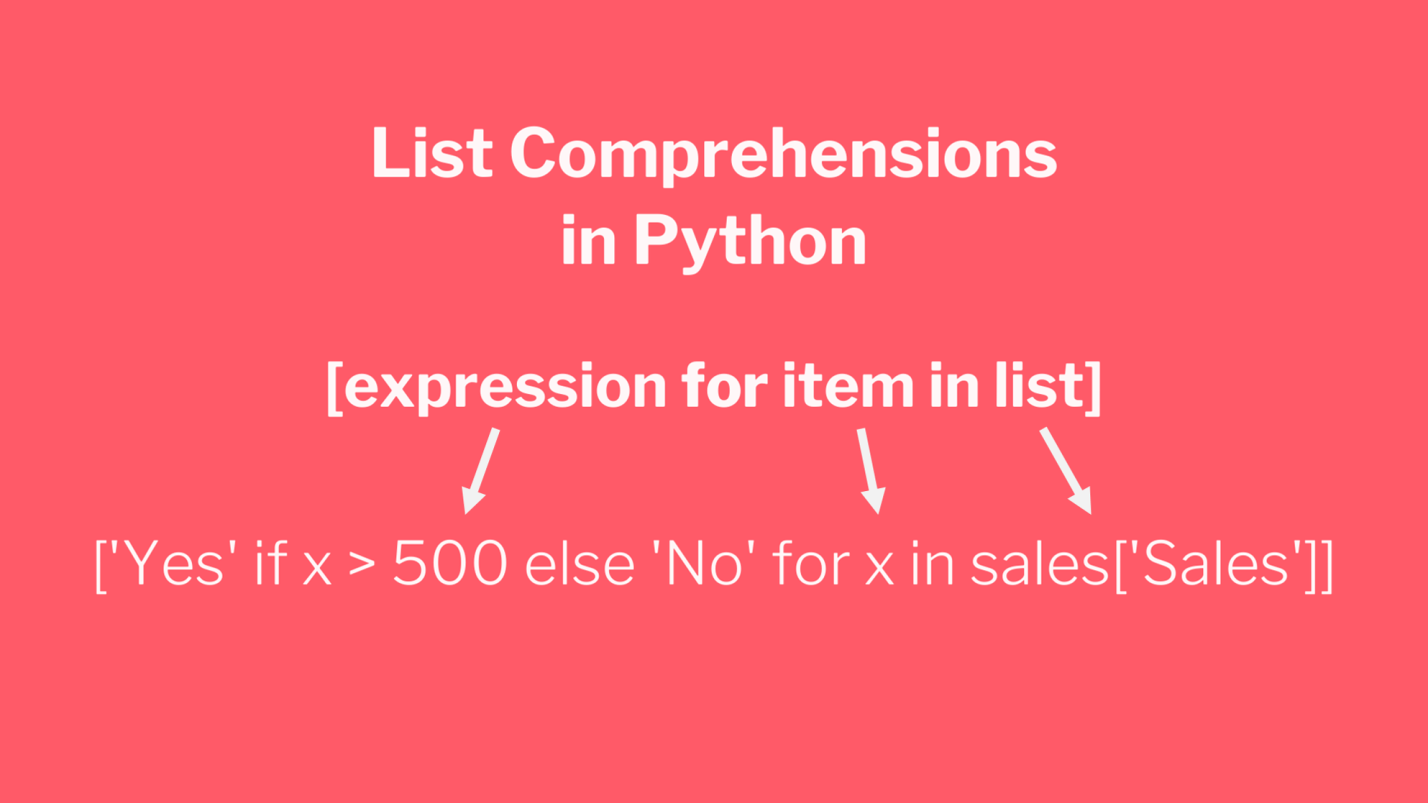
Списковые включения в Python: если текущее значение больше 500 — в список попадает Yes, в противном случае — No
Списковые включения — это отличное средство для решения подобных задач, позволяющее упростить код за счёт уменьшения потребности в сложных конструкциях вида if/else. Ту же задачу можно решить и с помощью if/else, но предложенный подход экономит время и делает код немного чище. Подробности о списковых включениях можно найти здесь.
Реализация возможностей Excel-функции VLOOKUP в Python
В нашем наборе данных, на одном из листов Excel, есть названия городов, а на другом — названия штатов и провинций. Как узнать о том, где именно находится каждый город? Для этого подходит Excel-функция VLOOKUP, с помощью которой можно связать данные двух таблиц. Эта функция работает по принципу левого соединения, когда сохраняется каждая запись из набора данных, находящегося в левой части выражения. Применяя функцию VLOOKUP, мы предлагаем системе выполнить поиск определённого значения в заданном столбце указанного листа, а затем — вернуть значение, которое находится на заданное число столбцов правее найденного значения. Вот как это выглядит:
=VLOOKUP([@City],states,2,false)
Зададим на листе sales заголовок столбца F как State и воспользуемся функцией VLOOKUP для того чтобы заполнить ячейки этого столбца названиями штатов и провинций, в которых расположены города.

Использование функции VLOOKUP в Excel
В Python сделать то же самое можно, воспользовавшись методом merge из pandas. Он принимает два датафрейма и объединяет их. Для решения этой задачи нам понадобится следующий код:
sales = pd.merge(sales, states, how='left', on='City')
Разберём его:
- Первый аргумент метода
merge— это исходный датафрейм. - Второй аргумент — это датафрейм, в котором мы ищем значения.
- Аргумент
howуказывает на то, как именно мы хотим соединить данные. - Аргумент
onуказывает на переменную, по которой нужно выполнить соединение (тут ещё можно использовать аргументыleft_onиright_on, нужные в том случае, если интересующие нас данные в разных датафреймах названы по-разному).
Сводные таблицы
Сводные таблицы (Pivot Tables) — это одна из самых мощных возможностей Excel. Такие таблицы позволяют очень быстро извлекать ценные сведения из больших наборов данных. Создадим в Excel сводную таблицу, выводящую сведения о суммарных продажах по каждому городу.
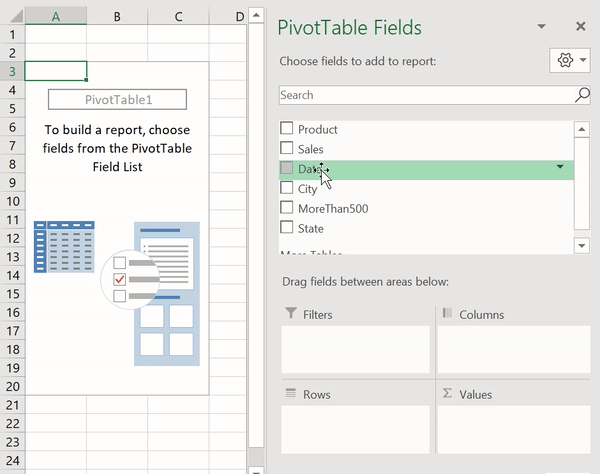
Создание сводной таблицы в Excel
Как видите, для создания подобной таблицы достаточно перетащить поле City в раздел Rows, а поле Sales — в раздел Values. После этого Excel автоматически выведет суммарные продажи для каждого города.
Для того чтобы создать такую же сводную таблицу в pandas, нужно будет написать следующий код:
sales.pivot_table(index = 'City', values = 'Sales', aggfunc = 'sum')
Разберём его:
- Здесь мы используем метод
sales.pivot_table, сообщая pandas о том, что мы хотим создать сводную таблицу, основанную на датафреймеsales. - Аргумент
indexуказывает на столбец, по которому мы хотим агрегировать данные. - Аргумент
valuesуказывает на то, какие значения мы собираемся агрегировать. - Аргумент
aggfuncзадаёт функцию, которую мы хотим использовать при обработке значений (тут ещё можно воспользоваться функциямиmean,max,minи так далее).
Итоги
Из этого материала вы узнали о том, как импортировать Excel-данные в pandas, о том, как реализовать средствами Python и pandas возможности Excel-функций IF и VLOOKUP, а также о том, как воспроизвести средствами pandas функционал сводных таблиц Excel. Возможно, сейчас вы задаётесь вопросом о том, зачем вам пользоваться pandas, если то же самое можно сделать и в Excel. На этот вопрос нет однозначного ответа. Python позволяет создавать код, который поддаётся тонкой настройке и глубокому исследованию. Такой код можно использовать многократно. Средствами Python можно описывать очень сложные схемы анализа данных. А возможностей Excel, вероятно, достаточно лишь для менее масштабных исследований данных. Если вы до этого момента пользовались только Excel — рекомендую испытать Python и pandas, и узнать о том, что у вас из этого получится.
А какие инструменты вы используете для анализа данных?
Напоминаем, что у нас продолжается конкурс прогнозов, в котором можно выиграть новенький iPhone. Еще есть время ворваться в него, и сделать максимально точный прогноз по злободневным величинам.

First of all, if you are doing this for any reason other than killing time, you should never create a data set by copy/pasting from Excel to the data editor. There are two reasons. First, it is error prone: it is too easy to omit a row or column and not realize it. Second, it leaves no audit trail of how the data set was created—so if a question arises about it a year from now, nobody will know what was done. Data management and analysis without a complete audit trail from beginning to end cannot and should not be trusted.
If the Excel data set is well laid out (which it needs to be for copy/paste to appear to work anyway) the correct way to bring it into Stata is with the -import excel- command. Read -help import excel- for information on how to use it, and, in particular, what options to use for particular situations.
With that out of the way, the solution to the question you posed is to create a new data set for the additional variables and then use the -merge- command to put them together. If you are not familiar with using -merge-, read -help merge- and also the associated PDF documentation (blue link near the top of the -help merge- page). If you are unsure how to proceed, or if you have difficulty when you try, do post back, showing examples of both Stata data sets. (Do that using the -dataex- command so that the examples are usable by others. If you are running version 15.1 or a fully updated version 14.2, -dataex- is already part of your official Stata installation. If not, run -ssc install dataex- to get it. Either way, run -help dataex- to read the simple instructions for using it. -dataex- will save you time; it is easier and quicker than typing out tables. It includes complete information about aspects of the data that are often critical to answering your question but cannot be seen from tabular displays or screenshots. It also makes it possible for those who want to help you to create a faithful representation of your example to try out their code, which in turn makes it more likely that their answer will actually work in your data.)
Author: Gang (Zhongnan University)
Email: [email protected]
Stata Evening Club Metrology || Quality Course || Jane Tweet || Public account collection
Lianxiang meeting measurement method topic…
1. Application Background
In the process of data processing, usually face the difficulty of data set format conversion, compared with Stata’s.dta Data files, Excel data is more widely used. So how to.dta Data into.xls Or.xlsx Suffix Excel data?
This article introducesexport excel The command is mainly to solve this problem. The following will be aroundusagewithApplicationsExpanded in two areas, mainly introducing the use of commands.
If window operation is used, the corresponding process is:File → Export → Data to Excel spreadsheet(_.xls; _.xlsx)。
2. Usage introduction
Below, we divide into two sections and introduceexport excel Basic syntax and various options.
2.1 Basic syntax
export excel The basic syntax is as follows:
export excel [using] filename [if] [in][, export_excel_options]
- among them,
export excelIt is the main body of the order and cannot be omitted; usingTo specify the file used, it can be omitted when exporting the entire data set;filenameIs the name of the exported Excel file;ifwithinCan limit the range of data to be exported;export_excel_optionsFor the options added on the basic command,See section 2.2 for details.
If you only need to export some variable names, you canexcel export Add the corresponding variable name later,Note that at this timeusing Cannot be omitted, The corresponding syntax is as follows:
export excel [varlist] using filename [if] [in][, export_excel_options]
2.2 Option introduction
export excel Contains a wealth of options, the following from the main options (Main Options) and other options (Advanced Options) are introduced, and focus on the selection of data processing commonly used for detailed description.
Main Options
| Options | use |
|---|---|
replace |
Overwrite existing files |
firstrow(variables or varlabels) |
Set the first act of exporting datavariable namestill isVariable labels |
sheet("sheetname") |
Specify sheetname |
cell(start) |
From start (upper-left) Start writing data |
sheetmodify |
Do not modify the data outside the export rangesheetreplace replace Use with options |
sheetreplace |
Clear the sheet data before exporting.sheetreplace replace Use with options |
nolabel |
Export variable values instead of variable value labels |
keepcellfmt |
Keep cell format of existing table |
It is worth explaining that the most commonly used issheet("sheetname") firstrow(variables|varlabels) replace Options.
sheet()The option can specify the sheet name of the data when exporting to Excel, but it can realize the function of modifying the sheet name according to requirements. It is more convenient to apply it in the loop. You can refer to the usage in Task2 in section 3.1 below.firstrow(variables|varlabels)The option can specify whether the header is a variable name or variable label when exporting to Excel,When not addingfirstrowWhen selected, the data is exported by default and does not contain variable names。replaceThe option is the same as the usage in other commands. It overwrites the existing data. It is generally required, otherwise an error will be reportedfile already exists。But when usingsheet()Option timerepalceCan be omitted, Indicating that multiple sheets ** are written in an Excel table.
The following shows for everyonesheet("sheetname") with firstrow(variables|varlabels) The effect of using, pay attention to carefully observe the exported Excel filesheet name with Header Difference.
sysuse auto, clear

 * Set the name of the subsheet (Sheet) of the Excel file
export excel using "auto.xls", replace sheet("auto")

 //Result: Observe the sheet name of the Excel file

 * Export Excel header as variable name
preserve
  keep make price mpg rep78
  export excel using "auto_varname.xls", firstrow(variable) replace
restore

 /*Result: The first three lines of auto_varname.xls
make		price	mpg	rep78
AMC Concord	4,099	22	3
AMC Pacer	4,749	17	3
*/

 *Set the header of the exported Excel as the variable name
preserve
  keep make price mpg rep78
  export excel using "auto_varlabel.xls", firstrow(varlabel) replace
restore

 /*Result: first three lines of auto_varlabel.xls
Make and Model	Price	Mileage (mpg)	Repair Record 1978
AMC Concord	4,099	22	        3
AMC Pacer	4,749	17	        3
*/
Advanced options
| Options | use |
|---|---|
datestring(datetime_format) |
Export time format data to character |
missing(repval) |
Export missing values as specified missing value markers (repval), either character or numeric,If there is no such option, the default export is a space |
locale(locale) |
This option may be required when using the extended ASCII character set. The default environment is UTF-8 |
Lianxiang meeting measurement method topic…
3. Application case
3.1 Case One
Followrep78 The variable (the number of times the car was repaired in 1978) willauto.dta Split intoExcel A subset of the format.
- Task1: Follow
auto_rep78_i_.xlsNamed file, whereiRepresent the corresponding repair times; - Task2: Generate
auto_rep78_all.xlsA data set, where one Sheet corresponds to a subset.
Tip: The key to solving these two problems lies in the key introduction in Section 2.2sheet("sheetname")withfirstrow(variables|varlabels) Use of two options.
sysuse auto, clear

 tabulate rep78 //List the categories and frequency distribution of rep78

levelsof rep78,local(rep)
foreach i in `rep'{
	preserve
	keep if rep78 == `i'
	export excel using "auto_rep78_`i'.xls", firstrow(variable) replace
	export excel using "auto_rep78_all.xls", firstrow(variable) sheet(`i')
	restore
	}
3.2 Case two
To useexport excel Exportnlsw88.dtaData setvariable name with Variable labels ,existnamewith varlabelTwo columns, the file name isnlsw88_varname_varlab.xls 。
Processing ideas: Importnlsw88.dta Data —> Use the firstrow(variable) option to get the variable name (Data1) —> Use
firstrow(varlabel)Option to get variable label (Data2) —> mergeData1 with Data2 —> Transpose from row to column.
sysuse nlsw88, clear

*Get variable name
preserve
  export excel using "nlsw88_varname.xls" in 1,firstrow(variable) replace
  import excel using  "nlsw88_varname.xls", clear
  keep in 1
  save "nlsw88_varname.dta", replace
restore

 *Get variable labels
export excel using "nlsw88_varlab.xls" in 1, firstrow(varlabels) replace
import excel using  "nlsw88_varlab.xls", clear
keep in 1
save "nlsw88_varlab.dta", replace

 *Merge, transpose
use "nlsw88_varname.dta", clear
append using "nlsw88_varlab.dta"
sxpose, clear
rename _var1 varname
rename _var2 varlabel
list varname  varlab, noobs
export excel using "nlsw88_varname_varlab.xls",firstrow(variable) replace

/*
  +-----------------------------------------+
  |       varname                  varlabel |
  |-----------------------------------------|
  |        idcode                    NLS id |
  |           age       age in current year |
  |          race                      race |
  |       married                   married |
  | never_married             never married |
  |-----------------------------------------|
  |         grade   current grade completed |
  |      collgrad          college graduate |
  |         south            lives in south |
  |          smsa             lives in SMSA |
  |        c_city     lives in central city |
  |-----------------------------------------|
  |      industry                  industry |
  |    occupation                occupation |
  |         union              union worker |
  |          wage               hourly wage |
  |         hours        usual hours worked |
  |-----------------------------------------|
  |       ttl_exp     total work experience |
  |        tenure        job tenure (years) |
  +-----------------------------------------+
*/
Small eggs:describe, replace The command can quickly achieve the above requirements, and export the position, name, type, isnumeric, format, vallab, varlab of the data set to a new data set.
sysuse nlsw88, clear
describe, replace
describe
list name varlab, noobs
keep name varlab
export excel using "nlsw88_varname_varlab.xls",firstrow(variable) replace
Lianxiang meeting measurement method topic…
4. Attached: all codes in the text
* ##2.2 Introduce the use of firstrow and sheet
sysuse auto, clear
 *Set the sheet name of the Excel file
export excel using “auto.xls", replace sheet("auto")

 *Export Excel header as variable name
preserve
  keep make price mpg rep78
  export excel using "auto_varname.xls", firstrow(variable) replace
restore

 *Set the header of the exported Excel as the variable name
preserve
  keep make price mpg rep78
  export excel using "auto_varlabel.xls", firstrow(varlabel) replace
restore

 * ## 3.1 Case One
sysuse auto, clear
levelsof rep78,local(rep)
foreach i in `rep'{
	preserve
	keep if rep78 == `i'
	export excel using "auto_rep78_`i'.xls", firstrow(variable) replace
	export excel using "auto_rep78.xls", firstrow(variable) sheet(`i')
	restore
	}

 * ## 3.2 Case 2
sysuse nlsw88, clear

 *Get variable name
preserve
  export excel using "nlsw88_varname.xls" in 1,firstrow(variable) replace
  import excel using  "nlsw88_varname.xls",clear
  keep in 1
  save "nlsw88_varname.dta", replace
restore

 *Get variable labels
export excel using "nlsw88_varlab.xls" in 1, firstrow(varlabels) replace
import excel using  "nlsw88_varlab.xls",clear
keep in 1
save "nlsw88_varlab.dta", replace

 *Merge, transpose
use "nlsw88_varname.dta", clear
append using "nlsw88_varlab.dta"
sxpose, clear
rename _var1 varname
rename _var2 varlabel
list varname  varlab, noobs
export excel using "nlsw88_varname_varlab.xls",firstrow(variable) replace
about us
- Stata Evening Founded by the team of teacher Lian Yujun of Sun Yat-sen University, regularly sharing empirical analysis experience.
- Welcome to give manuscript: Welcome to send the manuscript to [email protected] Accepted manuscriptsThree articles Above, justfree Obtained one Stata on-site training qualification.
- Past wonderful tweets:
Stata drawing | Time series + panel data | Stata resources | Data processing + program | Regression analysis-cross product-endogeneity