
This tutorial explains how to import data from Excel into the SPSS statistics package.
Preparing Excel
Open the Excel spreadsheet from which you wish to import data.
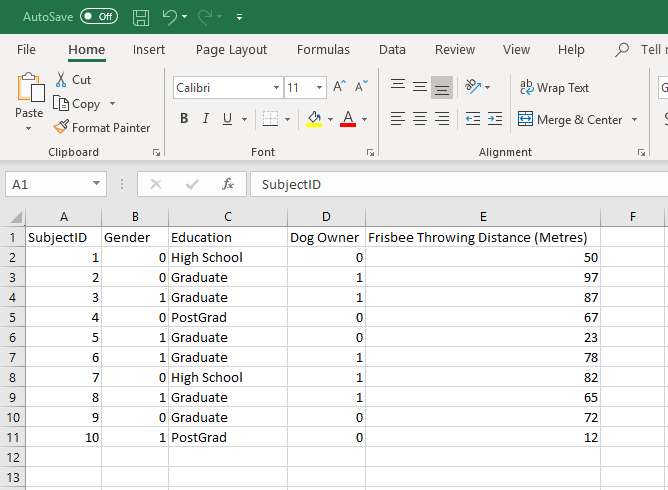
You can see in our example that we have 5 columns of data.
Before you begin the process of importing your data into SPSS, you need to ensure that your variable names are in the first row of the worksheet, and that there is no gap between the first and second rows. Our worksheet satisfies both these requirements.
It’s also wise to clean up your data. For example, if you had coded one of the Frisbee Throwing Distance items as “50m” rather than just “50”, this would be a good time to make a correction.
Once you have got your worksheet straight, you can open up SPSS.
There are a number of different ways to import data into SPSS. We’re going to use a method that allows backward compatibility with older versions of SPSS.
To start, click File -> Open -> Data (as below).
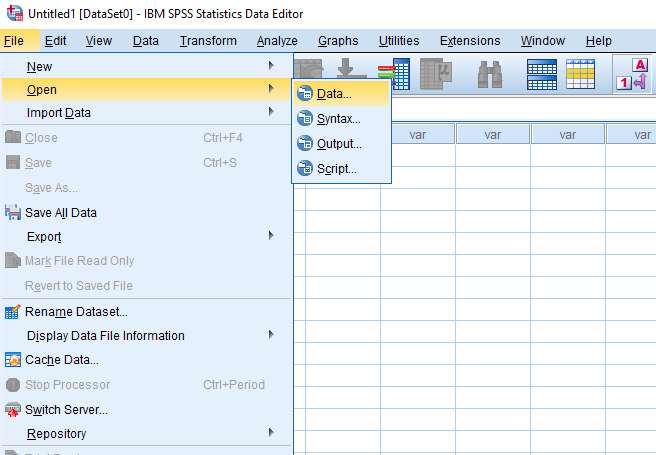
Once you click Data, the Open Data box will appear.
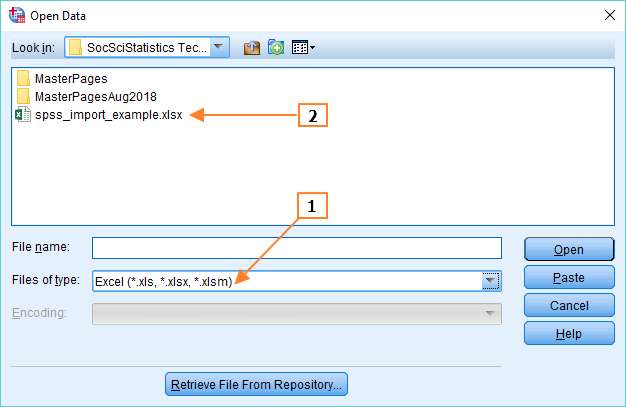
In the Files of type box, you need to select Excel (see 1 above, though obviously things will look slightly different if you’re using a Mac). Then navigate to the folder that contains your Excel file, and you’ll see your Excel file pop up (see 2 above). Open the file, and you’ll get the Read Excel File dialog box.
Read Excel File Dialog Box
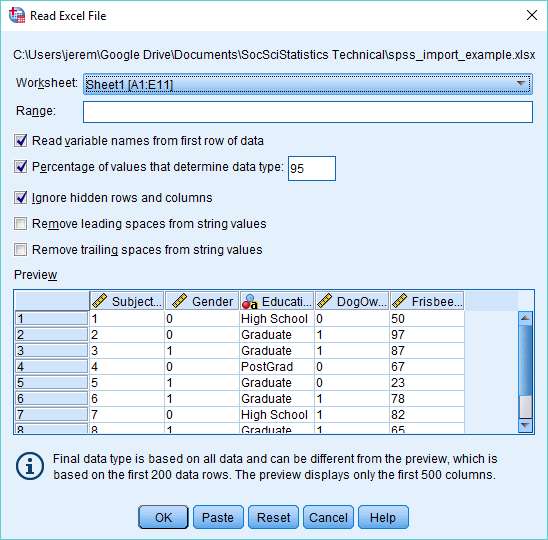
This dialog box offers a number of options. Mainly these are self-explanatory, but it is probably worth explaining the “Percentage of values that determine data type” option. This is how the latest version of SPSS assigns a data type to your variables. The percentage is the proportion of values in a particular column that must match a specific data type for SPSS to assign that data type to a variable. In our example, a variable will be assigned to a particular data type if 95% of values match that type (for example, if 95% of values are numeric in form). The value can be any number above 50. If SPSS is unable to determine a data type on this basis it will assign the variable to a string type.
Once you’ve selected the options you require, and checked your data looks okay in the preview window, press OK to begin the import.
Check Your Data Within SPSS
SPSS will import your data into a new Data View with variable names at the top.
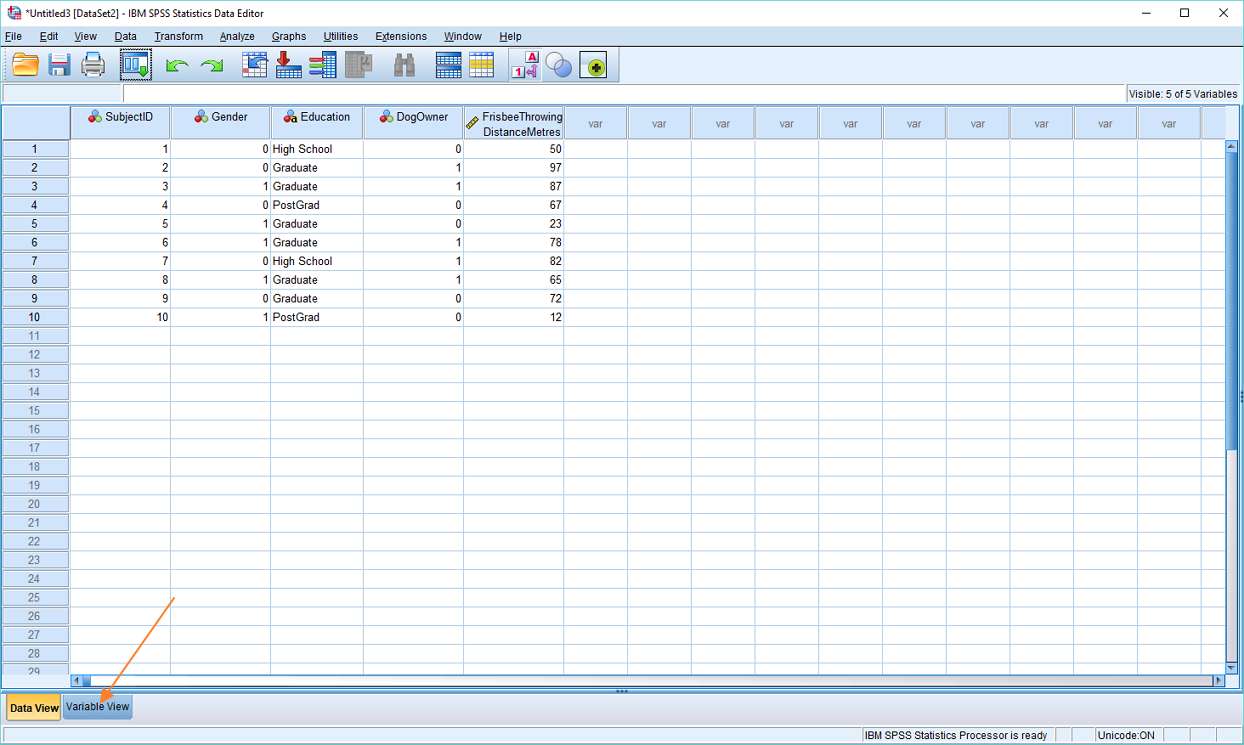
Obviously, the first thing to do here is to check that the data has come across successfully. If everything looks okay, the next stage is to check whether the various data parameters have been set correctly. Is numerical data correctly set as numerical, for example?
To check this, click on the Variable View tab (see red arrow, above). This will bring up the variable view within SPSS.
Variable View
As you can see from the image below, SPSS did a good job with our sample data, correctly identifying SubjectID, Gender, DogOwner and FrisbeeThrowing as data type numeric, and Education as data type string.
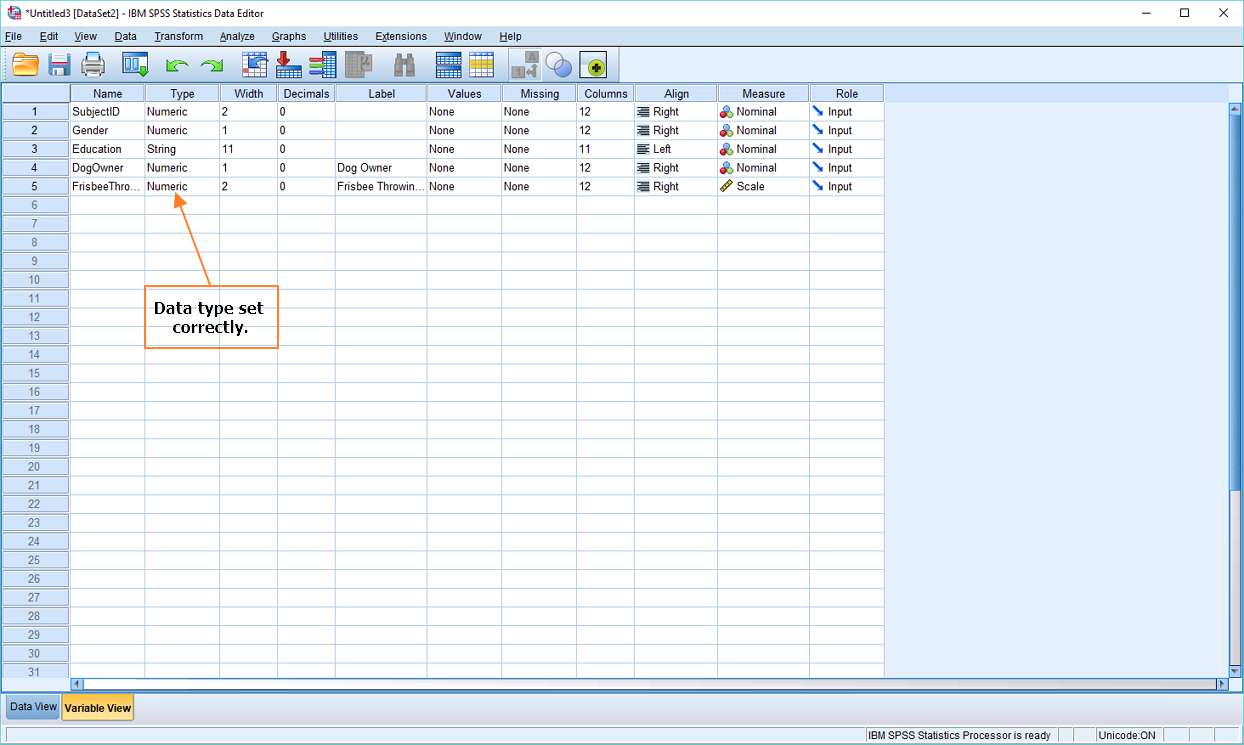
It also got level of measurement correct (see the Measure column), identifying SubjectID, Gender, Education and DogOwner as nominal data, and FrisbeeThrowing as scale (that is, as interval/ratio data).
***************
That’s pretty much it for this tutorial. You should now have a good idea of how to import data from Excel into the SPSS statistics package.
***************
EZSPSS on YouTube
We have a video tutorial that covers this same material in slightly more detail. Check it out!
Содержание
- Importing Data into SPSS from Excel
- Preparing Excel
- Importing Data from Excel into SPSS
- Read Excel File Dialog Box
- Check Your Data Within SPSS
- Variable View
- EZSPSS on YouTube
- Opening Excel Files in SPSS
- Open Excel File with Values in SPSS
- Result
- Apply Variable Labels from Excel
- Apply Value Labels from Excel
- Open Excel Files with Strings in SPSS
- Result
- Shortening Variable Names
- Converting String Variables from Excel
- Converting Ordinal String Variables
- Tell us what you think!
- THIS TUTORIAL HAS 2 COMMENTS:
- By Jon peck on March 29th, 2022
- Using Excel to Write SPSS Syntax
Importing Data into SPSS from Excel
This tutorial explains how to import data from Excel into the SPSS statistics package.
Preparing Excel
Open the Excel spreadsheet from which you wish to import data.
You can see in our example that we have 5 columns of data.
Before you begin the process of importing your data into SPSS, you need to ensure that your variable names are in the first row of the worksheet, and that there is no gap between the first and second rows. Our worksheet satisfies both these requirements.
It’s also wise to clean up your data. For example, if you had coded one of the Frisbee Throwing Distance items as “50m” rather than just “50”, this would be a good time to make a correction.
Once you have got your worksheet straight, you can open up SPSS.
Importing Data from Excel into SPSS
There are a number of different ways to import data into SPSS. We’re going to use a method that allows backward compatibility with older versions of SPSS.
To start, click File -> Open -> Data (as below).
Once you click Data, the Open Data box will appear.
In the Files of type box, you need to select Excel (see 1 above, though obviously things will look slightly different if you’re using a Mac). Then navigate to the folder that contains your Excel file, and you’ll see your Excel file pop up (see 2 above). Open the file, and you’ll get the Read Excel File dialog box.
Read Excel File Dialog Box
This dialog box offers a number of options. Mainly these are self-explanatory, but it is probably worth explaining the “Percentage of values that determine data type” option. This is how the latest version of SPSS assigns a data type to your variables. The percentage is the proportion of values in a particular column that must match a specific data type for SPSS to assign that data type to a variable. In our example, a variable will be assigned to a particular data type if 95% of values match that type (for example, if 95% of values are numeric in form). The value can be any number above 50. If SPSS is unable to determine a data type on this basis it will assign the variable to a string type.
Once you’ve selected the options you require, and checked your data looks okay in the preview window, press OK to begin the import.
Check Your Data Within SPSS
SPSS will import your data into a new Data View with variable names at the top.
Obviously, the first thing to do here is to check that the data has come across successfully. If everything looks okay, the next stage is to check whether the various data parameters have been set correctly. Is numerical data correctly set as numerical, for example?
To check this, click on the Variable View tab (see red arrow, above). This will bring up the variable view within SPSS.
Variable View
As you can see from the image below, SPSS did a good job with our sample data, correctly identifying SubjectID, Gender, DogOwner and FrisbeeThrowing as data type numeric, and Education as data type string.
It also got level of measurement correct (see the Measure column), identifying SubjectID, Gender, Education and DogOwner as nominal data, and FrisbeeThrowing as scale (that is, as interval/ratio data).
That’s pretty much it for this tutorial. You should now have a good idea of how to import data from Excel into the SPSS statistics package.
EZSPSS on YouTube
We have a video tutorial that covers this same material in slightly more detail. Check it out!
Источник
Opening Excel Files in SPSS
Excel files containing social sciences data mostly come in 2 basic types:
- files containing data values (1, 2, . ) and variable names (v01, v02, . ) and separate sheets on what the data represents as shown in course-evaluation-values.xlsx;
- files containg answer categories (“Good”, “Bad”, . ) and question descriptions (“How did you find. ”) as in course-evaluation-labels.xlsx.
Just opening either file in SPSS is simple. However, preparing the data for analyses may be challenging. This tutorial quickly walks you through.
Open Excel File with Values in SPSS
Let’s first fix course-evaluation-values.xlsx, partly shown below.
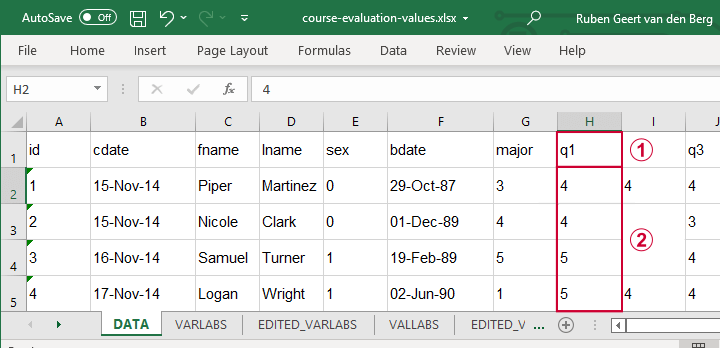
 The data sheet has short variable names whose descriptions are in another sheet, VARLABS (short for “variable labels”);
 Answer categories are represented by numbers whose descriptions are in VALLABS (short for “value labels”).
Please enable JavaScript
Let’s first simply open our actual data sheet in SPSS by navigating to File ![]() Import Data
Import Data ![]() Excel as shown below.
Excel as shown below.
Next up, fill out the dialogs as shown below. Tip: you can also open these dialogs if you drag & drop an Excel file into an SPSS Data Editor window.
By default, SPSS converts Excel columns to numeric variables if at least 95% of their values are numbers. Other values are converted to system missing values without telling you which or how many values have disappeared. This is very risky but we can prevent this by setting it to 100.
Completing these steps results in the SPSS syntax shown below.
Result
As shown, our actual data are now in SPSS. However, we still need to add their labels from the other Excel sheets. Let’s start off with variable labels.
Apply Variable Labels from Excel
A quick and easy way for setting variable labels is creating SPSS syntax with Excel formulas: we basically add single quotes around each label and precede it with the variable name as shown below.
If we use single quotes around labels, we need to replace single quotes within labels by 2 single quotes.
Finally, we simply copy-paste these cells into a syntax window, precede it with VARIABLE LABELS and end the final line with a period. The syntax below shows the first couple of lines thus created.
Apply Value Labels from Excel
We’ll now set value labels with the same basic trick. The Excel formulas are a bit harder this time but still pretty doable.
Let’s copy-paste column E into an SPSS syntax window and add VALUE LABELS and a period to it. The syntax below shows the first couple of lines.
After running these lines, we’re pretty much done with this file. Quick note: if you need to convert many Excel files, you could automate this process with a simple Python script.
Open Excel Files with Strings in SPSS
Let’s now convert course-evaluation-labels.xlsx, partly shown below.
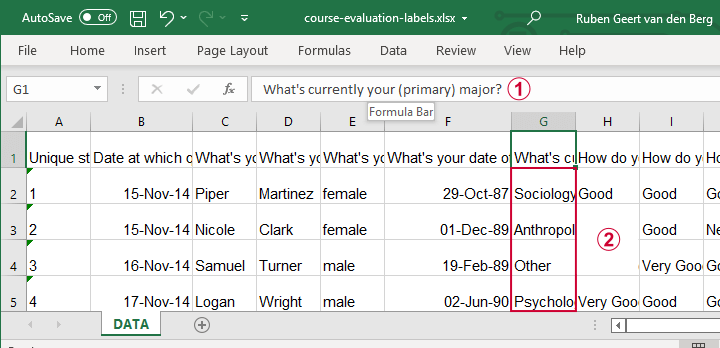
Note that the Excel column headers are full question descriptions;
the Excel cells contain the actual answer categories.
Let’s first open this Excel sheet in SPSS. We’ll do so with the exact same steps as in Open Excel File with Values in SPSS, resulting in the syntax below.
Result
This Excel sheet results in huge variable names in SPSS;
most Excel columns have become string variables in SPSS.
Let’s now fix both issues.
Shortening Variable Names
I strongly recommend using short variable names. You can set these with RENAME VARIABLES (ALL = V01 TO V13). Before doing so, make sure all variables have decent variable labels. If some are empty, I often set their variable names as labels. That’s usually all information we have from the Excel column headers.
A simple little Python script for doing so is shown below.
Converting String Variables from Excel
So how to convert our string variables to numeric ones? This depends on what’s in these variables:
- for quantitative string variables containing numbers, try ALTER TYPE;
- for nominal answer categories, try AUTORECODE;
- for ordinal answer categories, use RECODE or try AUTORECODE and then adjust their order.
For example, the syntax below converts “id” to numeric.
*CONVERT V01 TO NUMERIC.
alter type v01 (f8).
*CHECK FOR SYSTEM MISSING VALUES AFTER CONVERSION.
descriptives v01.
*SET COLUMN WIDTH SOMEWHAT WIDER FOR V01.
variable width v01 (6).
*AND SO ON.
Just as the Excel-SPSS conversion, ALTER TYPE may result in values disappearing without any warning or error as explained in SPSS ALTER TYPE Reporting Wrong Values?
If your converted variable doesn’t have any system missing values, then this problem has not occurred. However, if you do see some system missing values, you’d better find out why these occur before proceeding.
Converting Ordinal String Variables
The easy way to convert ordinal string variables to numeric ones is to
- AUTORECODE them and
- adjust the order of the answer categories.
We thoroughly covered this method SPSS — Recode with Value Labels Tool (example II). Do look it up and try it. It may save you a lot of time and effort.
If you’re somehow not able to use this method, a basic RECODE does the job too as shown below.
*RECODE STRING VALUES TO NUMBERS.
recode v08 to v13
(‘Very bad’ = 1)
(‘Bad’ = 2)
(‘Neutral’ = 3)
(‘Good’ = 4)
(‘Very Good’ = 5)
into n08 to n13.
*SET VALUE LABELS.
value labels n08 to n13
1 ‘Very bad’
2 ‘Bad’
3 ‘Neutral’
4 ‘Good’
5 ‘Very Good’.
*SET VARIABLE LABELS.
variable labels
n08 ‘How do you rate this course?’
n09 ‘How do you rate the teacher of this course?’
n10 ‘How do you rate the lectures of this course?’
n11 ‘How do you rate the assignments of this course?’
n12 ‘How do you rate the learning resources (such as syllabi and handouts) that were issued by us?’
n13 ‘How do you rate the learning resources (such as books) that were not issued by us?’.
Keep in mind that writing such syntax sure sucks.
So that’s about it for today. If you’ve any questions or remarks, throw me a comment below.
Thanks for reading!
Tell us what you think!
By Jon peck on March 29th, 2022
The STATS VALLBLS FROMDATA extension command can be helpful in creating the value labels.
Источник
Using Excel to Write SPSS Syntax
IBM SPSS Statistics and Microsoft Excel are the tools perfectly complementing each other. We use Excel files for import and export data to/from SPSS, export end editing SPSS output. In this post we consider a small hint actively used by some SPSS users to automate syntax developing with the help of Excel.
It happens quite often that you’ve got a metadata (data describing the data, like labels, bounds for categorization, etc.) in a structured form in Excel. Suppose, you need to write a syntax which exploits this metadata in its specification. I.e., you need to “wrap” Excel file contents into SPSS syntax. Here are some cases of this kind:
- Excel contains list of variable names and list of variable labels. Need to create syntax to assign labels to corresponding variables, i.e. VARIABLE LABELS syntax;
- Excel contains old and new variable names. Need to create syntax to rename variables in a dataset;
- Excel contains values of a categorical variable and value labels. Need to assign labels to values via syntax ( VALUE LABELS command);
- Excel contains list of ranges (boundaries) to categorize some continuous variable, corresponding categories’ values, and labels. Need to develop a syntax to compute and describe new categorical variable based on specified ranges.
How can one solve these tasks? The first impulse might be simply to paste data from Excel to SPSS Syntax Editor and “convert” it to the syntax manually. But with numerous variables, values or rules to process, it might be tedious to wrap it manually line by line with appropriate formatting (slashes, quotes, instructions and keywords) to get the desired valid syntax.
Happily, with help of concatenation function in Excel one can automate syntax creation, so that almost no manual parsing will be required. Next example shows how the single =CONCATENATE() function helps us to assign labels to the long list (hundreds or thousands) of values. The example is made up from the syntax of assigning labels (names) to US counties’ FIPS codes, see the original syntax here: http://spsstools.net/en/syntax/syntax-index/standard-data-files/create-labels-with-common-names-for-us-county-fips-codes/). How could we end up with such syntax if start with lists of FIPS codes and county names in Excel file of the following form?
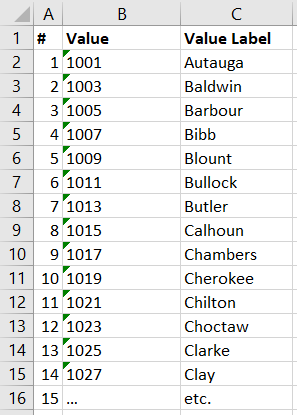
Figure 1. Value labels (original metadata) in Excel sheet
Let’s say FIPS codes are stored in county variable in SPSS. It would be a string variable, as we need to keep leading zeros. Here how the target SPSS syntax should look like:
To quickly create the “core” of this syntax, let’s place to the next column ( D ) in Excel the following formula:
(you may notice at the screenshot below the name of this function in Russian =СЦЕПИТЬ() as I didn’t find how to avoid this in localized Excel interface)
The meaning of this formula is to create a new string, by concatenation of the following pieces:
- 4 spaces (this is not really necessary, just for visual indent to make syntax look prettier).
- Single quote. Note that spaces and the quote are all quoted in double quotes to ensure Excel treat them as a string value.
- Code value from B2 cell.
- Single quote, then space, and another single quote. To SPSS that will mean as closing quotation of code value and starting quotation of the corresponding county name.
- The content of the C2 value (county name).
- Finally, another single quote, to end the specification of the label.
Note that we separate concatenated portions with semicolon, according to Excel functions’ arguments specification.
As we finished with specification of the formula in D2 cell, the following result appears:
We need now to drag formula to the last used row in Excel sheet. This could be done quickly, regardless of how many such labels or names we have. Excel will automatically substitute cell references in the formula while coping it. The result will be like this:
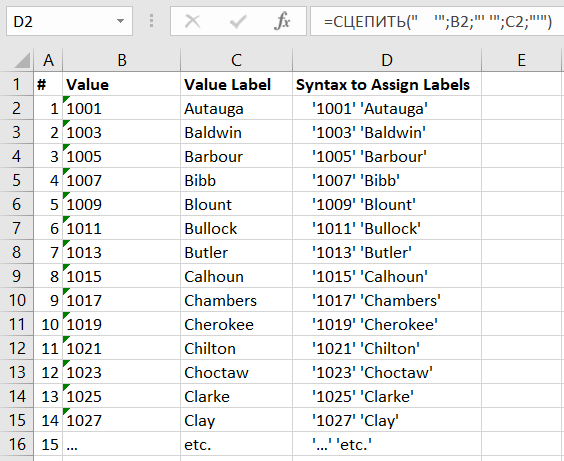
Figure 2. Original value labels in Excel sheet wrapped to the SPSS syntax definitions of value labels with help of CONCATENATE formula
Now copy all the created rows from column D (starting with the second row), and paste them into SPSS Syntax Editor.
Prepend pasted code with VALUE LABELS county string (ensure you don’t have extra line between VALUE LABELS county and lines with codes.
Postpend pasted code with dot ( . ) to end syntax command properly. Now your VALUE LABELS command is ready to run. Again, here how the final command should look like:
After running this command you may check the values were correctly assigned to the target variable:
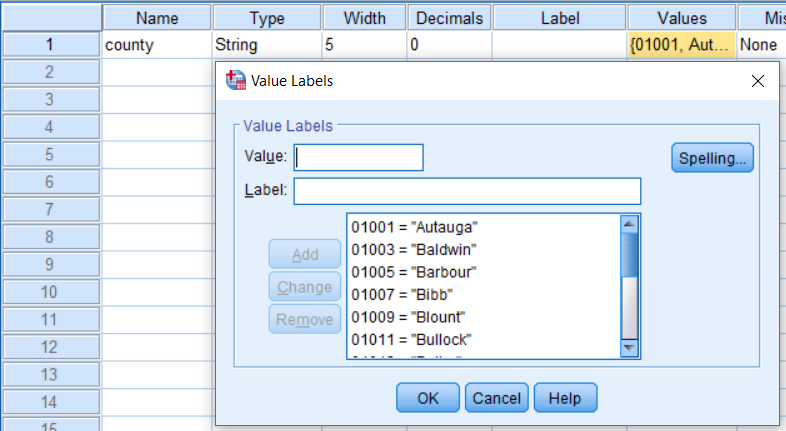
Figure 3. Value labels declared in Data Editor of SPSS (Variable View)
- We have started with some metadata, organized in a structured way in Excel.
- We have demonstrated how to create valid syntax from this metadata with help of Excel functions (here we used =CONCATENATE() , but you may encounter situations where it might be useful to utilize other functions as well)
- There are 3 steps to reach it: 1 – enter formula to create syntax portion from one row, 2 – drag the formula to create syntax for remaining rows, and 3 – paste the resulting rows to SPSS, optionally prepending and/or postpending them to make SPSS command syntax finished.
The bonus to this “Excel-powered” approach of syntax development is the nice “interface” or codebook to edit the syntax. Changing any variable name, value or label in Excel data will update the result of concatenation formula. So that you’ll have the ready updated syntax to paste into SPSS right after making any modification to metadata. —
Источник
- Open Excel File with Values in SPSS
- Apply Variable Labels from Excel
- Apply Value Labels from Excel
- Open Excel Files with Strings in SPSS
- Converting String Variables from Excel
Excel files containing social sciences data mostly come in 2 basic types:
- files containing data values (1, 2, …) and variable names (v01, v02, …) and separate sheets on what the data represents as shown in course-evaluation-values.xlsx;
- files containg answer categories (“Good”, “Bad”, …) and question descriptions (“How did you find…”) as in course-evaluation-labels.xlsx.
Just opening either file in SPSS is simple. However, preparing the data for analyses may be challenging. This tutorial quickly walks you through.
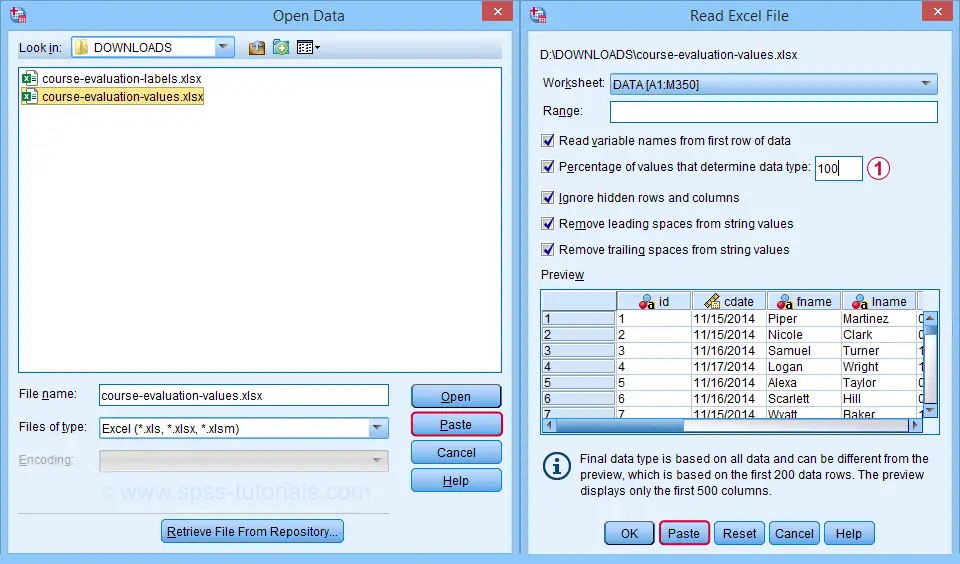
Open Excel File with Values in SPSS
Let’s first fix course-evaluation-values.xlsx, partly shown below.
 The data sheet has short variable names whose descriptions are in another sheet, VARLABS (short for “variable labels”);
 Answer categories are represented by numbers whose descriptions are in VALLABS (short for “value labels”).
Let’s first simply open our actual data sheet in SPSS by navigating to
as shown below.
Next up, fill out the dialogs as shown below. Tip: you can also open these dialogs if you drag & drop an Excel file into an SPSS Data Editor window.
By default, SPSS converts Excel columns to numeric variables if at least 95% of their values are numbers. Other values are converted to system missing values without telling you which or how many values have disappeared. This is very risky but we can prevent this by setting it to 100.
Completing these steps results in the SPSS syntax shown below.
*IMPORT EXCEL FILE.
GET DATA
/TYPE=XLSX
/FILE=’D:datacourse-evaluation-values.xlsx’
/SHEET=name ‘DATA’
/CELLRANGE=FULL
/READNAMES=ON
/LEADINGSPACES IGNORE=YES
/TRAILINGSPACES IGNORE=YES
/DATATYPEMIN PERCENTAGE=100.0
/HIDDEN IGNORE=YES.
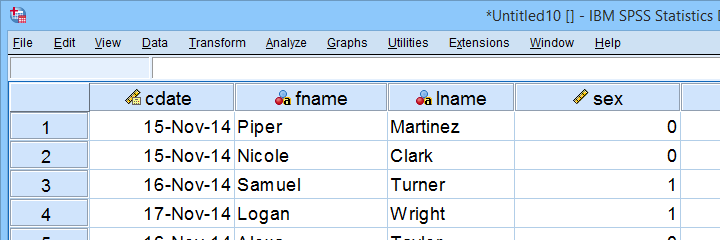
Result
As shown, our actual data are now in SPSS. However, we still need to add their labels from the other Excel sheets. Let’s start off with variable labels.
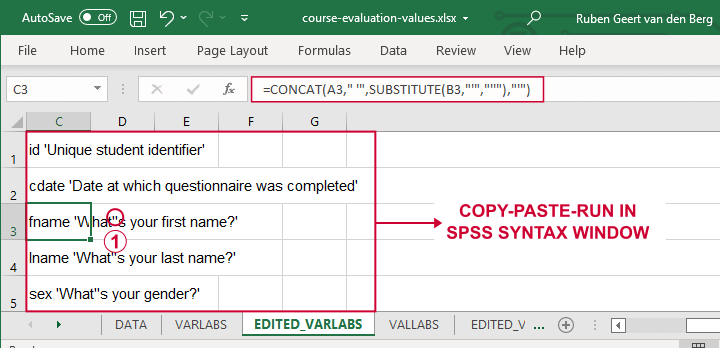
Apply Variable Labels from Excel
A quick and easy way for setting variable labels is creating SPSS syntax with Excel formulas: we basically add single quotes around each label and precede it with the variable name as shown below.
If we use single quotes around labels, we need to replace single quotes within labels by 2 single quotes.
Finally, we simply copy-paste these cells into a syntax window, precede it with VARIABLE LABELS and end the final line with a period. The syntax below shows the first couple of lines thus created.
*VARIABLE LABELS SYNTAX — MOSTLY COPY-PASTED FROM EXCEL FORMULAS.
variable labels
id ‘Unique student identifier’
cdate ‘Date at which questionnaire was completed’.
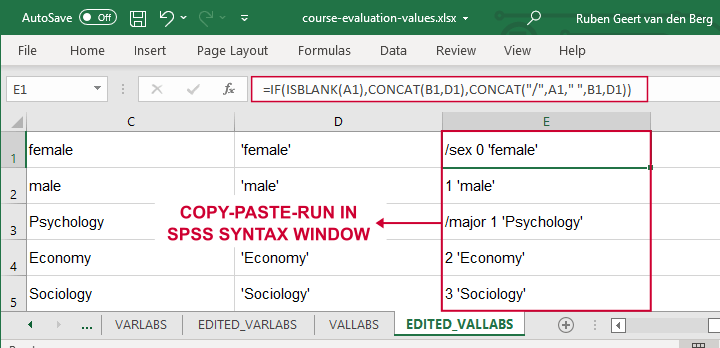
Apply Value Labels from Excel
We’ll now set value labels with the same basic trick. The Excel formulas are a bit harder this time but still pretty doable.
Let’s copy-paste column E into an SPSS syntax window and add VALUE LABELS and a period to it. The syntax below shows the first couple of lines.
*VALUE LABELS SYNTAX — MOSTLY COPY-PASTED FROM EXCEL FORMULAS.
value labels
/sex 0 ‘female’
1 ‘male’
/major 1 ‘Psychology’
2 ‘Economy’
3 ‘Sociology’
4 ‘Anthropology’
5 ‘Other’.
After running these lines, we’re pretty much done with this file. Quick note: if you need to convert many Excel files, you could automate this process with a simple Python script.
Open Excel Files with Strings in SPSS
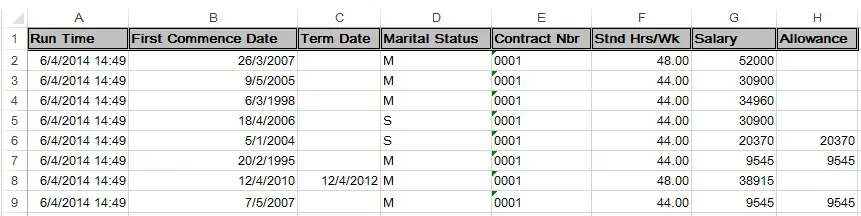
Let’s now convert course-evaluation-labels.xlsx, partly shown below.
Note that the Excel column headers are full question descriptions;
the Excel cells contain the actual answer categories.
Let’s first open this Excel sheet in SPSS. We’ll do so with the exact same steps as in Open Excel File with Values in SPSS, resulting in the syntax below.
*IMPORT EXCEL FILE.
GET DATA
/TYPE=XLSX
/FILE=’d:/data/course-evaluation-labels.xlsx’
/SHEET=name ‘DATA’
/CELLRANGE=FULL
/READNAMES=ON
/LEADINGSPACES IGNORE=YES
/TRAILINGSPACES IGNORE=YES
/DATATYPEMIN PERCENTAGE=100.0
/HIDDEN IGNORE=YES.
Result
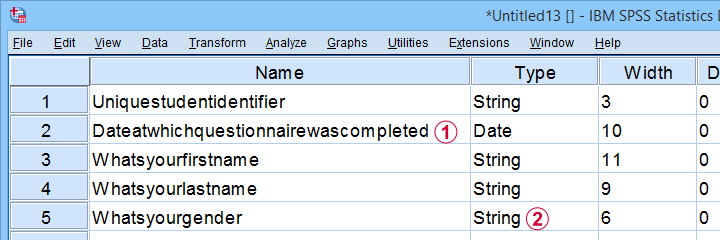
This Excel sheet results in huge variable names in SPSS;
most Excel columns have become string variables in SPSS.
Let’s now fix both issues.
Shortening Variable Names
I strongly recommend using short variable names. You can set these with
RENAME VARIABLES (ALL = V01 TO V13).
Before doing so, make sure all variables have decent variable labels. If some are empty, I often set their variable names as labels. That’s usually all information we have from the Excel column headers.
A simple little Python script for doing so is shown below.
*SET VARIABLE NAMES AS VARIABLE LABELS IF THEY ARE EMPTY.
begin program python3.
import spss
spssSyn = »
for i in range(spss.GetVariableCount()):
varlab = spss.GetVariableLabel(i)
if not varlab:
varnam = spss.GetVariableName(i)
if not spssSyn:
spssSyn = ‘VARIABLE LABELS’
spssSyn += «n%(varnam)s ‘%(varnam)s'»%locals()
if spssSyn:
print(spssSyn)
spss.Submit(spssSyn + ‘.’)
end program.
Converting String Variables from Excel
So how to convert our string variables to numeric ones? This depends on what’s in these variables:
- for quantitative string variables containing numbers, try ALTER TYPE;
- for nominal answer categories, try AUTORECODE;
- for ordinal answer categories, use RECODE or try AUTORECODE and then adjust their order.
For example, the syntax below converts “id” to numeric.
*CONVERT V01 TO NUMERIC.
alter type v01 (f8).
*CHECK FOR SYSTEM MISSING VALUES AFTER CONVERSION.
descriptives v01.
*SET COLUMN WIDTH SOMEWHAT WIDER FOR V01.
variable width v01 (6).
*AND SO ON…
Just as the Excel-SPSS conversion, ALTER TYPE may result in values disappearing without any warning or error as explained in SPSS ALTER TYPE Reporting Wrong Values?
If your converted variable doesn’t have any system missing values, then this problem has not occurred. However, if you do see some system missing values, you’d better find out why these occur before proceeding.
Converting Ordinal String Variables
The easy way to convert ordinal string variables to numeric ones is to
- AUTORECODE them and
- adjust the order of the answer categories.
We thoroughly covered this method SPSS — Recode with Value Labels Tool (example II). Do look it up and try it. It may save you a lot of time and effort.
If you’re somehow not able to use this method, a basic RECODE does the job too as shown below.
*RECODE STRING VALUES TO NUMBERS.
recode v08 to v13
(‘Very bad’ = 1)
(‘Bad’ = 2)
(‘Neutral’ = 3)
(‘Good’ = 4)
(‘Very Good’ = 5)
into n08 to n13.
*SET VALUE LABELS.
value labels n08 to n13
1 ‘Very bad’
2 ‘Bad’
3 ‘Neutral’
4 ‘Good’
5 ‘Very Good’.
*SET VARIABLE LABELS.
variable labels
n08 ‘How do you rate this course?’
n09 ‘How do you rate the teacher of this course?’
n10 ‘How do you rate the lectures of this course?’
n11 ‘How do you rate the assignments of this course?’
n12 ‘How do you rate the learning resources (such as syllabi and handouts) that were issued by us?’
n13 ‘How do you rate the learning resources (such as books) that were not issued by us?’.
Keep in mind that writing such syntax sure sucks.
So that’s about it for today. If you’ve any questions or remarks, throw me a comment below.
Thanks for reading!
Importing Excel Databases Into SPSS
To import an Excel file into SPSS, use the following steps:
- Open SPSS.
- Click on File on the menu bar. Select Open Database and then New Query.

- This will open the SPSS Database Wizard. Select Excel Files from the selection window and click on Next.

- In the ODBC Driver Login window, click on the Browse button.

- Find the appropriate database file and click on the Open button.

- Click OK to the ODBC Driver Login window.
- In the Select Data window, click and drag the appropriate tables from the Available Tables box to the Retrieve Fields In This Order box.
Click Next once all the tables are selected and in the appropriate order.
- This will bring you to the Limit Retrieved Cases window, where you can assign certain conditions to table variables. Fields and functions can be added to an expression by dragging and dropping into an expression cell.
Click on Next once you complete this window.
- This will bring you to the Define Variables window, where you can name the variables in the new SPSS file. Otherwise, SPSS will use the default names of the variables.
Click Next once you complete this window.
- This will bring you to the SQL Query window, where you edit the SQL query string in the editor window.
Click Finish once you complete this window. The Excel file is now open in SPSS.


This SPSS tutorial explains how to import Excel into SPSS.
It is easy to import Excel into SPSS but you should note that SPSS will automatically define each variable, some of them can be correct and some incorrect (this is very similar to Microsoft Access). In this tutorial, I will demonstrate how to import Excel into SPSS and how SPSS guesses the variable types, I will try too cover the most common scenario.
Lets say we have the following table in Excel, which contains time stamp, date, date with blank records, text, number in text format, number with 2 decimal places, integer, integer with blank records.
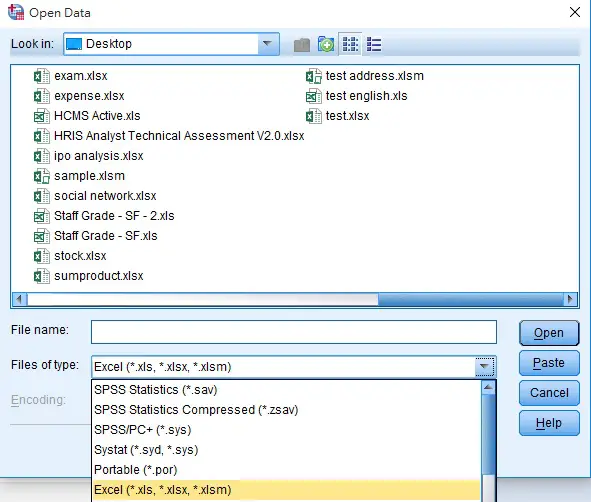
Open SPSS, navigate to File > Open > Data
The name “Open” is confusing. In fact it is not open, it is import. Any change you made in SPSS is in SPSS, it does not modify the actual Excel file.

Under “Files of type”, select Excel, then choose the workbook you want to import
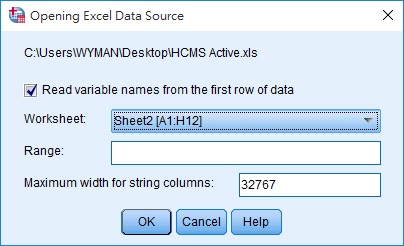
Select the worksheet to be imported > OK
After the worksheet is successfully imported, the Variable View pops up.
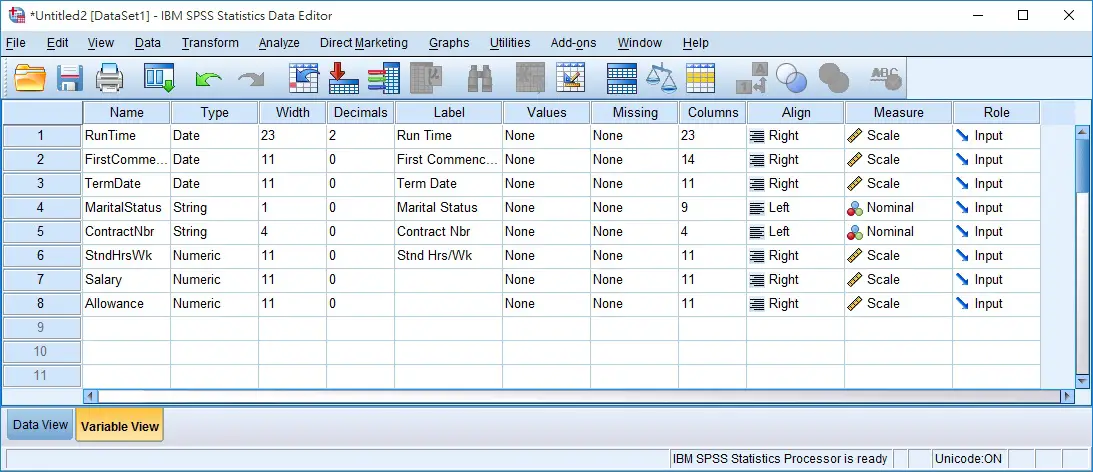
Switch to Data View to have a look
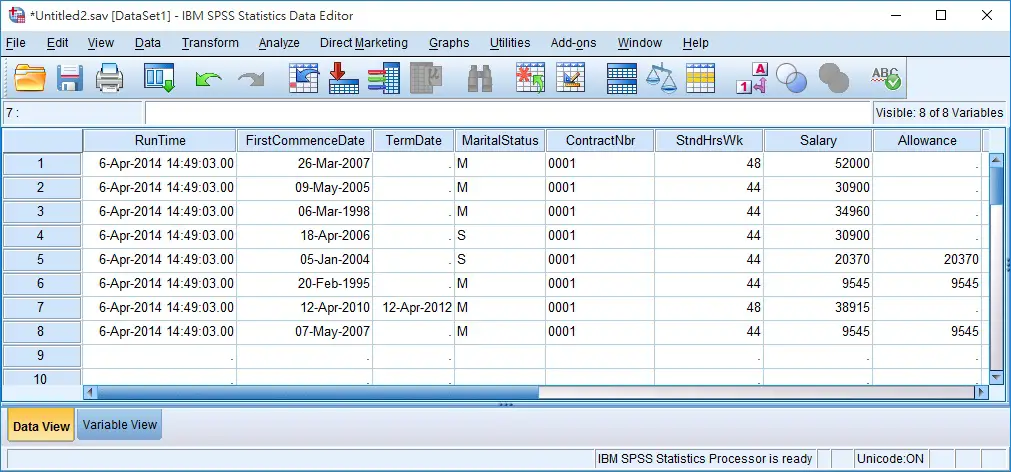
Lets compare them with the data we originally imported.
Here are some observations of the import.
- All Type (numeric / date / string) are correctly converted even though there are some blank fields on the top (which means SPSS does look through all data in the field to make the guess, instead of just looking at the few cells on top)
- All Measure (scale / nominal) are correctly converted, except ordinal data where manual correction is required
- Invalid Excel column names such as spacing are removed and convert in Name column
- Date / number format in Excel are not converted into SPSS, manual correction in Variable View is required
In conclusion, after importing Excel into SPSS, while the overall data quality is good, you still need to check carefully whether the fields are converted correctly.
Outbound References
http://libguides.library.kent.edu/SPSS/ImportData