
In surveys about the most-used tool for data analysis Excel always comes in as one of the most commonly used tools . It is taught in schools and used by countless companies. What you may not know, however, is that anything you can do with Excel you can also do using the nodes in KNIME Analytics Platform! This post is dedicated to getting you started if you already use Excel and want to migrate to KNIME Analytics Platform.

We will be using historical weather data from Berlin. These measurements can be downloaded from the Deutsche Wetterdienst. To be more specific, we took most recent measurements from the «Berlin-Tempelhof» weather station, from September 2014 to January 2016.
Before we proceed: one short disclaimer. Here we describe only some of the possible options; both tools offer more and there is usually a variety of solutions for the same task.
To get started the file needs to be read by the respective tool.
In Excel: Rename the file to *.csv and double-click it to open it. Excel automatically detects the columns and their types.
In KNIME Analytics Platform: Create a new workflow, select the file and move it to the workflow by Drag&Drop. A «File Reader» will appear, showing the following dialog. Please make sure you select «read column headers» and specify “semicolon” as the column delimiter. The «File Reader» now automatically detects the columns and their types.

One of the first things you might want to do are basic aggregations or statistics of your values. Examples of such Excel functions are SUM, MAX, MIN, AVERAGE and COUNT. They are all covered by the «GroupBy» node. To calculate them on the full column, leave the Group columns empty and select the following aggregations methods: Sum for SUM, Maximum for MAX, Minimum for MIN, Mean for Average and Count for COUNT as shown in the configuration dialog. If you want to apply these calculations to only some of the values, you might want to filter the table before, using the «Row Filter» or the «Rule-Based Row Filter» node.

You can achieve the same aggregations with the «Statistics» node. Connect it to the «File Reader», execute it and open the second outport. It contains the Overall Sum, the Min, the Max and the Mean of all numerical columns.

The three nodes in the workflow above are used to read the file and calculate the statistics.

Up next is how to calculate the average temperature per month. First we need to convert MESS_DATUM into a date. The format of the date is yyyymmdd (e.g. 20160116 stands for january 16, 2016). In Excel use the Text to Columns function (in the Data tab). Go to the third step of the «Convert Text to Columns Wizard» and select «YMD» for the column. In KNIME Analytics Platform, the node «String to Date/Time» converts the date into the correct Date and TimeCell, with the Date format: «yyyyMMdd». In the KNIME platform, the date format can be set to your specific needs, while Excel provides only a number of predefined formats.
To find the month for the date, the Excel function «MONTH» returns it as a number. The corresponding KNIME node is the «Date Field Extractor». It also covers the following Excel functions: DAY, YEAR, WEEKNUM. The partnering node «Time Field Extractor» covers the extraction of time values as HOUR, MINUTE, SECOND.

The NOW function returns the current date and time in Excel. Using the «Time Generator» node the current date and time can also be generated in KNIME Analytics Platform. Configure it to generate one row only and check the «Use execution time as starting time» box. In case you want to achieve the current date only, like the Excel function “today”, deactivate the «Use Time» checkbox. A small hint here, if you want to append this value to all rows of your data table, use the «Cross Joiner» node to combine them. Wrapping up: the Excel Today function is generated in the KNIME platform with the «Time Generator» node configured as below.

And now back to our final task of calculating the mean temperature per month: In Excel we need a new mini table containing all the months. We can then calculate the average per month by applying the AVERAGEIF function as shown in the screenshot below.

In KNIME Analytics Platform the «GroupBy» node is used for the calculations. Select the Month column under Groups and the Mean of the LUFTTEMPERATUR column under Manual aggregations. Similarly, those nodes can also be used for COUNTIF(S) or AVERAGEIF(S).
Afterwards, you might want to use the «Round Double» node for rounding. It covers the following Excel functions: ROUND, CEILING, FLOOR.MATH, ROUNDDOWN, ROUNDUP, FLOOR, and INT. The same functions are also covered by the «Math Formula» node.
The following workflow demonstrates how the mean temperature per month is calculated and rounded.

What we want the weather channel to give us most is obviously a forecast for nice weather! This always depends on multiple criteria. To create the relevant rules, Excel offers the logical functions of AND, OR, NOT or TRUE. In the KNIME Analytics Platform these kinds of functions can be found in the «Rule Engine» node.

Another node that helps you get started with the migration to KNIME Analytics Platform is the «String Manipulation» node. It covers the Text functions category in Excel. Of course the function names are not exactly the same, but here is a list to get you started for converting your strings: BAHTTEXT converts a number into a string, which is completed by the string function in the KNIME platform. PROPER converts the first letter of a word to uppercase and this is done with the capitalize function in KNIME Analytics Platform. The KNIME version of CONCATENATE is the join function. LEFT and RIGHT extract the first and respectively last k letters of the string. The «String Manipulation» node can cover this with one function only. substr(k) gives you the first k letters while substr(length-k) gives you the last k of the string.
The last function for migrating from Excel to KNIME Analytics Platform is VLOOKUP, which is one of the most commonly used functions. The use-case is that we want to add more information to our list of months with average temperatures. VLOOKUP can be used to search for a key in another column and insert the value of the same row but from a different column. In KNIME Analytics Platform this concept refers to the «Joiner» node. The Lookup_values are the Joining Columns while the Col_index_num can be configured to select which columns should be included. This is specified in the second tab of the «Joiner» dialog.
The last snippet of the workflow shows how the Today function and the VLOOKUP can be realized in the KNIME Analytics Platform. The complete workflow can be downloaded from the resources section at the end of the page.

Last but not least, KNIME Analytics Platform offers dedicated nodes for reading and writing your existing xls(x) files. These nodes can be found in the «KNIME XLS Support» extension. And if you find an Excel function you can’t migrate yourself, let us know and we show you how.
PS: Do you want to know what the weather will be like in Berlin at the end of February? Join us at the KNIME Spring summit in Berlin and find out more about KNIME Analytics Platform.
Links and References:
- DataSet
Requirements:
-
Extensions: KNIME XLS Support and KNIME Math Expression (JEP)
What are you looking for?
Analyze your Microsoft Excel data in KNIME
Getting your data from Microsoft Excel to KNIME can be a pain. Managing pipelines for all your data sources just isn’t sustainable, but your reporting can’t be put on hold while you wait for IT or Engineering to get to your ticket.
With Panoply, you can eliminate that hassle—and all that wasted time. Set up code-free connections to both Microsoft Excel and KNIME with just a few clicks. Then Panoply will automatically sync your data so it’s ready to analyze when you are.
It’s that simple: Unblock your data with Panoply.
Try Panoply Free
How it works
Query-ready data with just a few clicks
Seamlessly update all your KNIME reports and dashboards without lifting a finger. Set it up in minutes, then let Panoply handle the rest.
Try Panoply Free
Code-free data pipeline
Easily connect Microsoft Excel and all your other data sources with automated integrations that take pipeline management off your to-do list.
See all data source integrations
![]()
Fuel your analytics
Power BI and analytical tools like KNIME with fresh data so your whole team can discover insights that drive your business forward.
See all BI tool integrations
![]()
Integrate with Microsoft Excel in minutes
People and businesses all over the world rely on Microsoft Excel to process, analyze, and display their data. This classic BI tool has some new modern features. Examples are learned intelligence that organizes your data based on recognized patterns, prebuilt advanced formulas and one-click templates for predictive charts, and real-time collaboration in shared files.
You can add fast, automated data management and cloud convenience and security to Excel with the Panoply integration. Panoply manages your data in the only fully integrated cloud service that combines an automated ETL with a data warehouse. It continuously uploads, sorts, and stores all your latest data in one place, saving you time and data prep effort. The Panoply ETL pipeline streams your latest, cleanest data to your Excel charts and graphs, so they always display the most relevant results.
Learn more:
Documentation
Microsoft Excel Data Warehousing
Microsoft Excel Business Intelligence
See all integrations
![]()
Other integrations with Microsoft Excel
Integrate with KNIME in minutes
KNIME is an open source platform that analyzes and integrates data and designs apps, services and reusable components. Machine learning, AI and predictive modeling are some of the advanced features of this powerful BI tool. With over 2000 modules, you can build your own end-to-end workflow or use one of hundreds of sample workflows to get started fast.
Make your KNIME analytics work even faster by adding Panoply with one click. The Panoply KNIME integrator automates all the ETL work for you. It uploads data from any source in minutes, stores it in one place, and then simplifies and sorts the data. The all-in-one Panoply data stack seamlessly updates KNIME output in real time when your source data changes. So your KNIME analysis results are always clean, relevant and up to date.
See all integrations
![]()
Other integrations with KNIME
Try It Now
Start syncing your data to now. Free 21-Day Proof of Value.
Frequently Asked Questions
Приложение
для анализа и обработки данных KNIME: запись данных в файл — Excel writer
Запись
данных в файл в KNIME — нода Excel writer
Допустим,
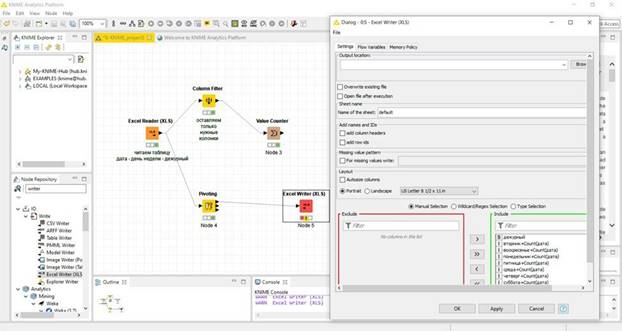
мы обработали наши данные нужным образом и теперь хотим их сохранить в файл. Извлекает
из репозитория ноду Excel Writer, которая пишет результат обработки в xls,
лежащий где-то на компьютере. Окно настроек ноды довольно простое:
• Output
location – задаем путь к файлу — это путь до самого файла, а не папки, где он
лежит;
• Далее
– две галки: перезаписать существующий файл и открыть файл после завершения
WorkFlow;
• Sheet
name – выбор вкладки в экселе, в которую пишем;
• Две
галки в блоке Add names and IDs – настраиваем, выводить ли заголовки столбцов и
идентификаторы строк;
• Missing
value pattern – указываем, что будем писать вместо пустых ячеек
• Layout
– настройки ширины колонок
• Самое
главное – в нижней части окна: выбор колонок для отображения. Допустим, я хочу
выгрузить всю информацию по выходам дежурных в каждый день из нашего примера.
Для этого перетаскиваю вправо все колонки.
Приложение
для анализа и обработки данных KNIME: извлечение данных из СУБД
Извлечение
данных из СУБД в KNIME
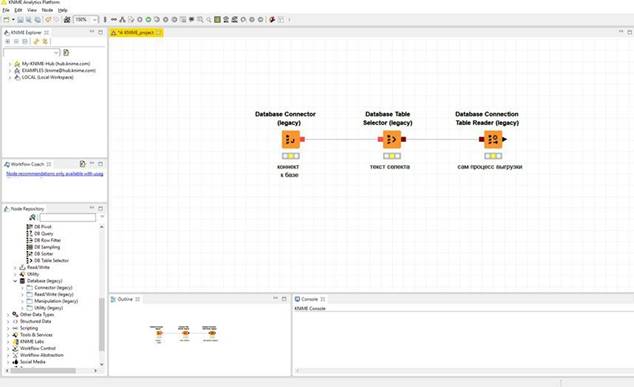
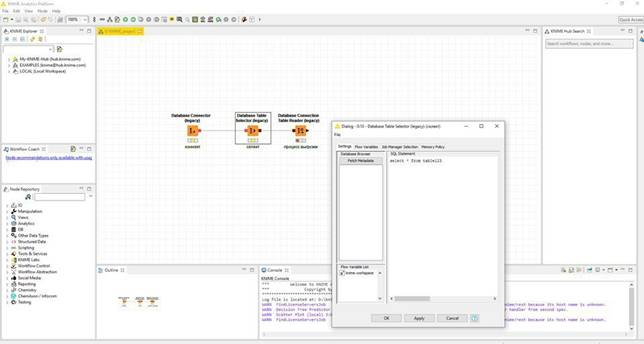
Для
того, чтобы прикрепить KNIME к СУБД и что-то вытащить, в самом простом варианте
нужны 3 ноды:
• Database
Connector – в ней прописывается драйвер, строка подключения, логин/пароль;
• Database
Table Selector – здесь прописываем текст селекта;
• Database
Connection Table Reader –эта нода осуществляет непосредственно выгрузку
селектом, написанным в Database Table Selector
Дальше
посмотрим детали каждой из них и особенности, связанные с драйверами, на
примере коннекта к базе Oracle.
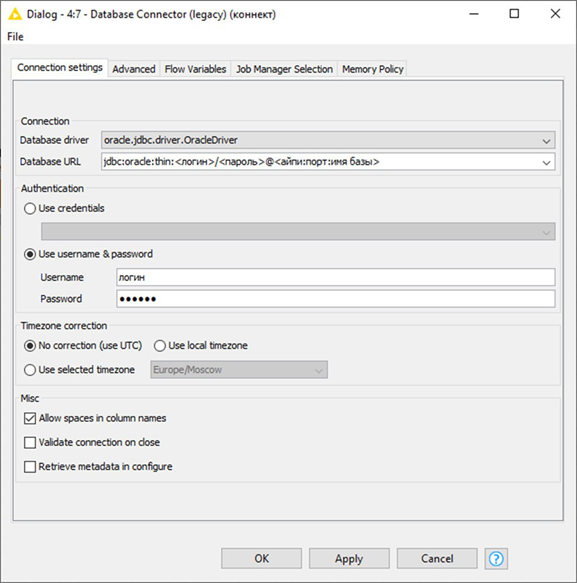
Прикрепляемся к оракловой базе. В
настройках ноды Database connector прописываем URL в формате, как на картинке
ниже, прописываем имя пользователя и пароль.
В выпадающем списке нужно выбрать драйвер
для подключения. В нашем случае это oracle.jdbc.driver.OracleDriver. По
умолчанию в установленном KNIME есть много драйверов, но именно этого драйвера
нет. Он ставится отдельно.
Итак,
чтобы прикрепиться к базе oracle, нужен драйвер jdbc, который мы затем выберем
из выпадающего списка при настройке ноды Database Connector. Шаги примерно
такие:
1. Ищем
в поисковике (яндекс, хром и т.д.) oracle jdbc driver download
2.
Заходим на oracle.com, скачиваем драйвер. Но его скачать можно только из
личного кабинета, который придется создать. Должен скачаться файл типа
ojdbc7.jar
3.
Кладем файл в папку plugins в каталоге с установленным KNIME
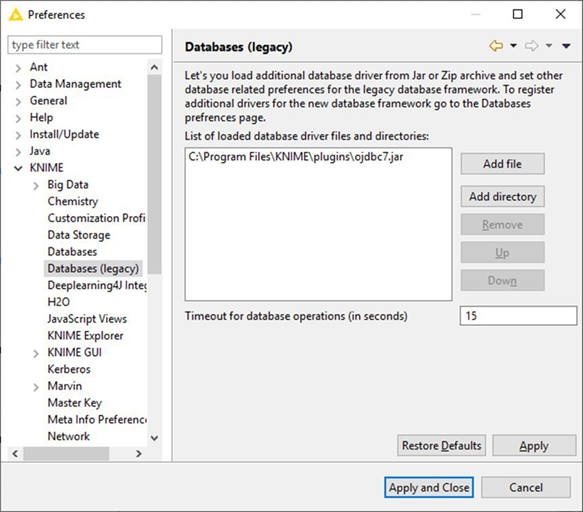
4. В
самом KNIME заходим в File -> Preferences. Выбираем ветку KNIME ->
Databases и KNIME -> Databases (legacy), добавляем наш файл в список
(см.картинку). Точная разница между этими двумя ветками, видимо, кроется в том,
что ноды от старых версий KNIME, открываемые в версии 4.0, имеют приставку
legacy. Соответственно, настройка под них имеет отдельную ветку. При желании
можно поэкспериментировать.
5.
Теперь можем выбирать этот драйвер в настройках ноды Database Connector. Называться
он будет oracle.jdbc.driver.OracleDriver
Подключение
(коннект) к базе готов, можно писать выборку (селект) и выгружать.
После
настройки коннектора соединяем его с нодой Database Table Selector, открываем
ее свойства и прописываем внутри селект. Затем соединяем с нодой Database
Connection Table Reader (DCTR), которая непосредственно вытаскивает данные.
Когда workflow запущен и работает, можно навести курсор на DCTR и во
всплывающей подсказке будет виден текущий прогресс выгрузки. Данные из базы мы
вытащили.
Скачано с www.znanio.ru
Download our whitepaper about the the most commonly used Excel functions to their KNIME equivalents
This easy to follow guide can help you transition from Excel to KNIME. It maps the most commonly used Excel functions and techniques to their KNIME equivalents, taking you through the steps you’d take in Excel and showing you how they can be done in KNIME Analytics Platform. Find out, for example, how data reading, filtering, sorting, pivoting, math formulas, and commonly used functions such as vlookup are handled in KNIME.
Download your free copy here 👇
About KNIME
KNIME is designed to provide fast, simple and interactive access to data prep and data science, allowing companies to embrace innovation. KNIME Analytics Platform is the solution to explore the potential of your data, to easily create workflows to prepare, clean, and enrich your data, to obtain insights for stronger analysis. The solution is unique with a global community gathering more than 60 countries using the solution.
Follow Mydral on LinkedIn ! Get can’t-miss events, webinars, insignts and the latest Mydral news.
Read our latest blogs posts on the data preparation or other data topics that your business faces. Read hints and tips !
Author Profile

-
Hi, I’m a digital marketing fashionista ! I’m passionate about covering topics like big data, business intelligence and Artificial Intelligence. SEO for the sake of Google 🙂
Latest entries

Sylvana AH-LAYE
administrator
Hi, I’m a digital marketing fashionista ! I’m passionate about covering topics like big data, business intelligence and Artificial Intelligence. SEO for the sake of Google 
 KNIME® Excel Support
This repository contains the plugins for the KNIME Excel Support.
The extension allows you to read spread sheets and sheet names from excel files (xls/xlsx),
write a table to a new excel file or append a table to an existing excel file.
Overview
This repository contains the source code for the KNIME Excel Support.
The extension contains the following nodes:
- Excel Reader (XLS): Reads a spread sheet from a workbook.
- Read Excel Sheet Names (XLS): Reads the names of the sheets of a workbook.
- Excel Writer (XLS): Writes data into a spread sheet of a workbook.
- Excel Sheet Appender (XLS): Writes data into a spread sheet and appends it to an existing workbook.
Example Workflows on the KNIME Hub
You can find example workflows on the KNIME Hub.
Development Notes
You can find instructions on how to work with our code or develop extensions for
KNIME Analytics Platform in the knime-sdk-setup repository
on BitBucket
or GitHub.
Join the Community!
- KNIME Forum