
These features are only available in Google Earth Pro.
Import spreadsheet data
To add location data from a spreadsheet into Google Earth, import the latitude and longitude info. You’ll need a text file that is delimited, which means each line is a separate piece of coordinates info. Every location that you import from your text file is converted to a Google Earth placemark and listed in your Places.
Add longitude and latitude from a CSV file
If you would like to practice importing data, you can download a sample CSV file to use with the steps. Or follow these steps with your own CSV file.
- On your computer, open Google Earth Pro.
- Click File
 Import.
 - Browse to the location of the CSV file and open it.
- In the box that appears, next to Field Type, choose Delimited.
- Next to Delimited, choose Comma.
- Use the preview pane to ensure your data has imported correctly and click Next.
- Next to «This dataset does not contain latitude/longitude information,» leave the box unchecked.
- Select the fields in your spreadsheet that contain the latitude and longitude data and click Next.
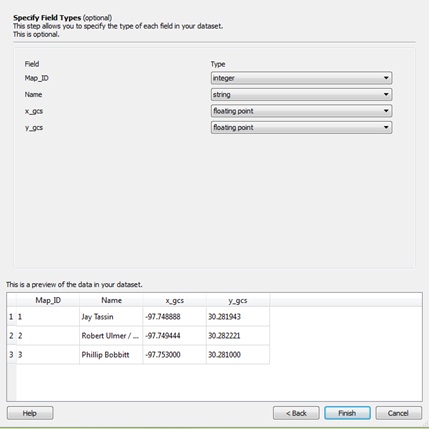
Optional: Specify the type of each field in your dataset. - Click Finish. Google Earth begins geocoding your data.
- To use a style template, click Yes.
- Click OK.
- Create a new style template, or use a previously generated template.
You can adjust the name, color, icon, and height for your placemark. If you like, save your selections as a template to use in the future.
Import addresses
If you want to see multiple locations around the world, you can import addresses into Google Earth Pro. Each address that you import is converted to a placemark on the Earth.
Guidelines for importing addresses
- You can only import addresses located within the United States, United Kingdom, Canada, France, Italy, Germany, and Spain.
- You cannot use an address that contains a P.O. box.
- Single-address field: You can define the street, city, state, country, and zip code in a single field.
- Multiple address fields: You can also define street, city, state, country, and zip code in multiple fields.
- Partial address default values: If some of your points have partial addresses, you can use the data import wizard to define default values for missing fields, such as state or zip code.
Import address data from a CSV file
If you would like to practice importing data, you can download a sample CSV file to use with the steps. Or follow these steps with your own CSV file.
- On your computer, open Google Earth Pro.
- Click File Import.
- Browse to the location of the CSV file and open it.
- In the message that appears, next to Field Type, choose Delimited.
- Next to Delimited, choose Comma.
- Use the preview pane to ensure your data has imported correctly.
- Click Next.
- Next to «This dataset does not contain latitude/longitude information,» check the box and click Next.
- Choose «Addresses are broken into multiple fields.»
- Under «Select Address Field(s),» look over the names to make sure they’re correct and click Next.
- Confirm the list of fields and the type of data selected for each and click Back.
- Click Finish. Google Earth begins geocoding your data.
- To use a style template, click Yes.
- Click OK.
If you like, save the template as a file (.kst) that you can use in the future.
Google Earth displays your address data as icons in the 3D viewer. You can edit the properties of these placemarks as you would any other placemark.
Import images
You can open GIS imagery files to project images embedded with display information over specific map coordinates in the 3D viewer. Files using NAD83 projection are not supported by Google Earth.
- TIFF (.tif), including GeoTiff and compressed TIFF files
- National Imagery Transmission Format (.ntf)
- Erdas Imagine Images (.img)
Other image files
You can also import images if you manually edit their coordinates for correct positioning. Imagery files without the correct projection information will not be accurately re-projected.
- Portable Network Graphic (.png)
- Joint Photographic Expert (.jpg)
- Atlantis MFF Raster (.hdr)
- PCIDSK Database File (.pix)
- Portable Pixmap Format (.pnm)
- Device Independent Bitmap (.bmp)
Open GIS images
You can open GIS images in Google Earth to view them over a map image.
- Open your computer, open Google Earth Pro.
- Click File Open. Then, choose the file you want to import.The overlay edit window appears.
- Set the location of the new overlay in any folder inside the ‘Places’ panel.
- Choose the properties for the GIS image:
- The reprojected image is saved as an overlay. The image is saved under the Google Earth directory on your hard drive. The name of the PNG file is based on the source file name and the scaling or cropping parameters selected when importing the overlay. (See below for more information on scaling or cropping an image.
- For larger image files, reprojection can take some time. If you have cropped or scaled an input image, or if you are reprojecting an image that uses more texture memory, you will see a progress meter while the reprojection occurs. You can cancel the operation at any time.
- Images that contain no projection information are treated as ordinary overlay files. You can position the image manually as you would an overlay image.
- Images that contain incorrect or unsupported projection information will not be imported. A dialog box indicates that the reprojection cannot be performed and the image will not be imported.
Save GIS images
Once you have imported imagery data, you can save content changes made to the imported GIS data:
Move the imported imagery to remain in your ‘My Places’ folder. If you have already placed the imagery overlay within the ‘My Places’ folder, any changes you make to it are automatically saved and viewable when you start Google Earth.
Save the imagery overlay as a KMZ file. If you wish to remove the imported imagery from your ‘My Places’ folder:
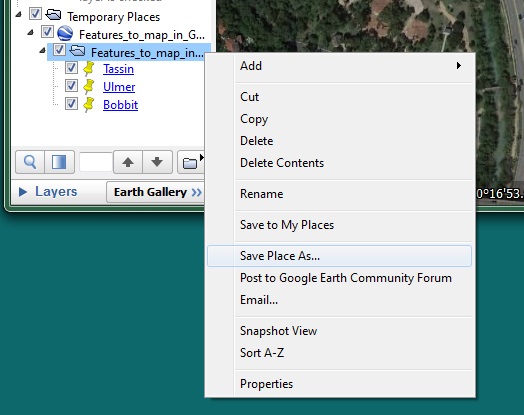
- Right-click the item and select Save Place As from the pop-up menu.
- Then, save the GIS overlay as a KMZ file to your computer’s hard drive or other accessible file location.
- Delete the overlay from your ‘My Places’ list and open it when you need it.
Import vector data
You can import files with points, lines, paths, and polygons onto your maps.
- Open Google Earth Pro.
- Click File Open.
- Select the type of file you want to import or choose All data import formats.
Once imported, the vector elements appear in the 3D viewer and the imported file is listed under the ‘Temporary Places’ folder.
Note: If you don’t use a style template and your data does not contain a ‘Name’ field, the first available field that contains text is used as the label for data.
Use third party vector data
Most third party GIS vector data comes as a collection of support files. If expected data does not display in the 3D viewer, it might be due to missing support files.
Vector files and required support files:
- MapInfo (TAB)
- MAP ID
- DAT
- ESRI Shape (SHP)
- SHX Index
- PRJ (required if projection is not WGS84)
- DBF (attribute data)
- Generic text files
Import generic text files
You can define your own point data and import it using generic text files.
Generic text files must:
- Have named columns whose values are separated either by commas, spaces, or tabs.
- Be saved as either CSV or TXT format.
- Display coordinates as:
- Degrees, minutes, seconds (DMS)
- Decimal degrees (DDD)
- Degrees, minutes, with decimal seconds (DMM)
- Contain one or more fields that specify the location of the point on the earth.
- Not use a mix of geographic coordinates and address fields in a single file.
You can use latitude and longitude coordinates to indicate the position of the point data in your text file.
Optional and Descriptive Fields
You can use any number of fields in your custom data file to label and describe points in Google Earth Pro.
Optional fields can be defined as text or strings:
- A string field can contain both numbers and alphabetic characters.
- Strings must be either enclosed in quotation marks or contain white space so that it cannot be interpreted as a number.
With style templates, you can use these field types to create useful visual effects in the 3D viewer such as graphs or color-coding of data based on the values in the fields:
- Integer
- Floating point value
Apply a style template
You can apply a style template to vector data that contains fields you want to have displayed in the 3D viewer.
- Style templates can only be applied to placemarks that contain extended schema data, such as those imported in a vector data file.
- You can use the same style template for different data that has the same fields if the template settings are adjusted to represent the data properly.
To apply a style template:
- After you import data to your ‘Places’ panel, select the data folder and click Edit Apply Style Template.
- Click Use existing template.
- In the ‘Compatible templates’ list, choose the style template you want to apply to your data set.
- To edit the style template, click Edit selected template OK.
- Choose a field from your data that you want to use as a name, or label, for your data. Note: This name appears in the 3D viewer and in the Places panel that lists the data points.
- Click Color to map an element of your data to color styles.
- Click Icon to map an element of your data to one or more icons.
- Click Height to map a height value to a data element.
- Click OK.
You’ll see your data and defined values in the 3D viewer.
Map data fields to different features
Map color styles
You can apply color to selected fields in your imported data. In this case, color is applied to the feature depending upon the type of data imported:
- Icons are colored with point data
- Lines are colored when applying to lines or paths
- Solid polygons are colored with shape data
Use the color style to color these elements in a meaningful way depending upon both the data type and the field data within the entire set.
Use a single color for all features
If you want to use one color for all the points or lines from your imported data, select the ‘Use single color’ option. Then, click the colored square next to the option. From the color selector, choose a color or define your own color to apply to the data.
Use random colors
To use a variety of colors that are applied randomly by Google Earth Pro, select the ‘Use random colors’ option. If you are also supplying an icon for point data, the color is added to the existing color of the icon.
Set colors based on field values
If you want to compare features with a data set, use colors to define different field values.
Examples:
- Set a short range of colors based on the square footage of real estate listings.
- Set a range of colors for shape files showing average household income.
Follow steps 1-6 under Apply a style template.
- Select the Set color from field option in the «Color» tab. Then, choose a color from the Set color dropdown. Here, you can choose either numeric fields or text fields from your data.
- To change the color range, click each color block and set the starting and ending color. Google Earth Pro calculates the range between the two color values.
- To group a range of numeric fields, choose a number of buckets.
- To display data elements for places based on color bucket, create subfolders.To show or hide the display of color groups, use the check box next to the folder. Note: Only one sub-folder can be assigned for either color or icon display.
- To reverse the order of the color range and their element assignments, click Reverse order.
- Click OK to save your style template.
Map icons to point data
You can apply icons to fields in your data. Icons cannot be mapped to line or shape data.
There are two ways to map icons to points:
- Use same icon for all features
- Set an icon from a field
Set icons to fields in your data
Customize icons for imported placemarks by a data field.
Follow steps 1-6 under Apply a style template.
- Select Set icon from field. Choose the field that you want to apply icon labels to.
- To group a range of numeric fields, choose a number of buckets. For each bucket defined, select an icon from the list.
- Create subfolders to display data elements for places based on color bucket.To show or hide the display of color groups, use the check box next to the folder. Note: Only one sub-folder can be assigned for either color or icon display.
- To modify an individual bucket icon element, click the bucket to adjust the value or value range. Note: To adjust the spread of the data to your preference, modify the settings for numeric buckets.
- Click OK to save the style template.
Map height values
After height values are set, points, lines, or shapes are moved from ground level to the height defined for each data element.
- If you map height to lines or shapes, the values you define work in combination with the colors defined.
- If you map height to point data, those points are moved using a single pixel colored line to connect the icon from its elevated position to the ground. You can use style settings to modify the width and color of lines.
Height values for text fields
If the field you choose to map contains text data, the first 8 unique fields are each defined in their own bucket. Only map height values to a field that has 8 or fewer unique values.
Height values for numeric fields
When you map height values to a numeric data field, you can choose from two mapping methods:
- Continuous: Uses the minimum and maximum values of a field to determine a minimum and maximum height display for the entire set. Use this method for smaller data sets where individual distinctions between points or shapes are easily visualized.
- Split into buckets: Creates up to 8 height groupings for your data. Use this method for large data sets where continuously mapped heights are not easily visualized in the 3D viewer.
Edit style settings of map points
To make data points and lines easier to see in the 3D viewer, you can edit the style settings for each point to modify the line thickness.
- Mouse over the point you want to modify. Then, select Properties (Windows, Linux) or Get Info (Mac).
- In the ‘Style, Color’ section, modify the point’s appearance as needed.
- Click OK.
Note: For large data sets, apply changes to entire folders or subfolders.
Choose field types
When using color, icon, or height mapping for specific fields in your data set, you can define a number of buckets to show different ranges of data. You can choose two basic types of fields from your data when mapping color, icon, or height values.
Text (string) fields
If a field type contains non-numeric data, Google Earth Pro maps the first 8 unique text fields to the style. If there are fewer than 8 values in your data, each unique value is paired to a different color, icon, or height. If there are more than 8 values, the first 8 unique values are mapped to a style, and the rest of the values are grouped together and mapped to a ninth style. For this reason, it typically is most useful to apply a style to text fields that contain small unique sets.
Numeric fields
Numeric data fields are automatically spread out across the number of buckets that you select and include a count of items in each bucket. If you increase or decrease the number of buckets, the application automatically redistributes the number of elements in each bucket.
Fix field formatting errors
If you are using a spreadsheet application to create your data, choose a numeric cell format. If you have numeric fields in your CSV saved from a spreadsheet, but the ‘Style Template’ wizard is not recognizing it as numeric, it might be due to incorrect formatting.
To verify whether the actual field is marked as text or numeric:
- Open the CSV file in a simple text editor and look at the field in question.
- If the field is enclosed in double quotation marks, then it has been defined as text — even if there are only numbers within the quotations.
- Remove the quotation marks manually from the file, or open your spreadsheet application and format the cells as numeric.
- Then, save the CSV data again.
Was this helpful?
How can we improve it?
Содержание
- How to map points from Excel in Google Earth Pro
- How to import coordinates and directions to Google Earth from Excel?
- First step: Use Earthpoint
- How to Change the Screen Timeout or Sleep Time in Windows (Examples)
- Step Two: Import coordinates and directions to Google Earth from Excel
- Import data directly from a GPS device
- Windmill Software Ltd Data Acquisition Intelligence
- How to display Excel data on Google Earth: Excel to KML
- Adding More Information to the Google Earth Overlay
- Showing a Moving Track of Data in Google Earth
- More Excel Tips and Tricks
- Free Geography Tools
- Importing Spreadsheet Data Into Google Earth
- Related posts:
How to map points from Excel in Google Earth Pro
Environmental professionals often use Google Earth as an inexpensive way to view and analyze data. In February, we wrote about the relaunch of Google Earth Pro as a FREE program available to anybody with a computer. One of the key advantages to using the professional version, is that Google Earth Pro can import huge tables and place your information on the globe. Did I mention that it was FREE?
In this post I will teach you how to take latitude and longitude data from within an excel table and turn it into a placemark within Google Earth Pro. In addition, I will teach you how to save your points as a KMZ file for use in Google Earth.
Create Google Earth placemark from Latitude/Longitude
1. Open the Excel table that contains the Latitude/Longitude data. Click here for more information on geographic coordinates.
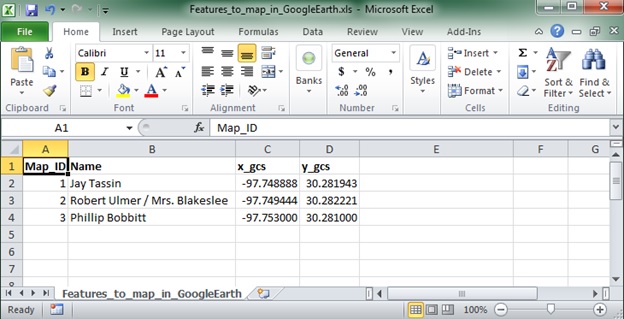
Excel Table with Lat/Long Values
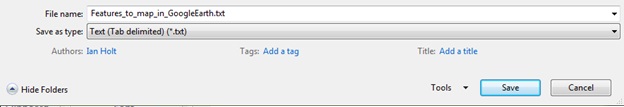
2. Click: File –> Save As –> Save as a ‘tab delimited’ Text file
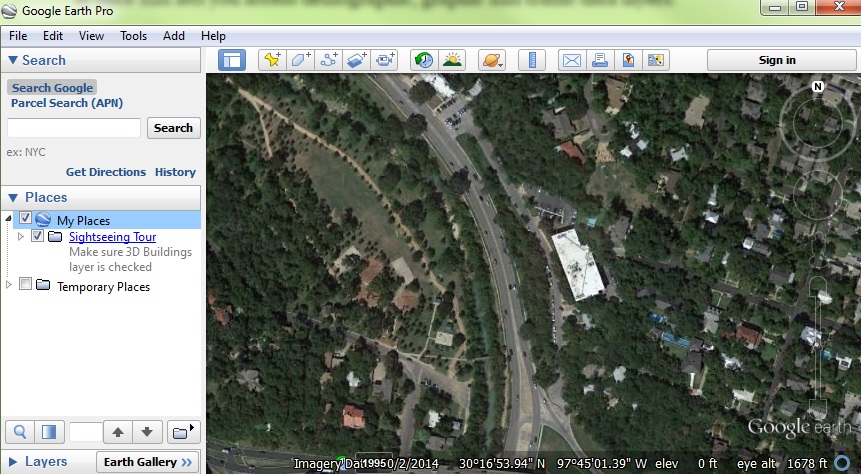
Google Earth Pro
4. Click: File –> Import… –> Open the text file that was created in step 2.
5. The Data Import Wizard will guide you through the process. You should see a preview on the bottom that looks exactly like the Excel table from step 1. Click Next.

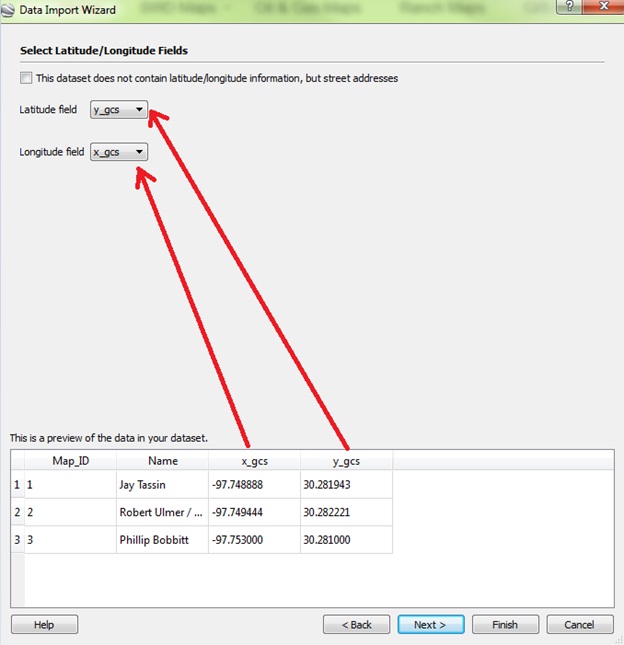
6. Tell Google Earth which columns in your table have latitude/longitude data. (Y = Latitude / X = Longitude)
7. Specify Field Types (this step is optional). Click Finish.
8. Click yes to create a style template. Choose an icon that will be used to display your placemark. Click OK.
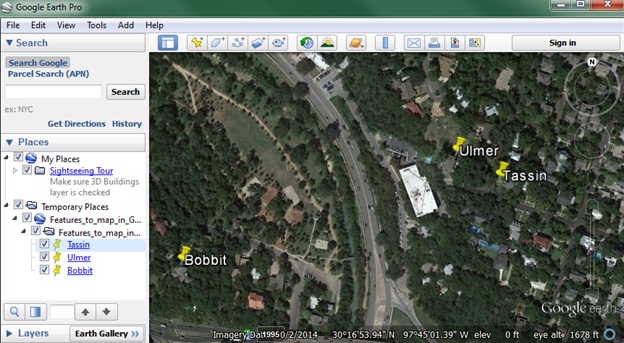
9. In the Search menu on the left, find your file in the “Temporary Places” menu and click the empty box to make your placemarks visible.
You’re almost done!
10. In the “Temporary Places” menu, right click on your file and click on “Save Place As”. From here you can save your Google KMZ file. Once it is saved, you’re done!
Источник
How to import coordinates and directions to Google Earth from Excel?
Google Earth is the best program if you want to find some direction that is not near you. This has an engine so powerful that even allows users to add their own GPS coordinates to map existing (you can even open or create maps with Google Earth ). Why it is that today learn to import coordinates and directions to Google Earth from Excel.
This application takes years in use, each time getting better thanks to the power of Google. It is no exaggeration to say that perhaps one of the most capable tracking programs exists, if the goal is to find something that is on the surface of the planet. So logically there is to know more about it.
First step: Use Earthpoint
The first thing you have to keep in mind is that the process matters r coordinates and directions to Google Earth from Excel is very simple, however it can take some time, so will need patience to do so.
To start you need to go to the browser of your choice and find the website called Earthpoint Excel to kml .
You may also be interested in:
How to Change the Screen Timeout or Sleep Time in Windows (Examples)
This is to help you return your coordinates Excel on a compatible file for Google Earth . However, for the page to read it, your Excel data must be saved in a txt or cvs format also available within the document must be specific.
If you want to know how is this, you only have to download the example that comes on the same page which is called «ExcelToKmlDemo.zip».

Once your file match the sample, you just have to go back to the page and press on the «Choose File» , then choose your document and click « Open «.
Then give a «View in Google Earth» this automatically will turn the page and download your file in one of KML extension, which will keep the same name as the original.
Step Two: Import coordinates and directions to Google Earth from Excel
Now that you’ve completed the previous step, you’re closer to import coordinates and directions to Google Earth from Excel, so the following is go up to your implementation of Google (if not obviously you must download it).
When you get there, go to the top, and where the options hit « File «, and after that press « Open » in the you will drop down.
With this action a dialog box where you find your KML file (recommended store it in a single folder for it) will open.
A the find, select and dale click the « Open » that will make the program load your data (the amount), and now reflect on the map button.
This process will be over, so now you must give the option is called « Save «, so that your file remains in the directory and can open it easily whenever you want with just to click.
Import data directly from a GPS device
If you followed the previous steps to the letter, and should know how you can import coordinates and directions to Google Earth from Excel. But in the case you have a GPS device , you should know that there is also a way to transfer data automatically.
For that, you have to connect the device to the computer where you have the program. Then within Google Earth, you have to go to «Tools» and from there has «GPS» , in that paragraph you will get a menu where you can choose compatible devices, if that is the case with yours, just select it and then import.
And ready, with that as the initial question is answered, so only you subtract get down to work and start importing files that you consider convenient in your program. Finally you should know that can also export a map of Google maps to PDF, Word or Excel and even capture or copy images satellite , so do not stay alone with this tutorial and looking for more.
How useful did you find this content?
Click on a star to rate!
Submit the score
Average score 0 / 5. Counting of votes: 0
So far, no votes. Be the first to rate this content.
I’m sorry this content was not useful for you!
Источник
Windmill Software Ltd
Data Acquisition Intelligence
How to display Excel data on Google Earth: Excel to KML
You can show spatially referenced data from Excel on Google Earth, and even a moving track of data over time. To do this you need to collect latitude and longitude readings from a GPS receiver alongside other measurement data such as depth or temperature.
For example, you might be measuring conditions on a moving train: any wheel slip in poor weather for example. With a Windmill system you could record co-ordinates from a GPS receiver, data from the wheel-slip detection mechanism, wheel speeds and other details.
Let’s assume that you’ve collected your data and it is in an Excel spreadsheet. You now need to create a ‘KML’ file from your data.
KML is a file format used to display geographic data in applications such as Google Earth or Google Maps. It is a text file based on the XML standard.
Before you can convert your Excel file to KML, you have to arrange your worksheet in a specific way. It should contain at least 3 columns: latitude, longitude and your data — for example depth. Change the title of the data column to Name.
The first column is depth data (m), collected by Windmill software reading sonar data.
Windmill grabbed the latitude and longitude data from a GPS receiver.
There are several utilities out there that will convert your Excel file to KML for you. I like Earth Point’s offering at http://www.earthpoint.us/ExcelToKml.aspx. Some others are listed below.To use the Earth Point tool:
- Look for the Choose File button on their web page, and browse to your Excel file.
- Click «View on Google Earth». The Earth Point utility will save your file as a KML file.
- Open Google Earth on your PC.
- From the Google Earth File menu, open the file you have just saved. Your data will be overlaid as labelled points.
Adding More Information to the Google Earth Overlay
You can add other columns to your spreadsheet, providing more details. For example, if you add a column titled «Description», whatever you type here will appear in Google Earth as a pop-up balloon.
You can also show a moving track of data over time.
Showing a Moving Track of Data in Google Earth
To show moving tracks on Google Earth you also need a column in Excel headed «TimeWhen». Windmill saves two columns of time data: one containing the date and one containing the time
You need to combine these into one in the format:
2012-03-22T07:30:15Z
Where
T separates the date from the time.
Z indicates that the time is UTC (Greenwich Mean Time)
If your time zone is different, instead of Z put — for example — +03:00. More details are at https://developers.google.com/kml/documentation/kmlreference#timestamp.
- Combine the contents of the date and time columns into 1 new column, eg column F.
— In an empty column in Excel enter this formula :
=TEXT(A2,»yyyy-mm-dd»)&»T»&TEXT(B2,»hh:mm:ss»)&»Z»
This combines the date and time, adds a «T» between them and formats the result as text. - Copy the formula down for each row.
- Select all the new date/time entries and copy them to the clipboard.
- Click cell A2, from the Edit menu select Paste Special.
- Paste as values.
- You can now delete the Time column and column F.
- Change the title of Column A from «Date» to «TimeWhen»
- Finally, add a new column with the title «LineStringColor».
Fill the rows in this column with the name of a colour, for example Yellow.
More Excel Tips and Tricks
Our free Monitor newsletter (ISSN 1472-0221) features a series of Excel Corners, giving hints and tips on using Excel. To subscribe to Monitor fill in your e-mail below.
Источник
Exploring the world of free tools for GIS, GPS, Google Earth, neogeography, and more.


Importing Spreadsheet Data Into Google Earth
One of the features offered by Google Earth Plus is the ability to import data in spreadsheet format, specifically the CSV format: Comma-Separated Values a simple text format where data values are separated by commas, and each set of data is in a different line. But Google Earth Plus has a limit of 100 points for data import. When you consider that there are free options that will convert spreadsheet data into Google Earth’s KML format without this size limitation, then it’s not all that much of a “Plus”.
There are two different kinds of data that can be imported into Google Earth:
1. Data with geographic positions already determined. The data needs to be in latitude and longitude position in the WGS84 datum, Google Earth’s native coordinate system. I’ll be talking about coordinate converters at length in an upcoming series, but if your spreadsheet position data is in a different datum, CorpsCon is capable of reading it in and converting it to NAD83 in the US, which is almost identical to WGS84 (for worldwide conversions, try GeoTrans). Don’t know which datum your data is in, or is all this talk of datums going over your head? Don’t worry too much about it – plot the data, and see if the plotted positions are reasonably close to the features in Google Earth, within GE’s limits of error. If they are, and they probably will be, then your data is most likely in WGS84. Don’t forget that in Google Earth, positions have to be entered in decimal format, e.g. 30.5 degrees, not 30 degrees 30 minutes.
2. Data with street addresses. The Google Earth Plus spreadsheet import can convert these into geographical coordinates, a process known as “geocoding”, but there are some free options for this to be covered in a follow-up post.
Starting off with importing spreadsheets that already have geographic coordinates in them:
csv2kml (freeware; Windows only)
Note: I’ve received a report that the last version of this program doesn’t work correctly; if you have this problem, I’ve uploaded an older version here.
There are at least two other programs with this name, but this is the one to have. Converts all the data in .csv text format into a KML file. The file name needs to have .csv as the suffi; to confuse things, some programs want CSV files to have a .txt suffix, and you’ll have to rename the file extension with those. The first line of the .csv file should be the names of the data fields, separated by commas, then every successive line should have a set of data in an order that corresponds to the order of data fields in the first line. Here’s a screenshot:
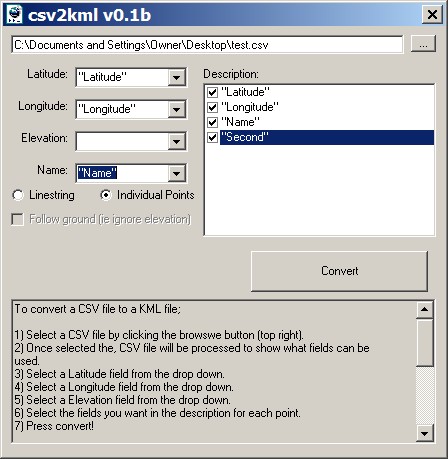
You specify the data fields that correspond to latitude and longitude, elevations if it has that data in meters (otherwise it pins the point to the ground, which you can also require by using the checkbox), and the name you want the point to have when displayed in Google Earth. Latitude should be positive for north, negative for south; longitude is negative for West, positive for East. Checking a data field name under “Description” will include that data in the info that pops up when you click on a point. “Linestring” creates a path, while “Individual points” creates …. individual points.
Most spreadsheet programs will allow you to open, edit and save data in .csv format. Looking for an editor designed specifically to work with files in CSV format? Try CSVed or CommaWorks.
If you have a copy of Microsoft Excel, you can use this free spreadsheet macro; it uses VBA, so macros have to be enabled, and OpenOffice won’t work. The biggest advantage of this spreadsheet is that if your data is in UTM coordinates, it can automatically be converted into the required latitude and longitude in the KML file. Open up the spreadsheet, click on the button that says “Create KML File”, and a window will open up. The first order of business is to select the column order in which the data appears in the spreadsheet. Click on the columns order arrow, and you’ll get a dropdown box showing you the only possible combinations of data columns:
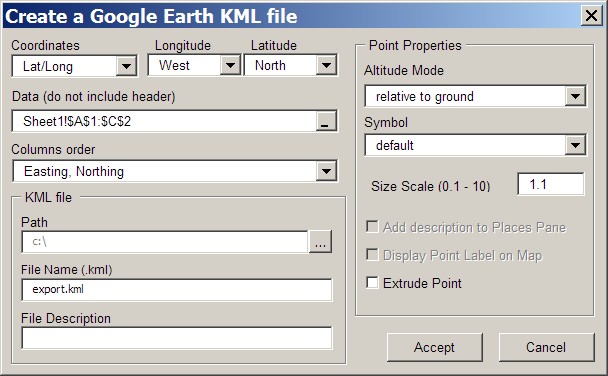
And that’s the biggest limitation for Excel2GoogleEarth – the only sets of data that can be converted to KML are ones that conform to these sets of data columns. Got more data than can be fit into the maximum number and types of data columns available? Tough. Note also that “Easting” comes first in all of these; for geographic coordinates, this means that the longitude column should come first, before the latitude (“Northing”) column.
To select the data you want to convert into KML, first click on one of the Sheet tabs at the bottom, and then enter or copy the data into the spreadsheet, with the data in the order specified by the Columns Order dropdown selection. Then click on the horizontal bar at the right of the Data box:
A small window will appear, with the misleading title “Create A Google Earth File?”. What you actually do is go to the sheet with your data, select the spreadsheet cells you want to convert, then click on the button at the right in that small window. As in the window above, you will see the selected data cell description now in the Data box. Other options allow you to set the default symbol for display (though you can also set this with one of the data columns), use the Altitude to plot the data relative to the ground, include Description data in the data pane for the point in Google Earth, etc..
If you’re wedded to Excel, have to convert from UTM coordinates, or you need to specify different symbol types for every point, Excel2GoogleEarth might be a good choice. Otherwise, you’re probably better off using csv2kml.
GPS Visualizer (website; donations accepted)
The GPS Visualizer website can also accept text data, either in CSV or tab-delimited format, and convert it to a KML file. Be sure to read the tutorial on how to create and format text files for waypoints; a similar tutorial for tracks is “coming soon”.
Coming soon here: converting spreadsheet data in street address form to KML, aka “geocoding”.
Looking for something else? Enter some keywords below, then click «Search».    
Источник
Environmental professionals often use Google Earth as an inexpensive way to view and analyze data. In February, we wrote about the relaunch of Google Earth Pro as a FREE program available to anybody with a computer. One of the key advantages to using the professional version, is that Google Earth Pro can import huge tables and place your information on the globe. Did I mention that it was FREE?
In this post I will teach you how to take latitude and longitude data from within an excel table and turn it into a placemark within Google Earth Pro. In addition, I will teach you how to save your points as a KMZ file for use in Google Earth.
Create Google Earth placemark from Latitude/Longitude
1. Open the Excel table that contains the Latitude/Longitude data. Click here for more information on geographic coordinates.
Excel Table with Lat/Long Values
2. Click: File –> Save As –> Save as a ‘tab delimited’ Text file
Save As –> *.txt
3. Open Google Earth Pro.
Google Earth Pro
4. Click: File –> Import… –> Open the text file that was created in step 2.
5. The Data Import Wizard will guide you through the process. You should see a preview on the bottom that looks exactly like the Excel table from step 1. Click Next.
6. Tell Google Earth which columns in your table have latitude/longitude data. (Y = Latitude / X = Longitude)
7. Specify Field Types (this step is optional). Click Finish.
8. Click yes to create a style template. Choose an icon that will be used to display your placemark. Click OK.
![]()
Choose an Icon
9. In the Search menu on the left, find your file in the “Temporary Places” menu and click the empty box to make your placemarks visible.
You’re almost done!
10. In the “Temporary Places” menu, right click on your file and click on “Save Place As”. From here you can save your Google KMZ file. Once it is saved, you’re done!
Additional resources:
Importing Street Addresses: https://support.google.com/earth/answer/176685?hl=en
Importing Text Files: https://support.google.com/earth/answer/148104?hl=en
Tips and Solutions from Google: https://support.google.com/earth/answer/3306088?hl=en
Happy mapping,

Ian Holt
Water Well Department Manager
iholt@banksinfo.com
This entry was posted in Geomapping, GIS, Technology. Bookmark the permalink.
How to Export Excel Data to Google Earth
- Home
- How To
- Special Features
An important upgrade (in GIS.XL 2.0) was also applied on the function
for data export to KML file. In the previous version, only the point,
line and polygon (without holes) features could be exported. From
version 2.0, the add-in also allows you to export polygons with holes.
In addition, the program allows you to export supported visual properties.
Another improvement is that you can export multiple map layers to one
KML file. As an example we use two map layers – polygons describing a
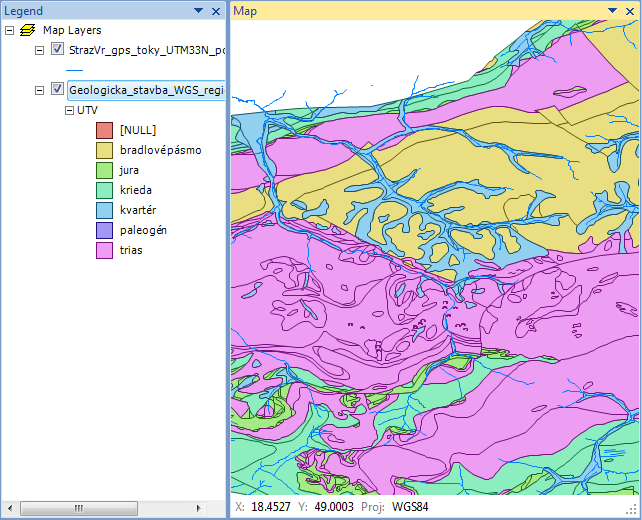
geological structure and lines showing the rivers. Both layers contain
additional information in attribute tables and have defined custom visual
properties (colors, line thicknesses and transparency). The map is
displayed in the desired WGS-84 projection.
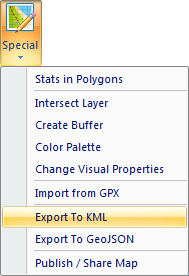
If you want to export this map from Excel to Google Earth, click
on the item Special – Export to KML.
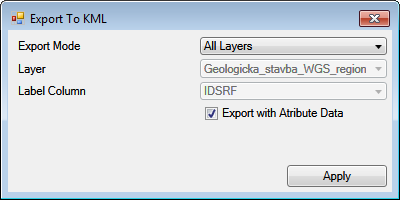
A help dialog is displayed to set the export. In the first
combo-box (Export Mode) you define whether you want to export
only one Selected Layer or All Layers. If you export one selected
layer only, you will set it in the second combo-box – Layer.
Consequently, you can use the Label Column combo-box to define a
column (from attribute table) that will be used to create labels in
Google Earth.
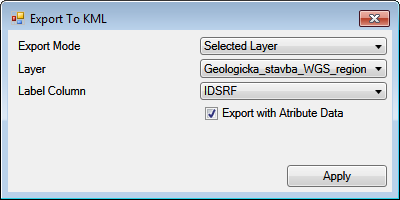
However, we want to export all visible layers (Visible = TRUE) in the
same order as displayed in the Map panel. In this case, set the
Export Mode to All Layers. The following two combo-boxes are disabled.
Using the last check-box Export with Attribute Data, you can define
whether data stored in the shapefile attribute table will be exported.
We leave this option TRUE and finally, click on the Apply button.
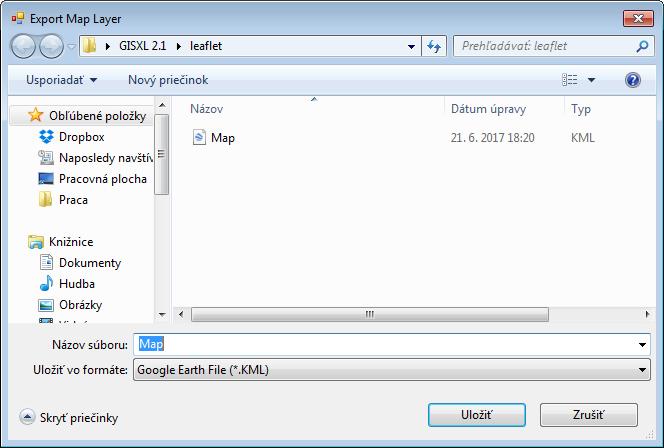
Using the Save File Dialog you set directory and file name of
resulted KML file.
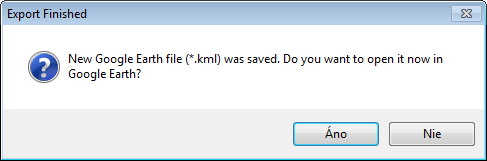
The program exports your spatial data to the KML file (according to
defined settings). You are informed about the process finish by
message-box. In this step, you can automatically open exported file
in the installed Google Earth (click on the Yes button).
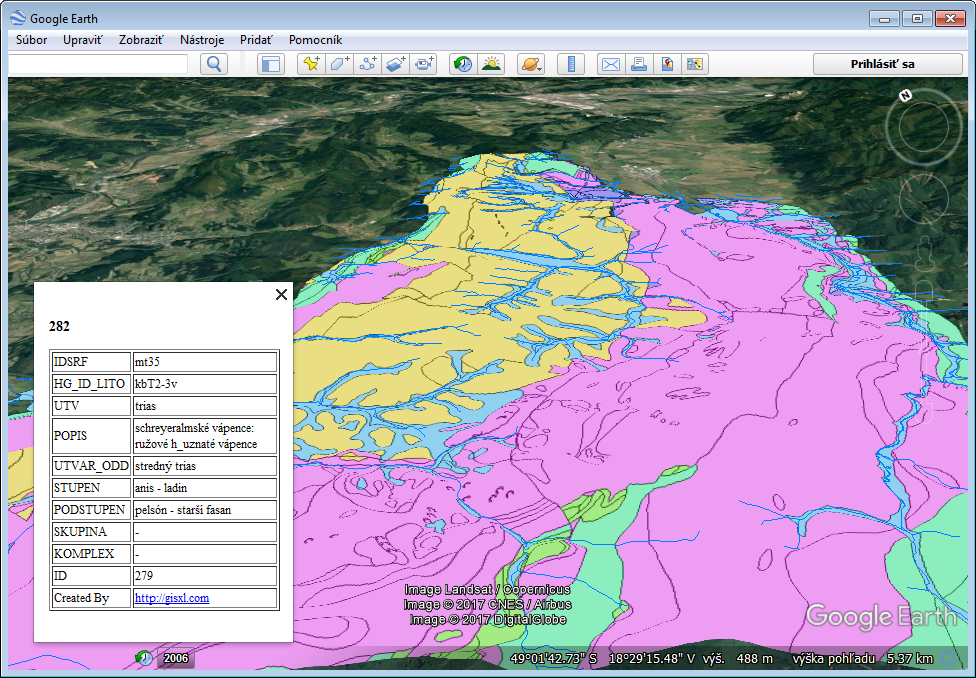
The exported result will be displayed in Google Earth in the same
format as it is in the Excel Map panel. However, this export is
not completely identical because the KML specification allows exporting
only some visual settings. For example, lines can be defined only
as solid lines or points are displayed always as markers with three
visual properties – size, color and transparency. Our result is shown
in the following figure. If you click on the selected object on the
map, a dialog will appear that lists all the information from the
attribute table.
Keep in mind that if you want to visualize your data in Google Earth
you need to have a Map panel projection set to WGS-84 (default).
If you have your spatial data in another projection, you need to
reproject Map panel before the export.
Conversion from XLS to KML
Upload your XLS data (widely used in software like MS Excel) and convert them by one click to KML format (widely used in software like Google Earth, Fusion Tables, Maps and GPS devices).
Notice to XLS format — Detection of columns containing coordinates is based on attribute name — please rename columns containing coordinates to any of these: x, xcoord, xcoordinate, coordx, coordinatex, longitude, long (and of course: y, ycoord, ycoordinate, coordy, coordinatey, latitude, lat). If you have geometry as WKT or WKB, use wkt or wkt name for the geometry column name.
Notice to KML format — KML converter strictly transforms input dataset to WGS 84 coordinate reference system (if needed). Please make sure that coordinate reference system of your input dataset is assigned correctly — otherwise the resulting KML file may be spatially shifted or wrong.