
Use Excel’s Get & Transform (Power Query) experience to connect to a SQL Server Analysis Services (OLAP) database server.
-
Click the Data tab, then Get Data > From Database > From SQL Server Analysis Services Database (Import). If you don’t see the Get Data button, then click New Query > From Database > From SQL Server Analysis Services Database.
-
Input the Server name and press OK.
Note: You have the option of entering a specific database name, and you can add an MDX or DAX query.
-
In the Navigator pane select the database, then the cube or tables you want to connect.
-
Click Load to load the selected table, or click Edit to perform additional data filters and transformations before loading it.
In Excel 2010 and 2013, there are two methods of creating a connection to a SQL Server Analysis Services (OLAP) database. The recommended method is to use Power Query, which is available if you download the Power Query add-in. If you can’t download Power Query, you can use the Data Connection Wizard.
Power Query
-
In the Power Query ribbon, click From Database > From SQL Server Analysis Services Database.
-
Input the Server name and press OK.
Note: You have the option of entering a specific database name, and you can add an MDX or DAX query.
-
In the Navigator pane select the database, then the cube or tables you want to connect.
-
Click Load to load the selected table, or click Edit to perform additional data filters and transformations before loading it.
Data Connection Wizard
-
On the Data tab, in the Get External Data group, click From Other Sources, and then click From Analysis Services.

-
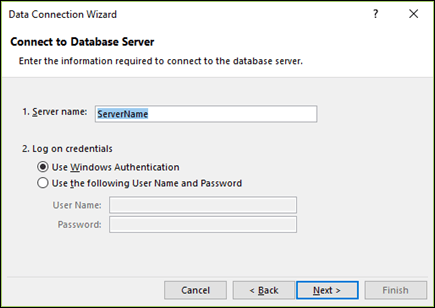
In the Data Connection Wizard, enter the Server name, and select a login option. Click Next.
-
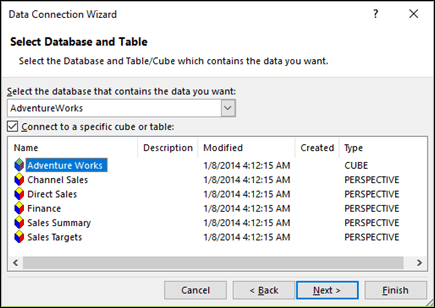
Select the database and table or cube that you want to connect to, then click Next.
-
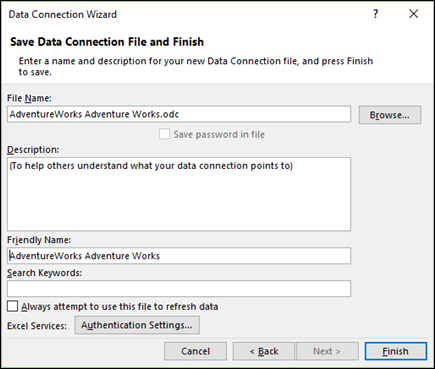
Enter a name and description for the new connection, and press Finish to save it.
-
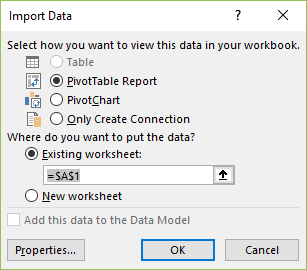
In the Import Data dialog, select an option for how you want the data to be retrieved, and where you want to place the it. Beginning with Excel 2013, you also have the option to save the data to the Data Model.
Содержание
- Настройка поставщика данных MSOLAP для Excel для подключения к службам Analysis Services
- Аннотация
- Дополнительные сведения
- Analyze in Excel
- Prerequisites
- Browse using the Default and Internet Sales perspectives
- To browse by using the Default perspective
- To browse by using the Internet Sales perspective
- Browse by using roles
- To browse by using the Sales Manager user role
- Connect to a SQL Server Analysis Services Database (Import)
- Connect to SQL Server Analysis Services
- Firewall and permissions
- Connect using SQL Server Management Studio (SSMS)
- Connect using Excel
- Connect using Visual Studio
- Test connections
Настройка поставщика данных MSOLAP для Excel для подключения к службам Analysis Services
В этой статье описывается настройка правильного поставщика данных MSOLAP для Excel для подключения к службам Analysis Services.
Исходная версия продукта: SQL Server 2017 Корпоративная, SQL Server 2016 Корпоративная, SQL Server 2014 Корпоративная, SQL Server 2012 Корпоративная, SQL Server 2008 Корпоративный
Исходный номер базы знаний: 4488253
Аннотация
Чтобы создать подключение к данным к источнику данных служб Analysis Services, Microsoft Excel использует поставщик OLE DB служб Microsoft Analysis Services для Microsoft SQL Server (MSOLAP). Каждая версия служб Analysis Services имеет собственную версию поставщика MSOLAP. В следующей таблице перечислены версии службы Analysis Services и их соответствующая версия поставщика MSOLAP.
| Версия служб Analysis Services | Версия поставщика MSOLAP |
|---|---|
| SQL Server 2008 | MSOLAP.4 |
| SQL Server 2012 | MSOLAP.5 |
| SQL Server 2014 | MSOLAP.6 |
| SQL Server 2016 | MSOLAP.7 |
| SQL Server 2017 и более поздних версий | MSOLAP.8 (считается evergreen) |
Дополнительные сведения о MSOLAP и других клиентских библиотеках для служб Analysis Services см. в клиентских библиотеках служб Analysis Services.
Дополнительные сведения об использовании правильной версии MSOLAP см. в свойствах строки подключения. Сведения о устаревших версиях MSOLAP см. в статье «Как получить последние версии MSOLAP». Последнюю версию MSOLAP см. в клиентских библиотеках служб Analysis Services.
В Excel используется версия поставщика MSOLAP, установленная на клиентском устройстве. В следующем примере Excel настроит MSOLAP.5 в качестве поставщика данных в строке подключения к данным.
На клиентском устройстве, на котором установлено несколько версий поставщика MSOLAP, Excel использует версию, настроенную в реестре.
Например, в следующем сценарии:
- В реестре установлено и настроено приложение MSOLAP.5.
- Вы установили MSOLAP.6 на устройстве для подключения к Analysis Services 2014, но не обновили реестр для ссылки на MSOLAP.6.
Excel настроит подключение для использования MSOLAP.5 в строке подключения. Это вызывает проблемы, так как вы не можете использовать версии MSOLAP, предшествующие версии источника данных.
Дополнительные сведения
Чтобы указать версию MSOLAP, которую использует Excel, обновите версию в разделах реестра. Следующие ключи определяют, какую версию MSOLAP Excel использует для подключения к службам Analysis Services. Расположение раздела реестра зависит от того, является ли Microsoft Office установкой MSI или «нажми и запускай» (C2R), а также от того, является ли он 32-разрядным или 64-разрядным.
32-разрядная версия MSI Office
64-разрядная версия Office MSI
Office 32-разрядная версия C2R
Office 64-разрядная версия C2R
Ниже приведен пример 32-разрядной версии Office C2R, настроенной для использования MSOLAP.5:

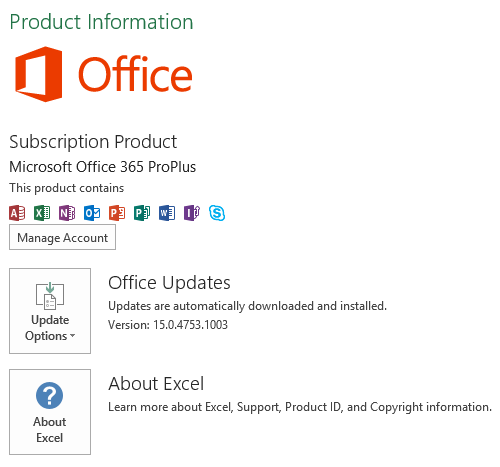
Чтобы определить, является ли ваша установка MSI или C2R, в Excel перейдите к учетной записи файла>. Если вы видите раздел office Обновления, установка будет C2R:
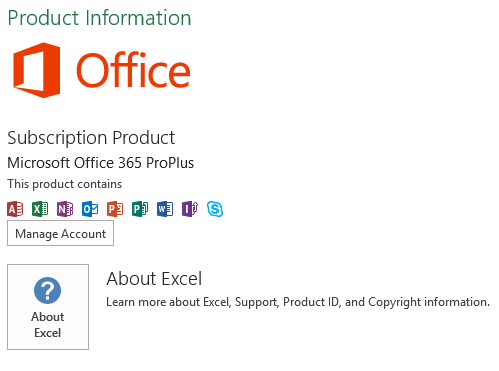
Если раздел office Обновления, это установка MSI:
Чтобы определить, является ли Excel 32-разрядным или 64-разрядным, щелкните «О Программе Excel » на том же экране «Учетные записи», и в верхней части окна отобразится диалоговое окно:
Источник
Analyze in Excel
Applies to:  SQL Server 2019 and later Analysis Services Azure Analysis Services Power BI Premium
In this lesson, you use the Analyze in Excel feature to open Microsoft Excel, automatically create a connection to the model workspace, and automatically add a PivotTable to the worksheet. The Analyze in Excel feature is meant to provide a quick and easy way to test the efficacy of your model design prior to deploying your model. You do not perform any data analysis in this lesson. The purpose of this lesson is to familiarize you, the model author, with the tools you can use to test your model design.
To complete this lesson, Excel must be installed on the same computer as Visual Studio.
Estimated time to complete this lesson: 5 minutes
Prerequisites
This article is part of a tabular modeling tutorial, which should be completed in order. Before performing the tasks in this lesson, you should have completed the previous lesson: Lesson 11: Create roles.
Browse using the Default and Internet Sales perspectives
In these first tasks, you browse your model by using both the default perspective, which includes all model objects, and also by using the Internet Sales perspective you created earlier. The Internet Sales perspective excludes the Customer table object.
To browse by using the Default perspective
Click Extensions > Model > Analyze in Excel.
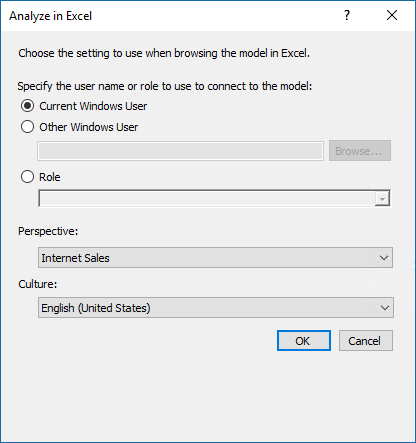
In the Analyze in Excel dialog box, click OK.
Excel opens with a new workbook. A data source connection is created using the current user account and the Default perspective is used to define viewable fields. A PivotTable is automatically added to the worksheet.
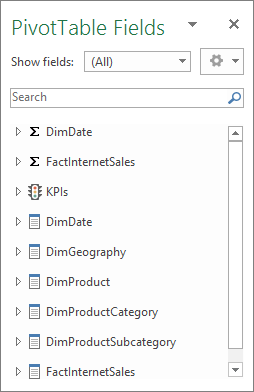
In Excel, in the PivotTable Field List, notice the DimDate and FactInternetSales measure groups appear. The DimCustomer, DimDate, DimGeography, DimProduct, DimProductCategory, DimProductSubcategory, and FactInternetSales tables with their respective columns also appear.
Close Excel without saving the workbook.
To browse by using the Internet Sales perspective
Click Extensions > Model > Analyze in Excel.
In the Analyze in Excel dialog box, leave Current Windows User selected, then in the Perspective drop-down listbox, select Internet Sales, and then click OK.
In Excel, in PivotTable Fields, notice the DimCustomer table is excluded from the field list.
Close Excel without saving the workbook.
Browse by using roles
Roles are an important part of any tabular model. Without at least one role to which users are added as members, users cannot access and analyze data using your model. The Analyze in Excel feature provides a way for you to test the roles you have defined.
To browse by using the Sales Manager user role
Click Extensions > Model > Analyze in Excel.
In Specify the user name or role to use to connect to the model, select Role, and then in the drop-down listbox, select Sales Manager, and then click OK.
Excel opens with a new workbook. A PivotTable is automatically created. The Pivot Table Field List includes all the data fields available in your new model.
Источник
Connect to a SQL Server Analysis Services Database (Import)
You can create a dynamic connection between an Excel workbook and a SQL Server Analysis Services Online Analytical Processing (OLAP) database server, then refresh that connection whenever the data changes. You can connect to a specific offline cube file if it has been created on the database server. You can import data into Excel as either a Table or a PivotTable report.
Use Excel’s Get & Transform (Power Query) experience to connect to a SQL Server Analysis Services (OLAP) database server.
Click the Data tab, then Get Data > From Database > From SQL Server Analysis Services Database (Import). If you don’t see the Get Data button, then click New Query > From Database > From SQL Server Analysis Services Database.
Input the Server name and press OK.
Note: You have the option of entering a specific database name, and you can add an MDX or DAX query.
In the Navigator pane select the database, then the cube or tables you want to connect.
Click Load to load the selected table, or click Edit to perform additional data filters and transformations before loading it.
In Excel 2010 and 2013, there are two methods of creating a connection to a SQL Server Analysis Services (OLAP) database. The recommended method is to use Power Query, which is available if you download the Power Query add-in. If you can’t download Power Query, you can use the Data Connection Wizard.
In the Power Query ribbon, click From Database > From SQL Server Analysis Services Database.
Input the Server name and press OK.
Note: You have the option of entering a specific database name, and you can add an MDX or DAX query.
In the Navigator pane select the database, then the cube or tables you want to connect.
Click Load to load the selected table, or click Edit to perform additional data filters and transformations before loading it.
Data Connection Wizard
On the Data tab, in the Get External Data group, click From Other Sources, and then click From Analysis Services.
In the Data Connection Wizard, enter the Server name, and select a login option. Click Next.
 Connect to server» loading=»lazy»>
Select the database and table or cube that you want to connect to, then click Next.
 Select database and table» loading=»lazy»>
Enter a name and description for the new connection, and press Finish to save it.
 Save data connection file and finish» loading=»lazy»>
In the Import Data dialog, select an option for how you want the data to be retrieved, and where you want to place the it. Beginning with Excel 2013, you also have the option to save the data to the Data Model.
 Import data» loading=»lazy»>
Источник
Connect to SQL Server Analysis Services
Applies to: SQL Server Analysis Services  Azure Analysis Services Power BI Premium
This article describes connecting to an instance of SQL Server Analysis Services (SSAS) using common tools and applications. This article also explains how to connect under different user identities for testing purposes.
To learn about connecting to Azure Analysis Services, see Connecting to server resources
To learn about connecting to Power BI Premium workspaces, see Connecting to a Premium workspace
Firewall and permissions
Successful connections to SSAS depend on a valid port configuration and appropriate user permissions. Click the following links to learn more about each requirement.
The client libraries required by client applications cannot connect to Analysis Services through proxy servers that require a username and password.
Connect using SQL Server Management Studio (SSMS)
Connect to Analysis Services in SSMS to manage server instances and databases interactively. You can also run XMLA or MDX queries to perform administrative tasks or retrieve data. In contrast with other tools and applications that only load databases when a query is sent, SSMS loads all databases when you connect to the server, assuming you have permission to view the database. This means that if you have numerous tabular databases on the server, all are loaded into system memory when you connect using SSMS.
You can test permissions by running SSMS under a specific user identity and then connect to Analysis Services as that user.
Hold-down the Shift key and right-click the SQL Server Management Studio shortcut to access the Run as different user option.
Start SQL Server Management Studio. In the Connect to Server dialog box, select the SQL Server Analysis Services server type.
In the Login tab, enter the server name by typing the name of the computer on which the server is running. You can specify the server using its network name or a fully-qualified domain name.
For a named instance, the server name must be specified in this format: servernameinstance name. An example of this naming convention might be ADV-SRV062Finance for a server that has a network name of ADV-SRV062, where Analysis Services was installed as a named instance entitled Finance.
For servers deployed in a failover cluster, connect using the network name of the SSAS cluster. This name is specified during SQL Server setup, as SQL Server Network Name. Note that if you installed SSAS as a named instance onto a Windows Server Failover Cluster (WSFC), you never add the instance name on the connection. This practice is unique to SSAS; in contrast, a named instance of a clustered relational database engine does include the instance name. For example, if you installed both SSAS and the database engine as named instance (Contoso-Accounting) with a SQL Server Network Name of SQL-CLU, you would connect to SSAS using «SQL-CLU» and to the database engine as «SQL-CLUContoso-Accounting». See How to Cluster SQL Server Analysis Services for more information and examples.
For servers deployed in a network load balanced cluster, connect using the virtual server name of the NLB.
Authentication is always Windows authentication, and the user identity is always the Windows user who is connecting via Management Studio.
In order for the connection to succeed, you must have permission to access the server or a database on the server. Most tasks that you want to perform in Management Studio require administrative permissions. Ensure that the account you are connecting with is a member of the Server Administrator role. For more information, see Grant server admin rights to an Analysis Services instance.
Click Connection Properties to specify a particular database, set timeout values, or encryption options. Optional connection information includes connection properties used for the current connection only.
Click Additional Connection Parameters tab to set connection properties not available in the Connect to Server dialog box. For example, you might type Roles=Reader in the text box.
Connecting through a role with less permission lets you test database behaviors when that role is in effect.
Connect using Excel
Microsoft Excel is often used for analyzing business data. As part of an Excel installation, Office installs the Analysis Services OLE DB provider (MSOLAP DLL), ADOMD.NET, and other data providers so that you can more readily use the data on your network servers. If you are using a newer version of SQL Server Analysis Services with an older version of Excel, you most likely need to install newer client libraries on each workstation that connects to SQL Server Analysis Services. To learn more, see Client libraries.
When you set up a connection to an Analysis Services cube or tabular model database, Excel saves the connection information in .odc file for future use. The connection is made in security context of the current Windows user. The user account must have read permissions on the database in order for the connection to succeed.
When using SQL Server Analysis Services data in an Excel workbook, connections are held for the duration of a query request. This is why you are likely to see lots of connections for each session, held for very short periods of time, when monitoring a query workload from Excel.
You can test permissions by starting Excel under a specific user identity.
Hold-down the Shift key and right-click the Excel shortcut to access the Run as different user option.
On the Data tab in Excel, click From Other Sources, and then click From Analysis Services. Enter the server name, and then select a cube or perspective to query.
For servers deployed in a load-balanced cluster, use the virtual server name assigned to the cluster.
When setting up a connection in Excel, on the last page of the Data Connection Wizard, you can specify authentication settings for Excel Services. These settings are used to set properties on the workbook should you upload it to a SharePoint server that has Excel Services. The settings are used in data refresh operations. Options include Windows Authentication, Secure Store Service (SSS), and None.
Avoid using None. Analysis Services does not let you specify a user name and password on the connection string unless you are connecting to a server that has been configured for HTTP access. Similarly, do not use SSS unless you already know that the SSS target application ID is mapped to a set of Windows user credentials that have user access to the Analysis Services databases. For most scenarios, using the default option of Windows authentication is the best choice for an Analysis Services connection from Excel.
Connect using Visual Studio
Visual Studio with Analysis Services projects is used for building BI solutions. When building reports or packages, you might need to specify a connection to Analysis Services.
The following links explain how to connect to Analysis Services from a Report Server project or an Integration Services project:
When using Visual Studio to work on an existing Analysis Services project, remember that you can connect offline using a local or version controlled project, or connect in online mode to update Analysis Services objects while the database is running. For more information, see Connect in Online Mode to an Analysis Services Database. More commonly, connections from SQL Server Data Tools are in project mode, where changes are deployed to the database only when you explicitly deploy the project.
Test connections
Use SQL Server Profiler to monitor connections to Analysis Services. The Audit Login and Audit Logout events provide evidence of a connection. The identity column indicates the security context under which the connection is made.
Start SQL Server Profiler on the Analysis Services instance and then start a new trace.
In Events Selection, verify that Audit Login and Audit Logout are checked in the Security Audit section.
Connect to Analysis Services via an application service (such as SharePoint or Reporting Services) from a remote client computer. The Audit Login event will show the identity of the user connecting to Analysis Services.
Connection errors are often traced to an incomplete or invalid server configuration. Always check server configuration first:
Ping the server from a remote computer to ensure it allows remote connections.
Firewall rules on the server allow inbound connections from clients in the same domain
With the exception of Power Pivot for SharePoint, all connections to a remote server require that you have configured the firewall to allow access to the port that Analysis Services is listening on. If you are getting connection errors, verify that the port is accessible and that user permissions are granted to the appropriate databases.
To test, use Excel or SSMS to on a remote computer, specifying the IP address and port used by the Analysis Services instance. If you can connection, the firewall rules are valid for the instance and the instance allows remote connections.
Also, when using TCP/IP for the connection protocol, remember that Analysis Services requires client connections originate from the same domain or a trusted domain. If connections flow across security boundaries, you will most likely need to configure HTTP access. For more information, see Configure HTTP Access to Analysis Services on Internet Information Services (IIS) 8.0.
Can you connect using some tools but not others? The problem might be the wrong version of a client library. You can get client libraries from the SQL Server Feature Pack download page.
Resources that can help you resolve connection failures include the following:
Resolving Common Connectivity Issues in SQL Server 2005 Analysis Services Connectivity Scenarios. This document is a few years old, but the information and methodologies still apply.
Источник
| title | description | author | ms.service | ms.topic | ms.date | ms.author | ms.reviewer |
|---|---|---|---|---|---|---|---|
|
Learn how to connect to Azure Analysis Services with Excel | Microsoft Docs |
Learn how to connect to an Azure Analysis Services server by using Excel. Once connected, users can create PivotTables to explore data. |
minewiskan |
analysis-services |
conceptual |
01/24/2023 |
owend |
minewiskan |
Connect with Excel
This article describes connecting to an Azure Analysis Services resource by using the Excel desktop app. Connecting to an Azure Analysis Services resource is not supported in Excel for the web or Excel for Mac.
Before you begin
The account you sign in with must belong to a model database role with at least read permissions. To learn more, see Authentication and user permissions.
Connect in Excel
Connecting to a server in Excel is supported by using Get Data in Excel 2016 and later. Connecting by using the Import Table Wizard in Power Pivot is not supported.
-
In Excel, on the Data ribbon, click Get Data > From Database > From Analysis Services.
-
In the Data Connection Wizard, in Server name, enter the server name including protocol and URI. For example, asazure://westcentralus.asazure.windows.net/advworks. Then, in Logon credentials, select Use the following User Name and Password, and then type the organizational user name, for example nancy@adventureworks.com, and password.
[!IMPORTANT]
If you sign in with a Microsoft Account, Live ID, Yahoo, Gmail, etc., or you are required to sign in with multi-factor authentication, leave the password field blank. You are prompted for a password after clicking Next. -
In Select Database and Table, select the database and model or perspective, and then click Finish.


See also
Client libraries
Manage your server
Prefer Written Instructions?
How you connect to a cube in Excel depends on if you are connecting to a specific cube for the first time or if you have connected to the cube previously.
To connect to a cube for the first time:
1. Go to the Data Menu in Excel
2. Click the “Get Data” button on the far left
3. Hover over the “From Database” option and click “From Analysis Services”

After selecting “From Analysis Services,” the Data Connection Wizard will pop-up on your screen.
4. When the wizard appears, type in your server name
5. Select “Use Windows Authentication”
6. Then, click next

You will now be able to see all the databases you have access to as well as the individual cubes in each of those databases.
7. Select the database that contains the data you desire by using the drop-down window
8. Then click on the specific cube that you are interested in connecting to
9. Click next

10. The wizard will ask you to save the connection to the desktop. You may want to change the file name, location, and/or friendly name. However, for this demonstration, we’ll leave all the fields at their default settings and click “Finish.”

11. The “Import Data” dialog box will appear and prompt you to create a pivot table with the data you just connected to
12. Simply click “OK”
13. That’s it! Your data is now connected to Excel!

To open a cube you have previously connected to:
1. Go to the Data Menu
2. Click on existing connections
3. This will bring up a list of all the cubes you connected to previously. Select the cube you want to use and click “open.”

4. When the “Import Data” dialog box appears, hit okay
5. Your cube will now be connected to excel!

Although it is well-known how to create a tabular database in PowerPivot, it is less obvious that there are several useful options for retrieving SSAS tabular data into Excel. This provides an easy way of manipulating, visualizing and analyzing the data without needing to know the details of SSAS and the tabular model.
Until recently, most of the talk about tabular data revolved around PowerPivot, an Excel add-in that brings powerful in-memory data crunching to the spreadsheet environment. Creating a tabular database in PowerPivot, and by extension, within Excel, is a fairly prescribed process that involves retrieving data from one or more data sources-most notably SQL Server databases-and creating one or more tables based on that data.
Despite all the attention paid to PowerPivot and its tabular databases, there has been relatively little focus on how to retrieve tabular data directly from a SQL Server Analysis Services (SSAS) instance into Excel, whether through PowerPivot or directly into a workbook.
In this article, we explore how to use Excel to view and retrieve data from an SSAS tabular database. This is the third article in a series about SSAS tabular data. In the last article, “Using DAX to retrieve tabular data,” we discussed how to create Data Analysis Expressions (DAX) statements to retrieve tabular data, working from within SQL Server Management Studio (SSMS) to run our queries against an SSAS tabular instance. Some of what was covered in that article will apply to retrieving data from within Excel.
For this article, I provide a number of examples of how to import tabular data into Excel. The examples pull data from the AdventureWorks Tabular Model SQL 2012 database, available as a SQL Server Data Tools (SSDT) tabular project from the AdventureWorks CodePlex site. On my system, I’ve implemented the database on a local instance of SSAS 2012 in tabular mode.
Viewing Browsed Data in Excel
We got a taste of how to browse data from within SSMS in the first article of this series, “Getting Started with the SSAS Tabular Model.” In Object Explorer, right-click the database and then click Browse. When the Browse window appears, you can view a list of database objects and use those objects to retrieve data by dragging them into the main workspace. For example, Figure 1 shows data from the Country Region Name and City columns of the Geography table, as well as from the Internet Total Sales and Internet Total Units measures of the Internet Sales table.
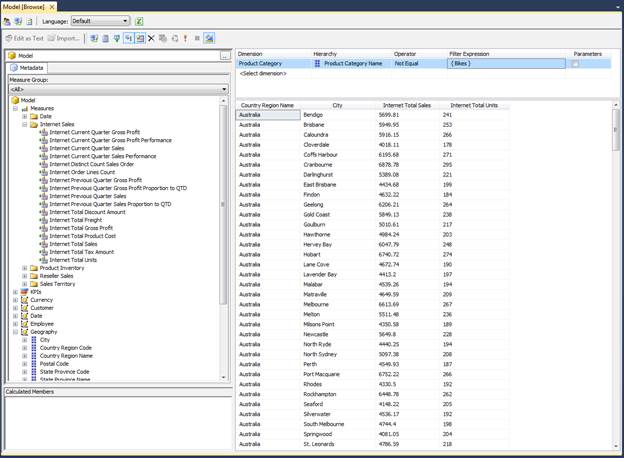
Figure 1: Browsing tabular data in SSMS
Notice in Figure 1 that I also created a filter that limits the amount of data returned. (You define filters in the small windows above the main workspace.) In this case, I eliminated all sales that include the value Bikes in the Category Name column of the Product table. This way, all non-bike merchandise is included in the sales figures.
What’s shown in Figure 1 is pretty much the extent of what you can do in the Browse window in SSMS. To be able to fully drill into the data, you need to use Excel. Starting with SQL Server 2012, Excel is now the de facto tool in SSMS and SSDT for analyzing tabular data. Unfortunately, that means you need Office 2003 or later installed on the same computer where SSMS and SSDT are installed, not a practical solution for everyone. Even so, having Excel installed makes analyzing tabular data a much easier process.
Part of that simplicity lies in the fact that the SSMS Browse window and the SSDT tabular project window both include the Analyze in Excel button on their respective menus. The button launches Excel and let’s you browse the tabular data from within in a pivot table.
When you first click the Analyze in Excel button, you must choose which perspective to open in Excel, as shown in Figure 2. As you might recall from the first article, a perspective represents all or part of the data model. The Model perspective includes all database components.
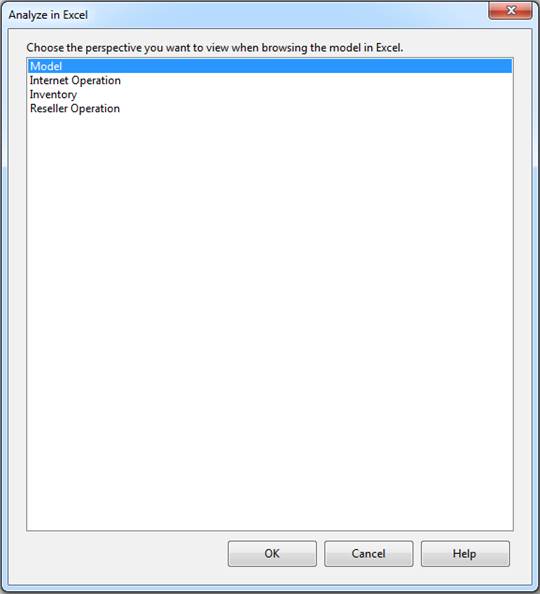
Figure 2: Selecting a perspective when sending data to Excel
Once you’ve selected a perspective, click OK. Excel is launched and opens to a new pivot table that automatically connects to the SSAS tabular data source. Figure 3 shows the pivot table before any data has been added. Notice in the right window you’ll find the PivotTable Field List pane, which contains a list of all your database objects, including tables, columns, and measures.
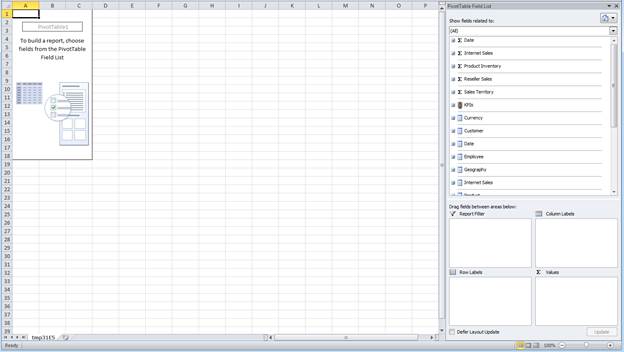
Figure 3: Importing tabular data into an Excel pivot table
To get started with the pivot table, drag the fields and measures you want to include in your report to the Column Labels, Row Labels, and Values panes. The data will then be displayed in the pivot table. You can also create filters by dragging fields to the Report Filter pane. Figure 4 shows the pivot table after I added numerous database objects. Many of these objects are the same columns and measures that were added to the Browse window shown in Figure 1, except that now I also break down the sales by years.
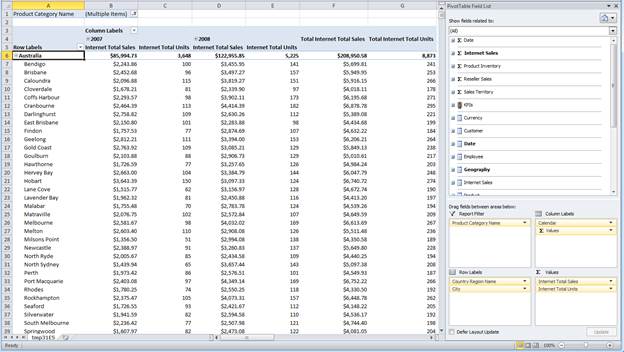
Figure 4: Working with tabular data in an Excel pivot table
To configure the pivot table shown in Figure 4, I added the following database objects to the specified configuration panes in the right window:
- The
Country Region Namecolumn from theGeographytable to theRow Labelspane. - The
Citycolumn from theGeographytable to theRow Labelspane. - The
Yearcolumn (from the Calendar hierarchy) of theDatetable to theColumn Labelspane. - The
Internet Total Salesmeasure from the Internet Salestable to theValuespane. - The
Internet Total Unitsmeasure from theInternet Salestable to theValuespane. - The
Product Category Namecolumn from theProducttable to theReport Filterpane.
Once you’ve set up your pivot table, you can play around with the data however you want. For example, you can drill down into the year values or view only the country totals without viewing the cities. You can also find rollups for each category of data. Plus, you can filter data based on the values in the Product Category Name column. Keep in mind, however, that this article is by no means a tutorial on how to work with Excel pivot tables. For that, you need to check out the Excel documentation. SSMS and SSDT make it easy to view the data in Excel, but it’s up to you to derive meaning from what you find.
Importing Data into an Excel Pivot Table
Not everyone will have SSMS or SSDT installed on their systems, but they might still need to access an SSAS instance to retrieve tabular data. In that case, they can establish their own connection to the tabular database (assuming they have the necessary permissions) and import the data into a pivot table, just as we saw above.
To connect to a tabular database from within Excel, go to the Data tab, click the From Other Sources button, and then click From Analysis Services. When the Data Connection Wizard appears, type the instance name and any necessary logon credentials, as shown in Figure 5. (In my case, I used Windows Authentication.)
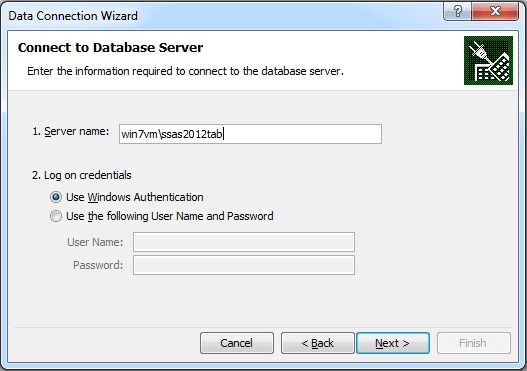
Figure 5: Connecting to an SSAS instance in tabular mode
Click Next to advance to the Select Database and Table page, shown in Figure 6. Here you select the database you want to connect to and the specific perspective. Once again, I’ve selected Model in order to retrieve all the database components. (As you’ve probably noticed, Microsoft is somewhat inconsistent in its interfaces when it comes to referring to perspectives in a tabular database. Sometimes they’re referred to as cubes, sometimes perspective, and sometimes Model is referred to as a cube and the other components as perspectives. I’m not sure how Table fits into the picture.)
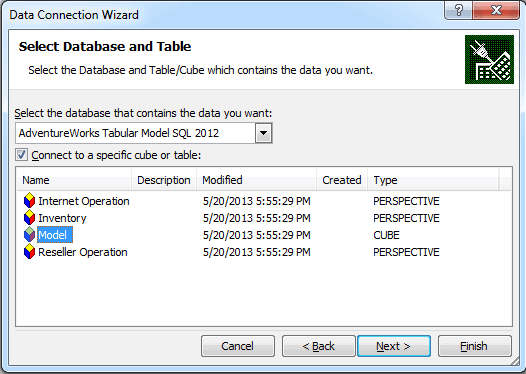
Figure 6: Selecting a perspective when connecting to tabular data
After you’ve selected your database and perspective, click Next to advance to the Save Data Connection File and Finish page, shown in Figure 7. Here you can provide a name for the data connection file (an .odc file), a description of the connection, and a friendly name for the connection.
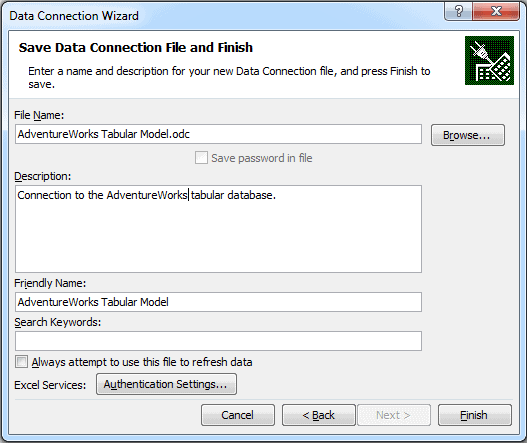
Figure 7: Creating a data connection file in Excel
Once you’ve supplied the necessary information, click Finish. You’ll then be presented with the Import Data dialog box, as shown in Figure 8. You can choose whether to create a pivot table, a pivot table and pivot chart, or the data connection only. You can also choose to use the existing worksheet or open a new one.
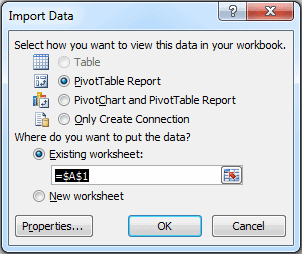
Figure 8: Importing tabular data into a pivot table
You might have noticed that the Table option is grayed out. When importing tabular data in this way, Excel is very picky. Either you use a pivot table (and pivot chart, if you want) or nothing at all. You cannot import the data into a set of tables. However, there is a way to work around the default behavior, which we cover in the following section.
But for now, stick with the default options (those shown in Figure 8), and click OK. You’ll then be presented with a new pivot table and the PivotTable Field List pane, with all the tables and their columns and measures listed, similar to what is shown in Figure 3. You can then work with that data to create a report just like we did earlier.
Using DAX to Import Data into Excel
To import tabular data into a regular Excel table, rather than a pivot table, we can create a DAX expression that pulls in exactly the data we need. We start by creating a data connection, just as we did in the last section. Once again, launch the Data Connection Wizard and follow the prompts. When you get to the Save Data Connection File and Finish page, provide a file name, description, and friendly name. But keep all the names simple because we’ll be referencing them later in the process and we want to make sure everything is easy to find. Figure 9 shows the names I used to set up the data connection on my system.
Figure 9: Creating a data connection file in Excel
When you click Finish, you’ll again be presented with the Import Data dialog box. This time around, select the option Only Create Connection, as shown in Figure 10. We don’t want to pull in any data just yet. We just want to establish how we’ll be connecting to the tabular database. Click OK to finish creating the connection.
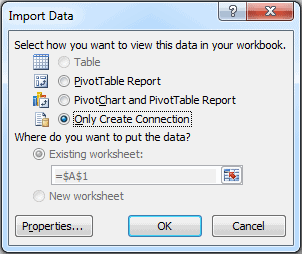
Figure 10: Creating a data connection without creating a pivot table
The next step is to locate the data connection file we just created so we can edit it. On my system, I had named the file aw_query.odc, and I found it in the My Documents/My Data Sources folder associated with my user account.
When editing the connection file, which we can do in Notepad, we want to modify the default settings so we can use a DAX query to retrieve the data. To achieve this, we need to modify two lines, the CommandType and CommandText elements, which are highlighted in the following HTML:
|
1 2 3 4 5 6 7 8 9 10 11 12 13 14 15 16 17 18 19 20 21 22 23 24 25 26 27 28 29 30 31 32 33 |
<head> <meta http—equiv=Content—Type content=«text/x—ms—odc; charset=utf—8«> <meta id=«ProgId« content=ODC.Cube> <meta id=«SourceType« content=OLEDB> <meta id=«Catalog« content=«AdventureWorks Tabular Model SQL 2012«> <meta id=«Table« content=Model> <title>AdventureWorks query</title> <xml id=«docprops><o:DocumentProperties«> xmlns:o=«urn:schemas—microsoft—com:office:office« xmlns=«http://www.w3.org/TR/REC—html40«> <o:Description>Generate DAX statement to retrieve table from AdventureWorks database.</o:Description> <o:Name>AdventureWorks query</o:Name> </o:DocumentProperties> </xml> <xml id=«msodc><odc:OfficeDataConnection«> xmlns:odc=«urn:schemas—microsoft—com:office:odc« xmlns=«http://www.w3.org/TR/REC—html40«> <odc:Connection odc:Type=«OLEDB«> <odc:ConnectionString>Provider=MSOLAP.4;Integrated Security=SSPI;Persist Security Info=True;Data Source=win7vmssas2012tab;Initial Catalog=AdventureWorks Tabular Model SQL 2012</odc:ConnectionString> <odc:CommandType>Cube</odc:CommandType> <odc:CommandText>Model</odc:CommandText> </odc:Connection> </odc:OfficeDataConnection> </xml> <style> <!— .ODCDataSource { behavior: url(dataconn.htc); } —> </style> </head> |
The HTML shown here is the head section of the data connection file. For the CommandType element, replace the value Cube with the value query. This tells Excel to let us pass a query in through our data connection, rather than having to identify a specific perspective.
For the CommandText element, replace the value Model with a DAX statement that retrieves data into a single result set. For this example, I pulled the following query from the last article in this series (so return to that article for an explanation):
|
1 2 3 4 5 6 7 8 9 10 11 12 13 14 15 16 17 18 19 20 21 22 23 |
evaluate ( filter ( addcolumns ( summarize ( ‘Internet Sales’, ‘Product’[Product Name], ‘Product Subcategory’[Product Subcategory Name], ‘Product Category’[Product Category Name], ‘Date’[Calendar Year] ), «Total Sales Amount«, calculate(sum(‘Internet Sales’[Sales Amount])), «Total Cost«, calculate(sum(‘Internet Sales’[Total Product Cost])) ), ‘Date’[Calendar Year] > 2006 ) ) order by ‘Product’[Product Name], ‘Date’[Calendar Year] |
You can use a different query, of course, whatever serves your needs. The goal is to retrieve the data into a single table that you can view in an Excel worksheet, just like any other worksheet. After you modify the HTML in the data connection file, the head section should look similar to the following:
|
1 2 3 4 5 6 7 8 9 10 11 12 13 14 15 16 17 18 19 20 21 22 23 24 25 26 27 28 29 30 31 32 33 34 35 36 37 38 39 40 41 42 43 44 45 46 47 48 49 50 51 52 53 54 55 56 57 |
<head> <meta http—equiv=Content—Type content=«text/x—ms—odc; charset=utf—8«> <meta id=«ProgId« content=ODC.Cube> <meta id=«SourceType« content=OLEDB> <meta id=«Catalog« content=«AdventureWorks Tabular Model SQL 2012«> <meta id=«Table« content=Model> <title>AdventureWorks query</title> <xml id=«docprops><o:DocumentProperties«> xmlns:o=«urn:schemas—microsoft—com:office:office« xmlns=«http://www.w3.org/TR/REC—html40«> <o:Description>Generate DAX statement to retrieve table from AdventureWorks database.</o:Description> <o:Name>AdventureWorks query</o:Name> </o:DocumentProperties> </xml> <xml id=«msodc><odc:OfficeDataConnection«> xmlns:odc=«urn:schemas—microsoft—com:office:odc« xmlns=«http://www.w3.org/TR/REC—html40«> <odc:Connection odc:Type=«OLEDB«> <odc:ConnectionString>Provider=MSOLAP.4;Integrated Security=SSPI;Persist Security Info=True;Data Source=win7vmssas2012tab;Initial Catalog=AdventureWorks Tabular Model SQL 2012</odc:ConnectionString> <odc:CommandType>query</odc:CommandType> <odc:CommandText> evaluate ( filter ( addcolumns ( summarize ( ‘Internet Sales’, ‘Product’[Product Name], ‘Product Subcategory’[Product Subcategory Name], ‘Product Category’[Product Category Name], ‘Date’[Calendar Year] ), «Total Sales Amount«, calculate(sum(‘Internet Sales’[Sales Amount])), «Total Cost«, calculate(sum(‘Internet Sales’[Total Product Cost])) ), ‘Date’[Calendar Year] > 2006 ) ) order by ‘Product’[Product Name], ‘Date’[Calendar Year] </odc:CommandText> </odc:Connection> </odc:OfficeDataConnection> </xml> <style> <!— .ODCDataSource { behavior: url(dataconn.htc); } —> </style> </head> |
I highlighted the new code to make it easier to pick out. I also laid out the DAX statement so it’s more readable. However, you don’t need to break it apart in this way to add it into the file. (The parser ignores the extra whitespace and line breaks.)
After you save and close the data connection file, it’s time to verify what you’ve done. In Excel, go to the Data tab and click Existing Connections. When the Existing Connections dialog box appears, double-click the connection you just edited. It will be listed under its friendly name, not the file name. On my system, the connection’s friendly name is AdventureWorks query. This launches the Import Data dialog box, shown in Figure 11. Notice that this time around, the Table option is available and selected.
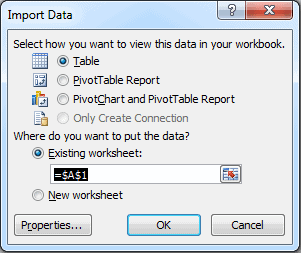
Figure 11: Importing tabular data into an Excel table
Click OK to close the Import Data dialog box. A table will appear, populated with the data retrieved through the DAX statement, as shown in Figure 11. You can then sort through the data and create any necessary filters.
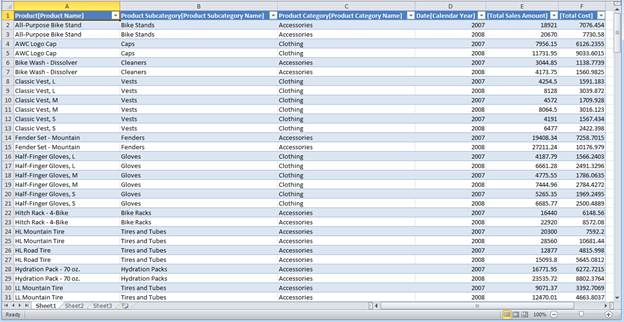
Figure 12: Working with tabular data in an Excel table
When you’re working in a table based on tabular data, you can modify the connection associated with the current workbook. Doing so, however, severs its relationship to the original .odc data connection file. Instead, your changes are saved to the connection specifically associated with that workbook. The .odc file remains unchanged. Updating the connection in this way lets you modify the DAX statement, change the connection string, or configure other properties.
To modify the workbook’s connection, go to the Data tab and click Connections. This launches the Workbook Connections dialog box, shown in Figure 13. Here you should find the connection you created earlier. On my system, this is AdventureWorks query.
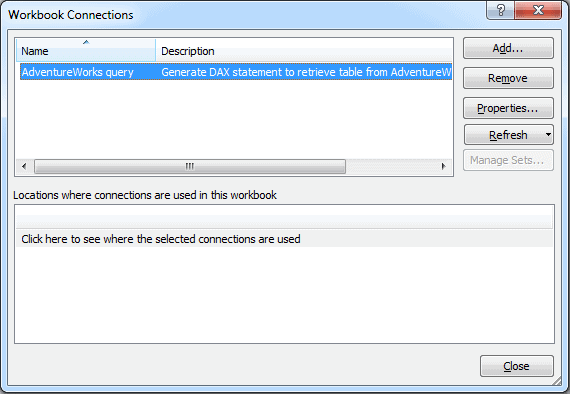
Figure 13: Viewing the data connections associated with an Excel workbook
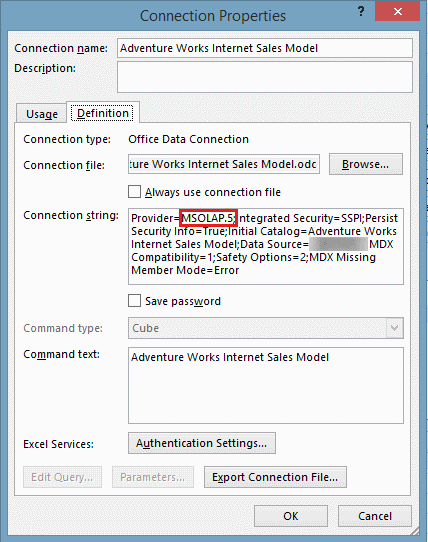
Next, we want to access the connection’s properties. Make sure the connection is selected (in case you have more than one connection listed), and then click Properties. This launches the Connection Properties dialog box. Go to the Definition tab and expand the dialog box as necessary to easily view the DAX statement. Figure 14 shows what the dialog box looks like on my system.
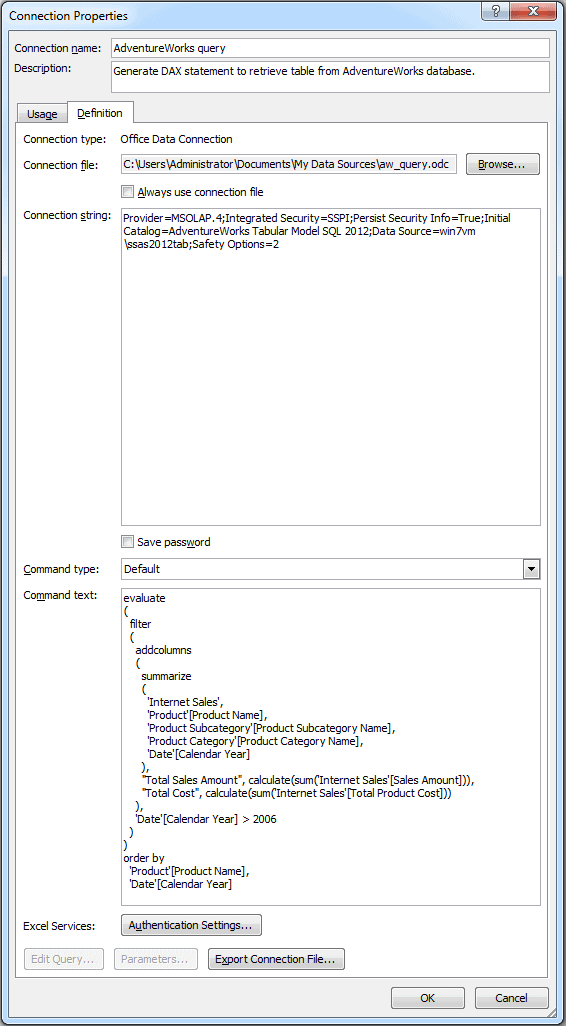
Figure 14: Viewing the properties of an Excel data connection
Chances are, when you open the dialog box, the DAX statement will be difficult to read. The statement shown in Figure 14 is what it looked like after I organized things a bit for readability. The changes I made have no impact on the statement itself.
You can modify the DAX statement or connection string as necessary (or any other properties, for that matter). To save you changes, click OK. You’ll then be presented with an Excel message box warning you that you are about to sever ties with the original data connection file, as shown in Figure 15. That’s not a problem, though, because your updated connection information will be saved with the workbook when you save it.
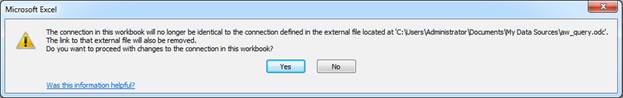
Figure 15: Severing ties between a data connection and its source file
You can now update you connection as often as you like. You should not receive this warning going forward. You can also use the existing .odc connection to easily add other tables to your workbook. To do so, add a new worksheet, connect to the data source via the .odc connection, and then modify the connection properties by adding a different DAX statement. (You can also rename the connection as necessary.) That way you can create a workbook that contains numerous worksheets that each includes an imported table from a tabular data source.
Using DAX to Import Data into PowerPivot
Up to this point, I’ve shied away from discussing PowerPivot in too great of detail, mostly because it’s already received so much press. But one issue that’s received little attention is how you retrieve data from an SSAS tabular instance into PowerPivot.
Surprisingly, the functionality is somewhat limited. You would expect-or at least I would expect-that I could import all the tables, along with their columns and measures, in a single connection, just as I can do with an Excel pivot table or a SQL Server database in PowerPivot. But that doesn’t appear to be the case. The only option I can find for importing tabular data directly into PowerPivot is one table at a time, just like we saw with Excel tables. However, doing so in PowerPivot is a bit easier.
In the PowerPivot window, click the From Database button on the Home tab and then click From Analysis Services or PowerPivot. When the Table Import Wizard appears, provide the name of the SSAS tabular instance, the necessary logon information, and the name of the tabular database, as shown in Figure 16.
Figure 16: Defining a data connection to an SSAS tabular database
Don’t forget, you can also provide a friendly connection name. And it’s always a good idea to test your connection. When you’re finished, click Next.
The next page in the wizard is Specify a MDX Query. As with SSMS or your Excel data connections, you can specify a DAX query rather than a Multidimensional Expressions (MDX) query. We’ll go with DAX. Figure 17 shows the page with the same query we used in the previous section. You can use the Validate option to check your statement, which seems to work with DAX, unlike the Design option, which seems happier sticking with MDX.
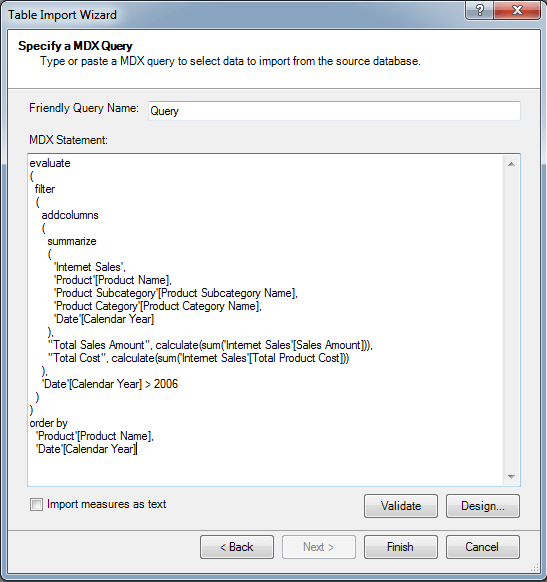
Figure 17: Defining a DAX query to retrieve tabular data from SSAS
After you entered your DAX query (and provided a name for the query, if you like), click Finish to import the data. During this process, you’ll advance to the wizard’s Importing page. If the data is imported with no problems, you should receive a Success message, as shown in Figure 18.
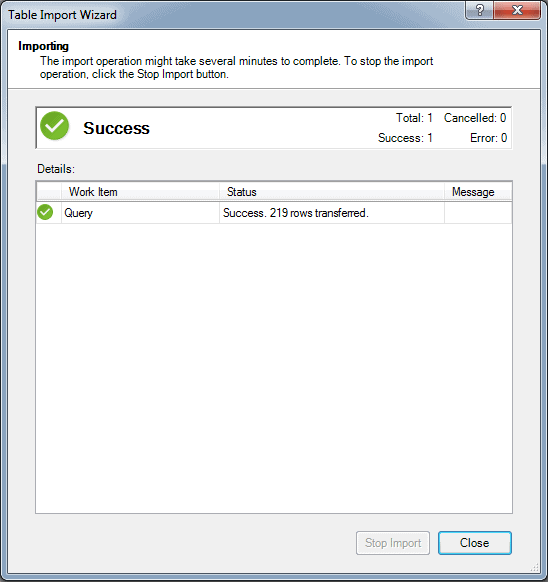
Figure 18: Successfully importing SSAS tabular data into PowerPivot for Excel
Click Close. This will open a new table in the PowerPivot window, with the imported data displayed. Figure 19 shows part of the data returned by the query. If the data is not exactly what you need, you can refine your query as necessary.
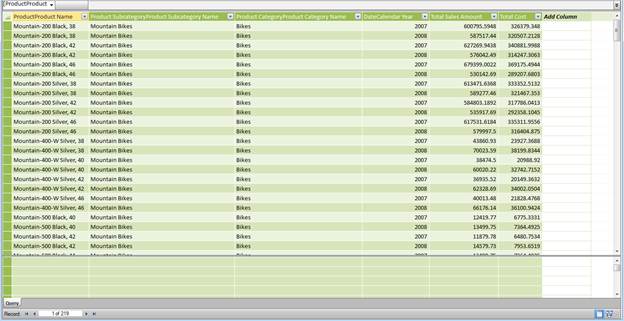
Figure 19: Working with tabular data in PowerPivot for Excel
You can import data into as many tables as you need. You can then create relationships between those tables, assuming you bring in the columns necessary to define those relationships. Not surprisingly, it would be handier to go directly to the source of the data, in this case, the AdventureWorksDW2012 database, so you can retrieve all the tables at once, along with their defined relationships. But you might not have access to that data and have no choice but to be retrieve it directly from the SSAS instance. Or there might be other circumstances that require you to retrieve the data directly from SSAS. Whatever the reason, you now know how it’s done, and once you’ve tried it out, you’ll find it’s a fairly simple operation.
The Excel Connection
As you’ve seen in this article, you have several options for retrieving SSAS tabular data into Excel. You can launch Excel from within SSMS or SSDT. You can import data directly into a pivot table. And you can generate DAX queries to retrieve data into individual Excel and PowerPivot tables. Or instead of DAX, you can generate MDX queries, unless the tabular database has been set up in DirectQuery mode. Regardless, you have a number of options for importing tabular data into Excel. And once you get it there, you have a rich environment for manipulating and analyzing the data, allowing you to create precise and detailed reports in the format you need when you need them, without having to be concerned about SSAS and how the tabular model works.
|
Михаил Л Пользователь Сообщений: 2639 |
Добрый день. Интересует подключение книги Excel с моделью данных к локальному серверу. на видео с облака , начиная с 8 мин 20 сек подключиться к аналитическим службам, но не получается. Чего не хватает? Может, сначала надо локальный сервер настроить или базу данных в виде .cub где нибудь скачать? Не знаю что нужно еще? Уже и виндовс10-64 и последние версии sql server, ssms установил. Изменено: Михаил Л — 10.06.2020 16:34:08 |
|
Михаил Л Пользователь Сообщений: 2639 |
#2 11.06.2020 19:50:18
Набрал в cmd — окне : osql -L НА МЯСО В ПРОФИЛЕ |
||
|
Андрей VG  Пользователь Сообщений: 11878 Excel 2016, 365 |
Доброе время суток sql.ru . Я понимаю, что у них там жесть… Но всё же. Тут такие зубры не ходят, а если ходят, то не вникают. |
|
Михаил Л Пользователь Сообщений: 2639 |
#4 11.06.2020 20:13:37
Ну мало ли) НА МЯСО В ПРОФИЛЕ |
||
|
БМВ  Модератор Сообщений: 21376 Excel 2013, 2016 |
#5 11.06.2020 20:46:49 Off
не люблю видео. Часто надо знать момент длительностью 2 сек, но чтоб его найти …. По вопросам из тем форума, личку не читаю. |
||
|
Михаил Л Пользователь Сообщений: 2639 |
#6 11.06.2020 21:09:02
Пользуюсь, в основном, MPC. Оставляю закладки на важных моментах НА МЯСО В ПРОФИЛЕ |
||
|
DrillPipe  Пользователь Сообщений: 342 |
При установке сервера должен быть установлен компонент Analysis Services – также известен как SSAS. https://pandia.ru/text/80/452/84071.phphttps://m.habr.com/ru/post/67731/ |
|
Михаил Л Пользователь Сообщений: 2639 |
#8 12.06.2020 17:59:11
Спасибо за советы. Начал скачивать Sql Server Data Tools через Visual Studio. Правда с моей скоростью интернета скачивание 1.8гб займет день-два. Потом продолжу тему НА МЯСО В ПРОФИЛЕ |
||
|
Михаил Л Пользователь Сообщений: 2639 |
#9 17.06.2020 18:22:34
Вообщем на одном компе не получилось скачать Visual Studio. На другом смог установить Data tools, но по ссылке все получается до этого момента — «Для проверки правильности создания измерения необходимо нажать кнопку обработки». По нажатии кнопки опять выходит сообщение что не удалось подключиться к серверу. Не пойму разве нет возможности скачать файл в расширении .cube и подключится к нему из ssms? Неужто всем, кому нужна многомерная база, приходится устанавливать несколько программ и все настраивать? Изменено: Михаил Л — 17.06.2020 18:29:24 НА МЯСО В ПРОФИЛЕ |
||
|
Андрей VG Пользователь Сообщений: 11878 Excel 2016, 365 |
#10 17.06.2020 18:49:19
Михаил, правильно ли я понимаю, что речь идёт про SQL Server Express Advanced? Если да, то Analysis Services вы к нему не подключите. Уж лучше ставьте SQL Server Developer Edition. |
||
|
Михаил Л Пользователь Сообщений: 2639 |
#11 17.06.2020 19:14:24
Да, по ссылке в раскрывающемся списке «Сведения» с объемом 1.1 гб. https://www.microsoft.com/ru-RU/download/details.aspx?id=42299 Надеюсь с выбором не промахнулся — ru_sql_server_2014_developer_edition_with_service_pack_3_x86_dvd Изменено: Михаил Л — 17.06.2020 19:38:45 НА МЯСО В ПРОФИЛЕ |
||
|
Андрей VG Пользователь Сообщений: 11878 Excel 2016, 365 |
#12 17.06.2020 19:40:21
По этой ссылке Express 2014 — нет там этого сервиса. SQL Server 2019 Developer . Выбираете кнопку Developer. |
||
|
Михаил Л Пользователь Сообщений: 2639 |
Андрей VG, а 2014 версии будет ли достаточно? У меня Windows 32 разрядный. ссылка У меня скорость интернета мала(30кб/сек). Через бинарный загрузчик два дня ждал загрузки Visual Studio и не дождался. Мне бы ссылку для Download master или Торрента. Изменено: Михаил Л — 17.06.2020 20:01:29 |
|
DrillPipe Пользователь Сообщений: 342 |
Михаил Л, инструмент тут https://www.sqlbi.com/tools/ |
|
Михаил Л Пользователь Сообщений: 2639 |
#15 18.06.2020 10:01:12
Не обязательно, но вот попалось мне это видео и захотел повторить. Далее к серверу подключается книга xlsx с моделью данных как база и с ней можно работать из ssms. На скринах наглядно Прикрепленные файлы
Изменено: Михаил Л — 18.06.2020 13:41:53 НА МЯСО В ПРОФИЛЕ |
||
|
vlad000  Пользователь Сообщений: 125 |
#16 18.06.2020 17:34:29
Пробовали с админ правами? |
||
|
Михаил Л Пользователь Сообщений: 2639 |
vlad000,сейчас проверить не смогу — все снес и качаю Developer. Изменено: Михаил Л — 18.06.2020 18:53:02 |
|
Михаил Л Пользователь Сообщений: 2639 |
#18 19.06.2020 12:54:16
Установил Developer. В итоге имеется сервер Analysis Services, но нет опции — Восстановить из PowerPivot… . И не видит файлы .xlsx НА МЯСО В ПРОФИЛЕ |
||