
- 1.ROI в CPA-маркетинге — это…
- 1.1.Формула расчёта
- 2.Что влияет на ROI
- 2.1.Как ещё поднять ROI
- 3.Excel всемогущий
- 4.Какой ROI считать нормой
- 5.Когда останавливать трафик
- 6.Как «правильно» считать ROI в арбитраже
- 6.1.На самом деле
ROI — один из главных показателей в арбитраже трафика, уступающий по важности только профиту.
После запуска рекламной кампании именно ROI является той путеводной звездой, которая ведёт веб-мастера к заработку. И от того, насколько ярко эта звезда горит, зависят все дальнейшие действия арбитражника: будь то увеличение оборотов, переделка креативов, смена подхода или остановка трафика.
ROI надо считать всегда, везде и быстро. Сложного в этом ничего нет, поэтому приступим сначала к теории, а потом и практику попрактикуем.
ROI (от английского return on investment) — это финансовый коэффициент рентабельности инвестиций, иллюстрирующий уровень доходности или убыточности рекламной кампании.
Формула расчёта
Показатель ROI является отношением суммы прибыли за вычетом инвестиций к сумме инвестиций. Обычно ROI выражается в процентах. В виде формулы это выглядит так:
ROI = ( Доход − Затраты ) / Затраты × 100, где
- Доход — это вознаграждение, начисленное в CPA-сети по результатам работы рекламной кампании;
- Затраты — это все расходы, связанные с рекламной кампанией.
Давайте для примера рассчитаем ROI рекламы в паблике во ВКонтакте.
Дано:
- Стоимость рекламного поста — 200 руб.
- В CPA-сети начислили вознаграждение за лиды — 500 руб.
ROI = ( 500 − 200 ) / 200 × 100 = 150%

Выходит, что вложив в рекламу 200 руб. и заработав на этом 500 руб., мы получили возврат инвестиций в размере 150% или 300 руб. чистой прибыли, то есть слили в плюс.
Тут важно отметить, что ROI может принимать значения в диапазоне от −100% до плюс бесконечности. Отрицательные значения показателя говорят о том, что вознаграждение по итогам рекламной кампании оказалось меньше затрат на неё.
Например, если при стоимости поста в 200 руб. мы заработаем всего 100 руб., то расчёт будет таким:
ROI = ( 100 − 200 ) / 200 × 100 = −50%

Сразу видно, что в результате мы отбили лишь половину вложений и оказались в минусе.
Ещё существует ситуация под названием «слить в ноль». Она случается тогда, когда итоговый доход равен расходам — потратили 200 руб. и заработали 200 руб.
ROI = ( 200 − 200 ) / 200 × 100 = 0%

Хоть в твёрдой валюте, хоть в процентах профит в таком случае будет равен нулю.
Самое же страшное, что может произойти — это слить все деньги «в пельменную», не получив за свои труды ничего, кроме бесценного опыта.
ROI = ( 0 − 200 ) / 200 × 100 = −100%

ROI при этом примет своё наименьшее отрицательное значение — −100%.
Для слабонервных особ — это отличный повод впасть в депрессию и навсегда забыть об арбитраже трафика, а для опытных адвертов — лишь стимул хорошенько взбодриться, взять себя-тряпку в руки, проанализировать результат, устранить причину неудачи и лить дальше, но уже в плюс.
Для наглядности продублирую все варианты вместе:

Что влияет на ROI
Абсолютно всё. Да-да, я не шучу.
Поймите, ROI — это итоговый результат всей проделанной вами работы, поэтому каждый пункт в длинной цепочке слива неизбежно оказывает своё влияние на него:
- выбранная CPA-сеть;
- привлекательность креативов;
- скорость загрузки лендинга;
- время работы рекламной кампании;
- настроение сотрудников call-центра;
- и так далее, и тому подобное.
Отсюда вытекает очевидный вывод, что увеличить размер ROI можно тоже сто и одним способом:
- выбрать CPA-сеть с большими отчислениями или лучшим апрувом;
- протестировать новые креативы;
- скопировать лендинг на свой быстрый хостинг и адаптировать его под мобильные устройства;
- отключить рекламу в «мёртвое» для оффера время…
То есть сделать по сути совершенно обычные для арбитража вещи, но лучше, чем вчера, и получить в итоге завтра профит больше, чем сегодня.
Как ещё поднять ROI
Своими бесхитростными хитростями оптимизации рекламных кампании я поделюсь совсем скоро — в одной из следующих статей, — а пока «спалю» сайт, который гарантированно увеличит ваш ROI на 5–15%, в зависимости от того, с каким источником трафика вы сейчас работаете.
Сервис GetUniq — это настоящий «экономитель бюджета», который позволяет пополнять кабинеты рекламных сетей с выгодой до 20%.

В списке источников числятся такие «монстры» как ВКонтакте, myTarget, МаркетГид, Direct/ADVERT, Kadam, Recreativ, BodyClick, GetDirect и Airpush, поэтому уже сегодня вы можете зарегистрироваться в сервисе и начать покупать любимый трафик с приятной скидкой.
Excel всемогущий
Со временем вы обязательно научитесь быстро прикидывать ROI в уме, но для того, чтобы собрать точную статистику, вам всё же понадобится какой-то аналитический инструмент, например, Excel или любой его аналог.
Ролики на YouTube вам подробно расскажут об азах использования этого приложения, а я просто покажу, как должна выглядеть формула в ячейке расчёта ROI.

Ничего сложного, правда? Если есть необходимость, то этот файл вы можете скачать здесь: Excel / Numbers.
Какой ROI считать нормой
Заголовок немного провокационный, потому что никакой нормы тут нет и быть не может. Некоторых арбитражников вполне устраивает ROI в 20–30%, а кто-то работает исключительно по связкам с ROI от 100%.
Дьявол кроется в объёмах.
На малых оборотах работать с маленьким ROI «скучно» и опасно, потому что заработок невелик, а любое изменение в качестве трафика может из плюса сделать минус.
С большим бюджетом, напротив, можно позволить себе роскошь лить трафик по принципу «лишь бы в плюс», а компании останавливать у отметки чуть выше ноля.
Вот так это выглядит на практике…

Несмотря на то, что ROI во втором варианте в пять раз меньше, фактический профит получился вдвое больше. Именно поэтому адверты предпочитают работать на больших объёмах с массовыми офферами — на широкий гео и большую целевую аудиторию.
А вот, что по этому поводу говорит сухая статистика…

Когда останавливать трафик
Казалось бы, ответ очевиден: если сегодня идёт в плюс, но уже понятно, что завтра будет в минус, то пора останавливать.
Под «сегодня» и «завтра» можно понимать час, день или неделю, то есть тот временной промежуток, через который вы просматриваете и анализируете статистику.
Но хотел бы напомнить о том, что не стоит уж совсем ждать до последнего, так как минус на самом деле может подкрасться незаметно и напасть немного раньше, чем ROI пересечёт нулевую отметку.
Это происходит потому, что при анализе статистических данных веб-мастера, как правило, учитывают только расходы на трафик из рекламных кабинетов, игнорируя при этом дополнительные издержки на связку, такие как регистрация домена, аренда трекера, комиссия за вывод средств на банковскую карту и так далее по списку.
В результате можно наблюдать подобную картину…

Первый адверт учёл все расходы и уже остановил трафик, ибо вовремя увидел, что связка собирается уйти в минус.
Второй адверт в блаженном неведении продолжает лить с виртуальным ROI 11% и получать «баснословную прибыль».
Это, конечно, утрированный пример, и есть множество нюансов, о которых ни в сказке сказать, ни пером описать, но главное, чтобы вы уловили суть и не забывали о дополнительных накладных расходах.
Разумеется, если вы постоянно льёте на приличных объёмах с ROI от 500%, то беспокоится о таких мелочах не стоит, но что-то мне подсказывает, что это не так…

Как «правильно» считать ROI в арбитраже
Специально оставил эту тему на закуску, чтобы с самого начала не создавать сумбур в голове.
К сожалению, так исторически сложилось, что арбитражное сообщество до сих пор не выработало единой — «канонической» — формулы расчёта ROI. И вокруг этой темы то и дело вспыхивают нешуточные форумные войны, в которых по сути нет ни правых, ни виноватых.

А проблема заключается в следующем, — часть арбитражников вычисляют ROI не так…
ROI = ( Доход − Затраты ) / Затраты × 100,
как я вам показал, а немного по-другому:
ROI = Доход / Затраты × 100.
В результате небольшого изменения формулы смещается диапазон значений, которые может принимать ROI — он становится от 0% до плюс бесконечности. То есть даже при сливе трафика в минус ROI выражается положительным числом, но меньше 100%, а при сливе в плюс — больше 100%.
Так оба метода расчёта выглядят в сравнении на тех же примерах…

Моё мнение в этом вопросе непоколебимо уже много лет и основано на удобстве. Если я теряю деньги, то хочу в статистике видеть результат со знаком минус просто потому, что мне так намного проще проводить анализ.
Разумеется, я не запрещаю вам использовать второй вариант, но не забывайте указывать в своих «мегаприбыльных» кейсах с ROI 101%, по какой формуле вы всё это считали.

И уж тем более не надо с настойчивостью религиозного фанатика доказывать кому-либо правильность своего метода расчёта, основанного на формуле из Википедии. Будьте проще, и профит сам к вам потянется.
На самом деле
Но я всё-таки позволю себе маленькую шалость на правах автора статьи и попробую подкрепить правильность моего выбора социальными доказательствами.
Перед публикацией материала я специально устроил небольшой опрос среди арбитражников на эту тему и получил вот такой результат…

Если есть желание, то принять участие в голосовании вы можете здесь, а у меня на этом всё.
Занавес.
Staying on top of your company’s finances is absolutely critical. Regardless of industry or what sort of goods or services you’re selling, you need to know how much money is going into and out of the business because that’s going to tell you how worthwhile everything you’re doing is.
This is often called “working out your ROI” (Return on Investment), and it can be done using a fairly simple calculation. In this guide, we’ll explain the importance of ROI, how to use it in Excel, and most importantly how to supercharge those calculations and avoid wasted manual time with monday.com’s ROI formula template.
Get the template
What is an ROI formula in Excel?
Before we talk ROI formulas, let’s pump the brakes and cover what ROI is.
In its most basic form, ROI is a direct measure of return showing how much money you’ve made on a particular investment in relation to the cost of investment over a time period.
Return on investment (ROI) is a key business performance metric that companies and individuals use to calculate how efficient or profitable their investment is. It can also be used to compare different types of investments to figure out your net profit for each investment option.
Download Excel template
You can also compare your ROI over multiple time periods to calculate the growth rate at which your returns may have changed. To calculate your team’s ROI, you’d use a basic ROI formula. That calculation is just the return — or net income — your investment has generated divided by the cost of that investment. The resulting ratio or percentage will tell you how profitable that investment, project, or product really is.
It’s important to note that ROI doesn’t generally consider time value of money (TVM), which is the popular accounting theory that an amount of money you get today will be worth more than receiving the exact same amount at some point in the future. ROI treats every dollar the same — no matter when your business has earned it.
In Microsoft Office, you can use a built-in Excel calculator to figure out your ROI. All you have to do is complete a spreadsheet with the numbers you’d like to compare. The formula to calculate your true ROI is pretty simple. You just divide your returns in one cell by your cost in another cell.

(Image Source)
Why use an ROI formula in Excel?
ROI is one of the most fundamental business metrics out there. Why? Because it’s simple and super straightforward. You don’t have to be a professional financial analyst to work out your team’s ROI on a project, and it’s a decent gauge of an investment’s profitability that you can easily communicate to other stakeholders. More importantly, ROI can tell you a net gain or loss.
If your ROI is positive, it means your investment was probably worthwhile. If your ROI is negative, it means there’s likely some room for improvement. From there, your team can brainstorm what efficiencies could be made or where costs could be shaved.
A potential issue with calculating ROI is that it doesn’t totally eradicate all risk or uncertainty. But to make sure you’re getting all your calculations spot-on, you’re going to want to remove as much human error as possible.
That’s why it makes sense to use an ROI formula in Excel. Excel’s calculator doesn’t lie, and the formulas you enter automatically turn your data into ratios or percentages that will better inform your business choices.
What are some examples of ROI formulas in Excel?
Calculating ROI in Excel is simple. Deciding which ROI calculator to use is a little bit more difficult. Excel’s ROI formula calculator is essentially a system of formulas you can use to figure out a range of ROI calculations — from return on equity (ROE) and internal rate of return (IRR), to annualized ROI and return on assets.
To help give you an idea, let’s quickly break down a few ways you can work out your ROI using Microsoft Excel:
Net income
Using Excel’s net income formula, your ROI is going to be your net income divided by the cost of investment.

(Image Source)
This is one of the simplest and most useful ways to measure ROI in Excel.
Capital gain
This shows your ROI as a financial gain or loss generated by your investment. You can then use this percentage to compare against your original investment price — which means the formula is simply your capital gain divided by your cost of investment.
Total return
By calculating your total return in Excel, you’re looking at a percentage gain or loss just like your capital gain formula. But the key difference between total return and capital gain is that your total return formula looks at the original value versus your current value.
Written as a formula, that would be: ROI = (Ending value – Starting value) / Cost of investment.
Annualized return
The annualized return formula calculates your ROI as the average gain or loss you’ve made in a year on your initial investment.
This is displayed as a percentage, and the calculation would be: ROI = (Ending value / Starting value) ^ (1 / Number of years) -1. To figure out the number of years, you’d subtract your starting date from your ending date, then divide by 365.

(Image Source)
monday.com’s ROI formula template for Excel alternative
If you’re looking for the best ROI formula template Excel but are less than satisfied monday.com has got you covered. Our downloadable ROI formula template comes with loads of pre-built ROI formulas to suit just about every scenario. Every column is customizable, which means all you need to do is drag and drop your data and choose a formula to quickly get an accurate ROI calculation.
Our templates are supported by our all-in-one platform to automate calculations for you and even. Combine all of your financials into one flexible dashboard. This empowers you with a real-time view of key ROI metrics like net income, capital gains, total returns, and annual returns.

But more importantly, you benefit from automations that can keep a running tally of these ROI metrics as figures change and new project expenses are added. End result: you’ve always got a clear view of your ROI — without wasting hundreds of hours plotting in numbers and recalculating the formula every single time there’s a tiny change.
Sounding good so far? Try our financial statement template and start building your ROI formula space today.

Get the template
Related templates
Expense Tracking Template
Want to get more proactive about your finances? Check out our Expense Tracking Template. This dynamic template offers teams a flexible bird’s eye view of every aspect of their expenses and outgoings. You can also use it to forecast where your current financial path is going to take you in the future.
Budget Tracking Template
monday.com’s Budget Tracker Template offers you the chance to get a crystal-clear picture of how much your team is spending and then look at how that spending compares against what you’d originally budgeted. This template is 100% customizable, which means you can reorder line items, tag expenses, and create your own unique spending plan to keep things on track.
Get the template
FAQs about using ROI formulas on Excel
How do I calculate ROI in Excel?
Calculating ROI in Excel is pretty straightforward. All you’ve got to do is open a spreadsheet and then label the cells so you can keep track of the cost and return data you’re going to enter.
From there, just enter your data and select a blank column to enter in one of the Excel ROI formulas. If you’ve got your total returns and total cost in their own respective cells, it could be as easy as simply inputting “=A1/B1” to work out your ROI. Once you’ve got your result, you can just click the “%” icon.
This will change your ratio into an easy-to-understand percentage.
What is a good ROI percentage?
If you own or manage a business, you’ll want to take a look at your ROI pretty regularly. It’s a great way to understand how your business is going and where you might need to start improving things.
But in terms of what constitutes a good ROI, there isn’t a definitive answer. Each aspect of your business is different, and each will generate different percentages of ROI that might not be totally comparable. The best way to work out comparable figures is to tally up your ROI for a particular area regularly so that you can build a base of historical data to compare against.
If you’re talking stock investments, a good ROI is a bit more straightforward. Stock investments are where the investor buys the shares of a company, hoping that the company grows. It takes proper fundamental research of the company before purchasing the shares. Financial analysts say anywhere between 7% and 10% is a good ROI.
Measurement

CopyPress
April 27, 2022 (Updated: April 14, 2023)
Microsoft Excel makes it easy to record, track, and work with your business’s financial data, like the benefits from investments or assets. Plus, you can calculate your return on investment with Excel accurately without getting into complex math. The biggest advantage of Excel, though, is the option to use different formulas for measuring your ROI.
And in content marketing, having the tools to measure the success of your campaigns is a must. If you’re using Excel to track and measure the progress of your content marketing campaigns, find out what you need to know with the topics in this guide:
- What Is Return On Investment?
- Why Calculate the ROI of Content Marketing?
- Excel Formulas for Calculating Return on Investment
- How To Calculate ROI in Excel With Net Income
- Tips for Calculating ROI With Microsoft Excel
- ROI Calculator Excel Template
- ROI Calculator Excel Example
What Is Return on Investment?
Image via Unsplash by @markuswinkler
Return on investment (ROI) is a financial ratio that calculates the benefits an investor gets compared to the cost spent on a project. Most often, you use it to measure the net income for that investment. The higher the ROI ratio, the more profitable the project. In marketing, you may use this calculation to understand if your campaigns are making money, or if they’re successful enough to extend beyond their original deadlines. ROI is just one of several formulas you can use to understand the engagement health of your business’s content marketing efforts.
Why Calculate the ROI of Content Marketing?
Calculating ROI as part of your content marketing analysis gives you the information you need to decide whether accepting or rejecting an investment opportunity is beneficial for your business. For example, your ROI can help your team determine if it’s a good financial decision to pay for branded design elements or invest in syndication services. You can also calculate this metric to see if a prior decision was beneficial. Ultimately, tracking your ROI shows you how best to prioritize resources, funding, and time for your brand’s marketing activities.
The data you get from your calculations can help you make similar investments and choices or change your strategy in the future to make your campaigns more effective. Your marketing department can use ROI to show others within the organization—including executive officers and stakeholders—the success of investments. Because it shows a clear figure of profit or loss, the ROI is easy to understand, even if others within the organization know little about the initial investment.
Excel Formulas for Calculating Return on Investment
There are four common formulas to use when calculating ROI by hand or in Excel. Depending on your business’s content marketing activities, use one or more of the following to get a clearer picture of the outcomes of your marketing efforts:
Net Income
With this formula, find the ROI using the net income of the original investment value and write it as a percentage. This is the simplest and most useful formula for measuring ROI. In math terms, you’ll write the formula as:
ROI = Net Income / Cost of Investment
Capital Gain
The capital gain formula displays the ROI as a percentage gain or loss made on one share or investment. It compares the current share price with the original investment price. Write the formula as:
ROI = Capital Gain / Cost of Investment
Total Return
The total return formula also calculates the percentage gain or loss of one share or investment. This differs from capital gain, as it considers the original and current share prices and any dividends:
ROI = [(Ending Value – Beginning Value) / Cost of Investment]
Annualized Return
In this formula, the ROI is the average annual gain or loss made on a share of investment since the initial investment. You display the answer as a percentage. Calculate this formula as:
ROI = [(Ending Value / Beginning Value) ^ (1 / Number of Years)] – 1, where Number of Years = (Ending Date – Starting Date) / 365
Read more: How To Measure The ROI of Content Marketing
How To Calculate ROI in Excel With Net Income
Net income ROI is the easiest to understand and the easiest to calculate in Microsoft Excel, no matter the business industry. Use these steps to learn how to calculate this type of ROI within the spreadsheet formula:
1. Open Excel and Create a New Workbook
Open the Microsoft Excel program on your device or through Microsoft 365 online. If you don’t have Microsoft Excel, you can purchase and download the program from the company’s website. Microsoft offers a free trial for both business accounts and individuals. Once you’ve opened the program, open a blank workbook, then name and save the document.
2. Label the Cells
Label the cells across the top of the spreadsheet before adding other information. Doing this can help you find and keep track of the figures to use for SEO ROI calculations. Use the following or similar labels for the corresponding cells:
- A1: Content investment
- B1: Sales from content
- C1: Amount gained
- D1: ROI
3. Enter the Content Investment
Enter the content investment figure in cell A2. This number can be the original cost of the campaign or the current worth of the investment. For content campaigns, you can use the first option. In the cell, type the dollar sign and the numerical figure. For example, if your campaign costs $5,000 to launch, then type $5,000 in cell A2.
4. Enter the Sales From Content
Enter the amount earned from the campaign or investment in cell B2. Type the dollar sign and the numeral, just as you did for the content investment. For example, if you made $7,000 from the campaign, type $7,000 in cell B2.
Related reading: The 20 Best CRM Tools for Marketing Agencies
5. Calculate the Amount of Gain or Loss
Use a formula to calculate the gain or loss figure in cell C2. The formula for calculating profit or loss is subtracting the sales from content by the content investment. In Excel, type the formula =B2-A2 in cell C2. This allows the program to pull the numbers from the other cells to make automatic calculations for you.
6. Enter the ROI Formula
Like calculating the amount of gain or loss, use a formula to calculate the ROI in cell D2. The ROI formula divides the amount of gain or loss by the content investment. To show this in Excel, type =C2/A2 in cell D2.
7. Convert ROI to a Percentage
Your initial ROI calculation in Excel appears as a decimal. It’s customary to display the ROI as a percentage. Highlight cell D2 and click the percentage icon under the “Home” tab. This makes the information in that cell display as a percentage.
8. Repeat the Steps
If there are multiple projects, campaigns, or investments to calculate, you can repeat steps three through seven in separate rows to display them all in one document. This can be beneficial if you’re trying to compare which projects are most useful within your greater marketing plan. You may also consider calculating the ROI of one project over time to find your peak return window.
Related: How To Calculate and Improve Your Conversion Rate
Tips for Calculating ROI With Microsoft Excel
Use these tips to make your ROI calculations easier:
Fix Inaccurate or Missing Calculations
Because Excel is a computer program, sometimes it may not read your formula correctly. There’s also the chance that the program could miscalculate the data if the settings are wrong or the formula is mistyped. To troubleshoot some common formula errors, try:
- Turning on automatic calculations: Check the “Formulas” tab to ensure the workbook settings are automatic. If you have it set to “Manual” make the change, so the program calculates on its own.
- Deactivating “Show Formulas”: Under the “Formulas” tab, make sure the “Show Formulas” button is inactive. When checked, this option shows your formula in a cell rather than making a calculation.
- Setting cell to currency: After highlighting a specific cell, click the “Home” tab to check that it sets the cell property to “Currency” so the information in the cell displays as money. After making the change, double-click the cell and press enter to recalculate and display the information correctly.
- Removing spaces: Review the formula in the formula bar to make sure there is no space before the equals sign. Extra spaces may make the formula invalid and not calculate correctly or at all.
- Removing apostrophes: Adding an apostrophe before the equals sign in a cell formula makes Excel store your formula as text rather than running the calculation. The apostrophe doesn’t appear in the cell on the spreadsheet, but it shows in the formula bar, so remove these where you want to see a calculation instead of a formula.
Download a Template
If you’re concerned with getting your formulas just right or want to make sure the spreadsheet and calculations work properly, consider using a calculator template rather than recreating the document yourself. The Corporate Finance Institute (CFI) is just one organization that offers free downloads of ROI Excel Calculator templates. The pre-populated fields have the correct formulas and color-coded cells for your convenience. This particular template includes selections to calculate all four ROI formula types.
Consider an Alternative Formula
There are many alternatives to the basic and complex ROI formulas described above. If you find these four options don’t give you enough information, you can try a different type of calculation. The most detailed return measure is the Internal Rate of Return (IRR), which measures all the cash flow received over the life of an investment or campaign. The figure presents an annual percentage growth rate and accounts for the timing of cash flows, which some others do not.
Other alternatives include the Return on Equity (ROE) and Return on Assets (ROA), which do not account for the timing of cash flows and represent only the annual rate of return. They’re more specific than the net income ROI because they have a clearly defined denominator with equity and assets rather than the more general term of “investment.”
Use Google Sheets
If you’re unable to access Microsoft Excel, you still have options to use a program to calculate your ROI. Consider trying Google Sheets. You can use this program for free with a Google account to create, save, and share documents as you can with Excel. You can use the same formulas and design process to set up a workbook in Google Sheets as you do in Excel. The biggest difference is the location of some settings and the names of some menus.
Looking for more resources? Sign up for the CopyPress newsletter and receive content marketing insights straight to your inbox.
ROI Calculator Excel Template
This Excel ROI template shows you what to enter in each cell to calculate the net income ROI:

ROI Calculator Excel Example
This example Excel table shows you what the workbook looks like after the program calculates your figures. This is how your document should display if the calculations work correctly:

Calculating the ROI of your campaign can help you understand which strategies work best for your marketing plan. Combining the data from these calculations and others, along with analytics and customer feedback, can give you a better picture of the success of your marketing efforts.
You can use all this data as you plan future campaigns and tactics to help you reach your target audience and make a profit for your company using content marketing and advertising. Contact the team at CopyPress to learn how we can help you develop a successful content marketing strategy that adds to your business’s ROI.
More from the author:
Содержание
- ROI: что это такое
- Какой показатель ROI — хороший?
- Зачем считать ROI
- Разница между ROI, ROAS и ROMI
- Когда рассчитывать ROI
- Как автоматизировать расчёт ROI
- Как повысить показатель ROI
- Ошибки при подсчёте ROI
- Когда ROI неинформативен
- Что нужно запомнить о показателе ROI
ROI: что это такое
ROI («Return On Investment», возврат инвестиций) — коэффициент рентабельности инвестиций, который помогает рассчитать окупаемость вложений в проект. Позволяет определить эффективность потраченных средств.
Формула ROI: (доход с проекта — затраты на проект) / затраты на проект * 100%
Пример расчёта ROI: интернет-магазин декоративной косметики запустил контекстную рекламу в Яндекс.Директе, Google Ads и таргетированную — в Facebook*. На рекламу в Яндекс.Директ потратили 2 800 ₽, в Ads — 3 100 ₽, на таргетированную рекламу — 3 000 ₽.
Хотите освоить сквозную аналитику?
Посетите регулярный мастер-класс по аналитике от Roistat.
Подключиться
Через 2 недели посчитали прибыль. Директ привёл покупателей, которые в сумме потратили 9 600 ₽. Пользователи, которых привёл канал трафика Google Ads, купили товара на 8 700 ₽. Facebook принёс компании продажи на 4 000 ₽. Показатель ROI для рекламных каналов будет следующим:
Для Яндекс.Директ = (9 600 ₽ — 2 800 ₽) / 2 800 ₽ * 100% = 243%.
Для Google Ads = (8 700 ₽ — 3 100 ₽) / 3 100 ₽ * 100% = 180%.
Для Facebook = (4 000 ₽ — 3 000 ₽) / 3 000 ₽ * 100% = 33%.
Какой показатель ROI — хороший?
Доходы с каждого канала трафика из примера выше оказались больше затрат на рекламу. Правда, у Facebook показатель ROI всего 33%, у Google Ads — больше 100%, а у Директа — больше 200%. У какой рекламы можно считать метрику ROI хорошей?
У каждой сферы бизнеса свой идеальный показатель Return On Investment. Обычно для рекламных каналов хорошим ROI считают показатель больше 100% — кампания тогда считается прибыльной. Если меньше 100% — она не окупается.
Однако ROI — это относительная метрика, которая не отражает всю ситуацию в бизнесе в отрыве от других показателей. Например, ROI может быть высоким, потому что расход на рекламу был низким. Но при этом компания продала малое количество товаров и получила с них небольшую выручку.
Например, производственные мощности компании позволяют продавать по 100 единиц товара в месяц, а компания продала только 30 товаров. За другой месяц компания смогла продать больше — 100 единиц товара, но и потратила на рекламу больше. Сравним показатели в таблице:
| Доход | Расход | ROI | |
| Месяц 1 | 30 000 ₽ | 11 700 ₽ | 156% |
| Месяц 2 | 100 000 ₽ | 57 400 ₽ | 74% |
В первом случае показатель окупаемости рекламы выше в 2 раза. Реклама стоила в 5 раз дешевле, чем в первый месяц. Реклама окупилась даже при низких продажах, но компания не реализовала свои ресурсы в полной мере. Во второй месяц расходы компании были выше, а ROI ниже, при этом продаж было больше.
Анализировать только показатель ROI недостаточно. Есть и другие бизнес-показатели, за которыми стоит следить: стоимость привлечения одной покупки — CPO, средний чек, прибыль бизнеса с одного клиента за всё время работы с ним — LTV, доход, расход и выручку с рекламы.

Подробнее о ROI и других бизнес-метриках рассказали в нашем блоге.
Что важно учесть при анализе эффективности рекламы, рассказал основатель Roistat:

Зачем считать ROI
- Оценить эффективность затрат на рекламу.
- Спланировать маркетинговый бюджет.
- Понять, в каких каналах трафика бизнесу выгоднее продавать товары и услуги.
Знание ROI помогает эффективно менять стратегии в развитии компании в целом и её продуктов в частности. Этот показатель помогает понять, как следует развиваться компании, чтобы удержаться на плаву.
Разница между ROI, ROAS и ROMI
Все три показателя дают понимание, окупаются ли вложения бизнеса или нет. ROI — учитывает все вложения в бизнес. А вот при расчёте ROMI и ROAS учитываются только затраты на маркетинг или рекламу и прибыль с неё.
ROAS («Return On Ad Spend», окупаемость затрат на рекламу) помогает оценить эффективность рекламы. Учитываются только расходы на рекламу и доходы, которые были с неё получены.
ROMI («Return On Marketing Investment», окупаемость затрат на маркетинг) помогает оценить эффективность инвестиций в маркетинг. Учитываются только затраты на маркетинг: на рекламу, печать листовок, написание текстов райтерами и так далее. А вот, например, затраты на зарплату сотрудников или производство продукта не учитываются.
Часто все 3 показателя при аналитике маркетинга для удобства называют просто ROI.
Когда рассчитывать ROI
ROI помогает сравнить окупаемость разных инвестиций. Его можно рассчитывать как для отдельных проектов, так и для оценки эффективности работы компании в целом. Особенно информативна метрика, когда есть прямая зависимость доходов от затрат бизнеса:
- в прямых онлайн-продажах;
- в программах лояльности;
- при стимулировании продаж маркетинговыми мероприятиями;
- при оценке эффективности работы менеджеров по продажам и маркетологов.
Как считать ROI:
1. В Excel: для этого в таблице нужно единожды создать формулу расчёта и регулярно вносить и обновлять данные по каналам трафика.
Для начала создайте столбик с названиями рекламных каналов, столбики, в которые будут вписываться расходы и доходы, и отдельный столбик, в котором будет рассчитываться результат — ROI. Для удобства для столбцов расхода и дохода можно задать «Формат — Числа — Валюта», а для ROI: «Формат — Числа — Процент».

Для удобства в таблице можно сразу считать и другие бизнес-показатели, чтобы вся информация хранились в одном месте.
Очевидный минус такого расчёта — доходы и расходы нужно вносить и обновлять вручную. Маркетологу придётся регулярно проверять данные в рекламных каналах и CRM.
2. В калькуляторах ROI: например, такие сервисы есть у Unisender, Advego, Checkroi. Задавать формулу расчёта уже не нужно, достаточно внести значения дохода и расхода.

Минус — проблему ручного ввода данных калькулятор не снимает, к тому же значения показатель нужно где-то хранить, поэтому завести таблицу или другой тип документа всё-таки придётся.
3. В сервисе сквозной аналитики: пока у компании настроены всего пара рекламных кампаний, анализировать их эффективность может быть не так сложно. Но чем больше источников трафика использует компания, чем больше ключей и объявлений появляется, тем больше рутинной работы будет выполнять маркетолог.
Представьте, сколько времени нужно, чтобы перенести в таблицу информацию о затратах на рекламу по 100 ключевым словам, а потом ещё забрать информацию о заявках и покупках с них из CRM и эффективность каждого ключа проанализировать.
Тут на помощь приходит сквозная аналитика, которая автоматизирует рутинные процессы.
Как автоматизировать расчёт ROI
Сервис сквозной аналитики Roistat собирает данные из рекламных каналов, сайта, коллтрекинга и объединяет их с данными из CRM. В сводном отчёте Roistat компания увидит, сколько денег было потрачено на рекламу, сколько с неё было получено визитов на сайт, заявок и продаж.
В Roistat показатель ROI рассчитывается автоматически. В сервисе «Аналитика» можно анализировать эффективность каналов трафика и в том числе отслеживать показатель для Яндекс.Директа, Google Ads, ВКонтакте, email-рассылок и других каналов.

Как повысить показатель ROI
Метрика ROI рассчитывается с помощью двух показателей — дохода и расхода. Поэтому, чтобы увеличивать ROI, нужно улучшать эти 2 показателя: расходы должны снижаться, а доход — расти.
1. Снизьте расходы на рекламу за счёт оптимизации или отключения неэффективных каналов трафика. Например, отчёт сквозной аналитики показывает, что таргетированная реклама во ВКонтакте приносит мало визитов на сайт, низкую конверсию в заявку и в продажу. Если кампания запущена уже давно, её стоит оптимизировать: изменить таргетинги, тексты и креативы, либо отключить. Это поможет сэкономить бюджет на рекламу, которая приносит бизнесу продажи и выручку.
2. Увеличьте доход с рекламы — на эффективную рекламу наоборот стоит увеличить бюджет, чтобы получать больше продаж.
Можно работать с увеличением среднего чека за счёт продаж дополнительных товаров или услуг. Отслеживать, предлагают ли менеджеры клиентам другие товары компании, можно с помощью Речевой аналитики. В словари сервиса нужно добавить названия товаров или услуг: например, когда менеджер предлагает в звонке услугу доставки, сервис заметит это и протегирует звонок меткой «менеджер предложил доставку».
Рассказали в блоге: как контролировать качество звонков и заботиться о клиентах.
Ошибки при подсчёте ROI
1. Не учитывается модель атрибуции бизнеса. Например, у бизнеса короткий цикл сделки: пользователь попадает на сайт — изучает продукт — оставляет заявку — покупает. В этом случае ценность продажи всегда можно отдавать одному каналу — с которого пользователь зашёл на сайт, чтобы тут же совершить покупку.
Но если у бизнеса длинный цикл сделки, до покупки пользователь несколько раз попадает на сайт с разных рекламных объявлений, ценность конверсии нужно распределять уже между несколькими каналами.
Выбранная модель атрибуции поможет понять, насколько важным было касание пользователя с каждым каналом трафика.
Рассказали в блоге: как и какую модель атрибуции выбрать бизнесу.
2. Не учитывается средняя длительность цикла сделки. В некоторых сферах бизнеса клиенты долго раздумывают о покупке. Можно зайти на сайт ресторана и заказать пиццу через несколько минут, но для покупки машины нужно время, чтобы всё обдумать, выбрать лучший вариант.
Пользователь может впервые перейти на сайт с рекламы в октябре, а купить дорогой товар только в начале марта. Если посчитать ROI каналов вне цикла сделки, можно решить, что реклама не окупилась. На деле она могла принести бизнесу деньги, просто не в том же месяце, когда маркетолог запустил показ объявления.
3. Не учитываются дополнительные затраты: например, оплата работы подрядчика или комиссия рекламной площадке. В итоге в отчёте бизнес видит неправильный показатель прибыли, на самом деле он ниже.
В сквозной аналитике Roistat можно учитывать дополнительные расходы на рекламу. Для этого в отчёте сквозной аналитики, например, по всем каналам трафика нужно добавить метрики: «расход на подрядчиков» и «ROI с учётом дополнительных расходов». Дополнительный расход нужно будет регулярно заполнять.
4. Неправильно распределяются доходы между рекламными кампаниями. Иногда сложно отследить, сколько продаж принесло каждое рекламное объявление. Например, пользователь увидел объявление в Яндекс.Директ, зашёл на сайт, но нужную информацию не нашёл и покинул страницу. В следующий раз пользователь зашёл напрямую — просто ввёл название сайта в адресной строке — и оставил заявку. Менеджер по продажам, конечно, попытался узнать, какое именно объявление из 10 настроенных привело нового лида. Но пользователь уже не смог вспомнить.
В итоге для расчёта ROI маркетологу приходится придумывать, куда добавить продажу или считать общий ROI для канала трафика.
Отслеживать эффективность рекламы с точностью до объявления или ключевого слова может сквозная аналитика Roistat. Если ключевое слово не приводит даже заявки, его можно удалить из настроек, чтобы рекламная кампания в целом привлекала больше клиентов.
Например, ключи «банка для сыпучих продуктов», «набор банок для продуктов», «банка для сыпучих продуктов купить» и «корзинка для хлеба купить» не приносят продажи — можно отключить рекламу по ним
Хотите освоить сквозную аналитику?
Посетите регулярный мастер-класс по аналитике от Roistat.
Подключиться
Когда ROI неинформативен
Когда у компании сложная маркетинговая модель — не будет понятно, какая кампания привела продажи.
В стартапах — траты превышают доходы и показатель будет отрицательным. Но это определённый этап развития бизнеса.
Когда продукты компании имеют большую разницу в цене. Например, когда среди продуктов есть уникальные или элитные товары. ROI не учитывает долю каждого продукта в общем объёме выручки.
Что нужно запомнить о показателе ROI
- Показатель ROI («return on investment», возврат инвестиций) отражает, окупаются ли вложения бизнеса, например, в рекламу или в маркетинг в целом.
- Формула расчёта: (доход от вложений — размер вложений) / размер вложений * 100%. Для каждой сферы бизнеса будет своё значение хорошего ROI.
- ROMI и ROAS — как и ROI, дают понимание, окупаются ли вложения или нет. Разница в том, что ROAS помогает оценить эффективность затрат именно на рекламу, а ROMI — на маркетинг.
- При расчёте ROI нужно учитывать цикл сделки бизнеса. Если пользователи покупают в среднем через месяц после того, как впервые увидят рекламу, нет смысла через неделю отключать кампанию из-за низкой окупаемости. Просто пользователи ещё не успели конвертироваться в клиентов. В это время обратите внимание на показатель количества визитов и заявок.
- Автоматизировать расчёт ROI можно с помощью сквозной аналитики Roistat: сервис соберёт данные из рекламных кабинетов, сайта, коллтрекинга, CRM и объединит их в единый отчёте. Также в отчёты Roistat можно добавить и другие бизнес-метрики, важные для компании.
- Повысить показатель ROI можно за счёт снижения расходов на рекламу или роста доходов с неё. Отслеживайте в сервисе сквозной аналитики Roistat, какую рекламу бизнесу выгодно показывать, а какую лучше оптимизировать или отключить.
Следите за новыми материалами по маркетингу и аналитике, кейсами клиентов Roistat, инструкциями и чек-листами в нашем Telegram-канале.
*Meta и продукты компании — Instagram, Facebook — признаны экстремистскими организациями на территории РФ.
In this guide, you will learn about the role of ROI, its formula, why you would use it, the four methods to easily calculate it, and additional methods to break down work. Download the essential Excel templates to perform a variety of ROI tasks, including content marketing metrics, website ROI analysis, healthcare quality initiative ROI, event ROI calculator, PLM ROI calculator, IT ROI, cost avoidance calculator, and TCO ROI.
Cash Flow ROI and Template
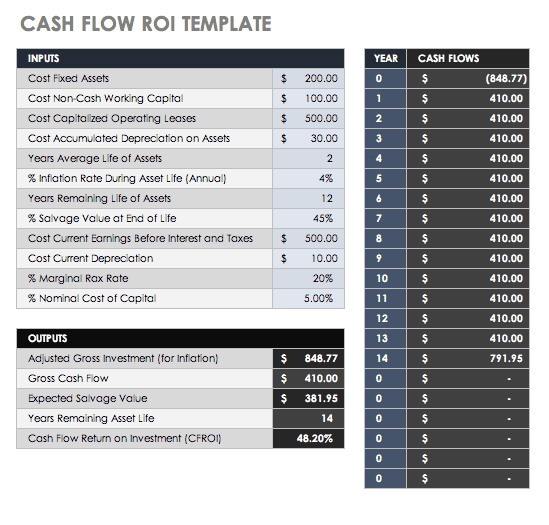
Cash Flow ROI (CFROI) is a proxy for a company’s economic return. This return is compared to the interest rate charged to commercial banks from the Federal Reserve’s standard (the discount rate), to see if there is value-added potential. CFROI is the average economic return in a year on all of a company’s investments. Enter your variables in this template to determine your company’s CFROI.
Download Cash Flow ROI and Template — Excel
In this template, you will enter the following variables:
-
Cost Fixed Assets: These are assets not expected to be used up or converted into cash within a year. They can include property, plant, and equipment (PPE), and may be used to generate income.
-
Cost Non-cash Working Capital: The sum of inventory and receivables
-
Cost Capitalized Operating Leases: Posted as an asset on the balance sheet, this type of lease expenses the lease payments.
-
Cost Accumulated Depreciation on Assets: An asset account with a credit balance.
-
Years Average Life of Assets: The accumulated depreciation divided by the current depreciation expense.
-
Percent Inflation Rate During Asset Life (Annual): The change in purchasing power.
-
Years Remaining Life of Assets: This is calculated based on when the asset went into service and the preferred depreciation method.
-
Percent Salvage Value at End of Life: The resale value at the end of the asset’s useful life.
-
Cost Current Earnings Before Interest and Taxes (EBIT): All incomes and expenses, except interest and income tax expenses.
-
Cost Current Depreciation: The deduction that helps spread the cost over many years.
-
Percent Marginal Tax Rate: The tax percent of your income based on your tax bracket.
-
Percent Nominal Cost of Capital: The rate of return needed to persuade your company to make a given investment.
Below are the outputs from these inputs:
-
Adjusted gross investment (for inflation)
-
Gross cash flow
-
Expected salvage value
-
Years remaining asset life
-
Cash flow return on investment (CFROI)
-
Cash flows per investment year
NPV and IRR Calculations and Template
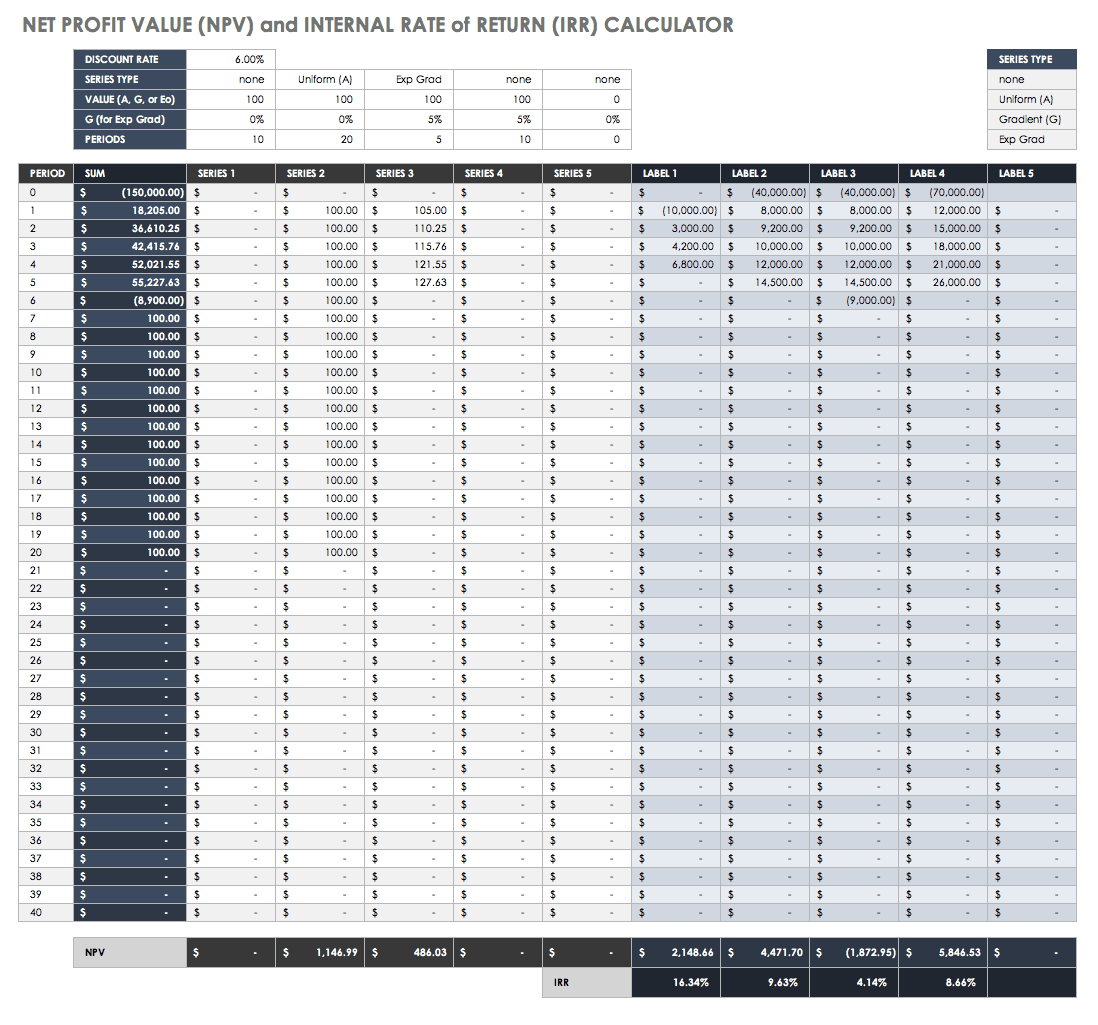
Net present value (NPV) and internal rate of return (IRR) are metrics used to estimate ROI. NPV is the dollar difference between the present value of cash inflows and outflows over time. Companies use NPV as a tool to help them decide if an investment will provide long-term value, to compare different investment options, and to decide whether they should introduce a new product. IRR is the calculation that estimates the percent profitability of possible investments by taking the NPV equal to zero.
NPV looks at each cash flow separately, even when the discount rate is unknown. An NPV greater than zero makes a project financially worthwhile. IRR compares projects using one discount rate, predictable cash flows, equal risk, and a shorter time. IRR does not account for changes in the discount rate, which at times makes it a poor metric. Further, if there are a mix of positive and negative cash flows, IRR calculations are not effective. To calculate your company’s NPV and IRR, use this template.
Download NPV and IRR Calculations and Template — Excel
In this template, you will input the following:
-
Discount rate
-
Series payment type (None, Uniform, Gradient, or Exp Grad)
-
Value (A, G, or Eo)
-
G % for Exp Grad
-
The number of periods
-
For each period, the values
Below are the outputs for this template:
-
The sum for each period
-
The different series for each period
-
NPV for each series
-
NPV for each label
-
IRR for each label
Cost Avoidance Calculator Template
Preparing for a conference or large event is a big commitment for a business. There are direct costs, such as airfare, registration, and accommodations, and indirect costs such as the hours of preparation. Cost avoidance includes actions or event-substitutions that reduce future costs, such as planning virtual conferences, trainings, or parts replacement before failure (and subsequent damage to other parts). Cost avoidance activities may incur higher immediate costs but save money — sometimes totaling extreme savings — over time. This is a different concept from cost savings, in which you actually save the money you plan on spending. Lower spending, investment, or debt levels is what saves money.
Use this template to calculate cost avoidance as ROI. This calculator has a variety of event scenarios, including training, conference, and an in-person event. These costs are compared to a virtual briefing, a virtual conference, and a virtual large event, respectively. With your input, you can calculate the costs per participant for each, the cost avoidance factor per participant, and the avoidance factor.
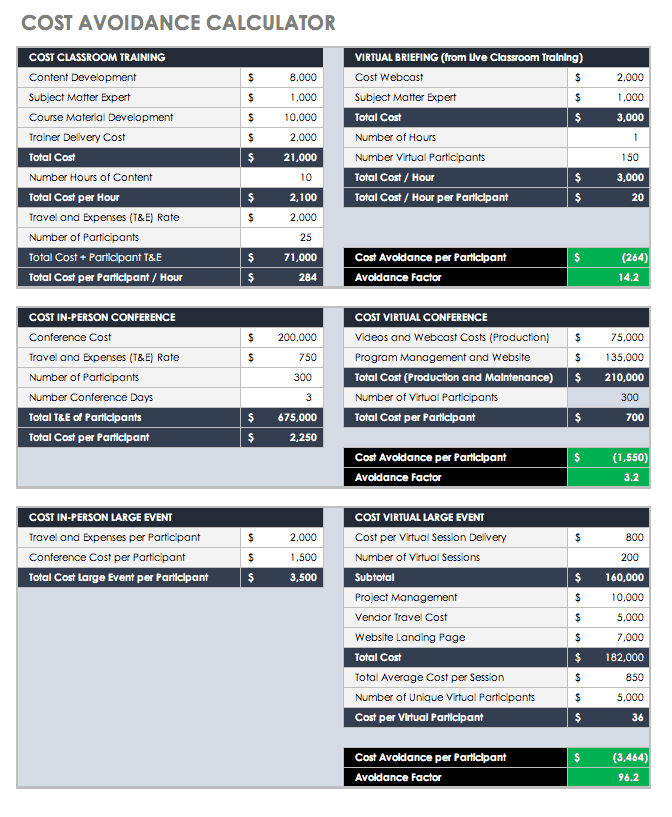
Download Cost Avoidance Calculator — Excel
Marketing ROI and Content Marketing Templates
Marketing is a huge expense for any business. Whether your company invests in a comprehensive program that rolls out print and television ads as well as a social media presence, or just has a Facebook page, you should know the worth of your content over time. Sirius Decisions stated in 2013 that 60 to 70 percent of content goes unused. The cost of creation itself involves the per hour cost of each person by the number of creation hours involved, plus any actual content expenses. Having the ROI for marketing content can help motivate your staff to use it.
The marketing ROI (MROI) is simply the revenue generated from your content minus the cost to produce your content. This is a simple calculation, but some professionals caution that marketing professionals should define how and what they have measured in order to signal to stakeholders whether they are defining short-term channel-specific ROI or informing for long-term budget or strategic decisions. In this marketing ROI template, you will find space for multiple marketing initiatives in order to compare their relative value.

Download Marketing ROI Template — Excel
To use this template, input the following:
-
Total initiative cost
-
Total circulation/audience
-
Response rate (percent of generated leads by the audience)
-
Conversion rate (percent of leads which will purchase)
-
Average revenue per sale
-
Average profit per sale
From these inputs, you will get these outputs:
-
Total costs of all initiatives
-
Total cost/audience for all initiatives
-
Average profit per sale for all initiatives
-
Number of leads generated
-
Number of sales
-
Total revenue uplift
-
Total cost
-
Total profit uplift
-
ROI
-
ROI percent
-
Cost per lead
-
Cost per sale
-
Break even response rate
-
Break even conversion rate
-
Break even profit per sale
The demand for marketing measurement and reporting is rising with marketing costs. There are many metrics that should be reported to show the success of your marketing program. Many professionals are not comfortable communicating their impact on the bottom line metrics to get the support they need. The key metrics that every marketing person should be comfortable reporting include the following:
Reach
-
Total Reach: The number of people your company can reach across your different networks and platforms. Each is a potential client.
-
Reach by Channel: The number of people following or subscribed per channel.
Visits
-
Total Website Visits: The number of people who visited your website in a period of time. This metric shows how well your inbound marketing is directing people to your website, which is also tracked month over month (MoM).
-
Website Visits by Source: This metric reports where people are coming to your website from to determine how well specific campaigns are working.
Leads
-
Total Leads Generated: This metric shows the interest your campaign generates for the products or services. It is one of the strongest ROI indicators.
-
Leads Generated by Source: This metric shows the channels that produce the most leads, which allows you to focus on the most valuable sources.
Customers
-
Total Customers Driven by Marketing: This metric tracks which marketing campaigns are yielding the most customers.
-
Marketing Generated Customers by Source: Track the source of the customers acquired by each campaign.
Conversion Rates
-
Visit to Lead Conversion Rate: This measures the percent of people whose website visit becomes a new lead for sales.
-
Lead to Customer Conversion Rate: This measures the percent of people moving from leads to customers. This metric helps determine if your campaigns are generating sales-ready leads.
-
Visit to Customer Conversion Rate: This is the overall funnel: whether your traffic generated turns into customers.
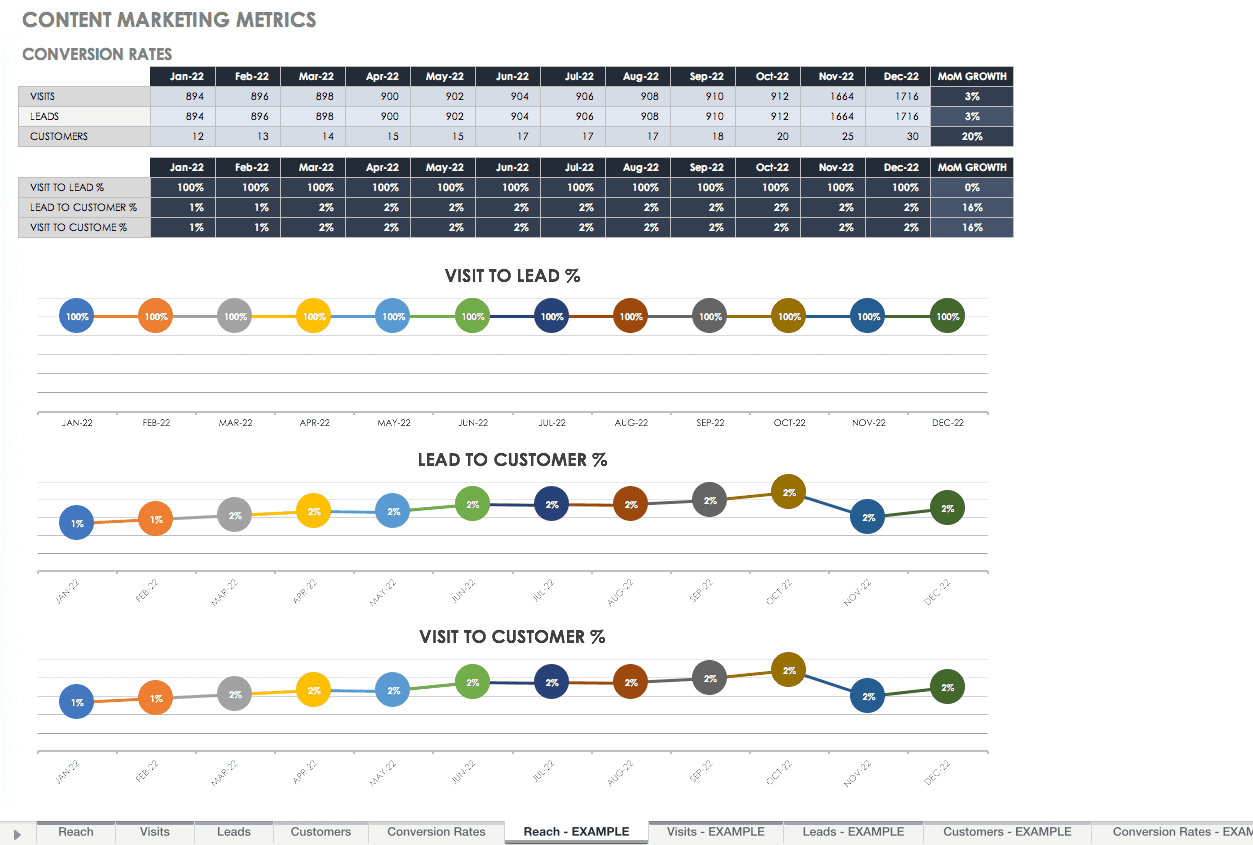
Content Marketing Metrics Template
Use each of the above five categories to record metrics for reporting with this template. It provides a space for each metric and ready-made graphs to add to your marketing deck so you can present your success. Fill out the reach, visits, leads, and customers templates, and your conversion rates template will automatically fill from your data.
Download Content Marketing Metrics Template
Excel | Smartsheet
Website ROI Analyses and Template
Google Analytics can help you determine the financial value of your content so you can calculate ROI. Use GA to track the URLs from all your web materials, such as your website, Facebook, newsletters, and any other sources. You can track who comes to your site and the path they took to get there. For example, you can get a count of how many times someone accessed your site from a Facebook post, or how many times your content was downloaded from your site.
To set up Google Analytics, start by either signing in or creating an Analytics account. Set up your property in the Admin tab. Your property is your websites or apps you want to track. Here’s how to set up Google Analytics:
-
In the Account column, select which account you want to add the property.
-
If you do not see the website or app you want to set up, in the Property column, click the + Create Property.
-
Select whether you want analysis for a website or an app.
-
For an app, click Firebase. Select the app from the menu and click Connect App.
-
After you select the app, or if you have a website, enter the name.
-
For a website, type the website URL.
-
Select the Industry Category.
-
Select the Reporting Time Zone.
-
Click Get Tracking ID. This selection completes the set up for your property.
-
To collect data, set up the tracking code.
Set up a reporting view in your property. You can see the data report based on what filters you add:
-
Go to the Account and Property for the view you want to create.
-
In the View column, click the menu, then click + Create New View.
-
Select either website or app.
-
Enter the name.
-
Select the Reporting Time Zone.
-
Click ON to create a User ID view, if your property has user ID enabled property. Leave this as OFF if you only want a reporting view.
-
Click + Create View.
-
Edit the settings.
Add the Tracking Code to your website or app.
-
Go to the account and property for which you want to add a tracking code.
-
Click Tracking Info.
-
Click Tracking Code.
-
Select and copy the code (the global site tag) that is generated and paste it into your website. Here is one example of a global site tag:
<!— Global site tag (gtag.js) — Google Analytics —>
<script async src=»https://www.googletagmanager.com/gtag/js?id=UA-69350417-1″></script>
<script>
window.dataLayer = window.dataLayer || [];
function gtag(){dataLayer.push(arguments);}
gtag(‘js’, new Date());
gtag(‘config’, ‘UA-69350417-1’);
</script>
-
For every page you want to track, paste it into the <HEAD>. If there is already a global site tag, add only the config line, or code following ‘config’,. In this case:
‘config’, ‘UA-69350417-1’
Website ROI Calculator Template
You can add Goals in your analytics page to determine how well your pages are performing. Import the information from your website or app into this website ROI calculator to determine the ROI for your web-based traffic. You’ll find a full website campaign overview in a roll-up sheet, which tells you which campaigns are the most successful so you can compare them.
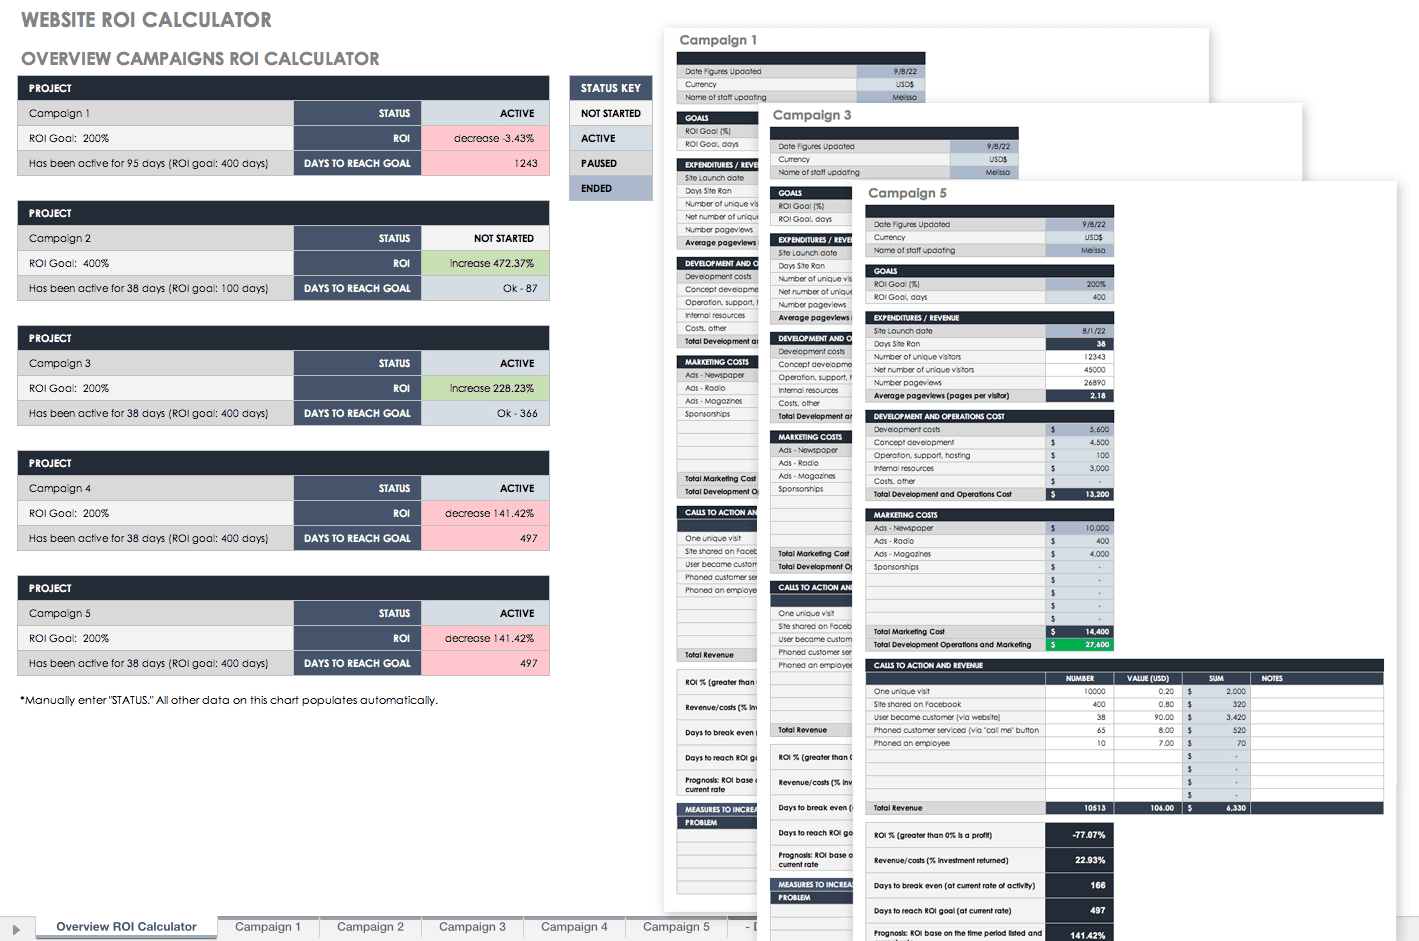
Download Website ROI Calculator — Excel
In this calculator template, you will find spreadsheets for each of your campaigns. The inputs for each campaign are as follows:
-
Date figures updated
-
Currency
-
Name of staff updating
-
ROI goal (percent)
-
ROI goal (days)
-
Site launch date
-
Number of unique visitors
-
Net number of unique visitors
-
Number pageviews
-
Development costs
-
Concept development
-
Operation, support, hosting
-
Internal resources
-
Other costs
-
Marketing costs
-
Calls to action and revenue
From these inputs, the following are your outputs:
-
Days ste ran
-
Average pageviews (pages per visitor)
-
Total development and operations cost
-
Total marketing cost
-
Total development operations and marketing
-
Total revenue
-
ROI percent (greater than 0 percent is a profit)
-
Revenue/costs (percent investment returned)
-
Days to break even (at the current rate of activity)
-
Days to reach ROI goal (at current rate)
-
Prognosis: ROI based on the time period listed and the current rate
Another way to figure out the revenue from your web content is to look at your online sales. Each time you sell products on your website, you can use your digital content to push customers to your sales pages. Each time you post a blog article, there should be links your customers can follow to reach your products. From these page visits, look at the revenue earned over the period and the number of visits from your content.
There are other programs you can use to manage your social media and marketing content that you can purchase as well. Some of these plug into your existing software to make your reporting easier. It’s worth reviewing their features and ease of use for your company if your revenue is dependent on your social marketing content. Some of these apps include Hootsuite, Hubspot, Buzzsumo, and Quintly.
Healthcare Quality Initiative ROI Templates
With the cost of health care skyrocketing, state-sponsored and private health plans should be able to prove their ROI to measure the effect of their quality improvement initiatives. These seven worksheets can help you prove the ROI of your quality improvement initiative:
-
Initial Costs: In this template, the costs of the personnel involved in the initiative are laid out, as well as any additional costs such as supplies, contracted services, and equipment. The total costs of the initial investment are calculated. This is Year 1 costs.
-
Operating Costs: This spreadsheet template pulls data from your initial costs spreadsheet for Year 1 and allows you to add data for consecutive years of your initiative. You can add and adjust for additional staff and known costs, and then the worksheet calculates the total costs for each year.
-
Claims-Intervention: Data from claims is used to estimate savings per year. Inputs for this spreadsheet include the actual payments from each claim category and the estimated savings by claim category for each year, the monthly membership for the initiative, and the number of months in the year the initiative was operational.
-
Claims-Control: Data from a control group of claims (without the intervention) shows a difference in the intervention versus changes that are an artifact of other reasons. It is important to maintain a control group to show that improvements come from your initiative and not from other or natural progressions.
-
Claims-Incremental: This spreadsheet compiles data from your claims-control and claims-intervention spreadsheets to determine your savings, and whether these savings are relevant to your quality initiative.
-
ROI: This spreadsheet automatically compiles data from your other spreadsheets and calculates the total discounted annual investment costs, the total discounted annual savings, and the ROI summary, which includes undiscounted annual net cash flows, cumulative ROI, net present value, and internal rate of return.
-
ROI-Incremental: Like the ROI spreadsheet, this template calculates the savings and ROI summary, but for incremental data.
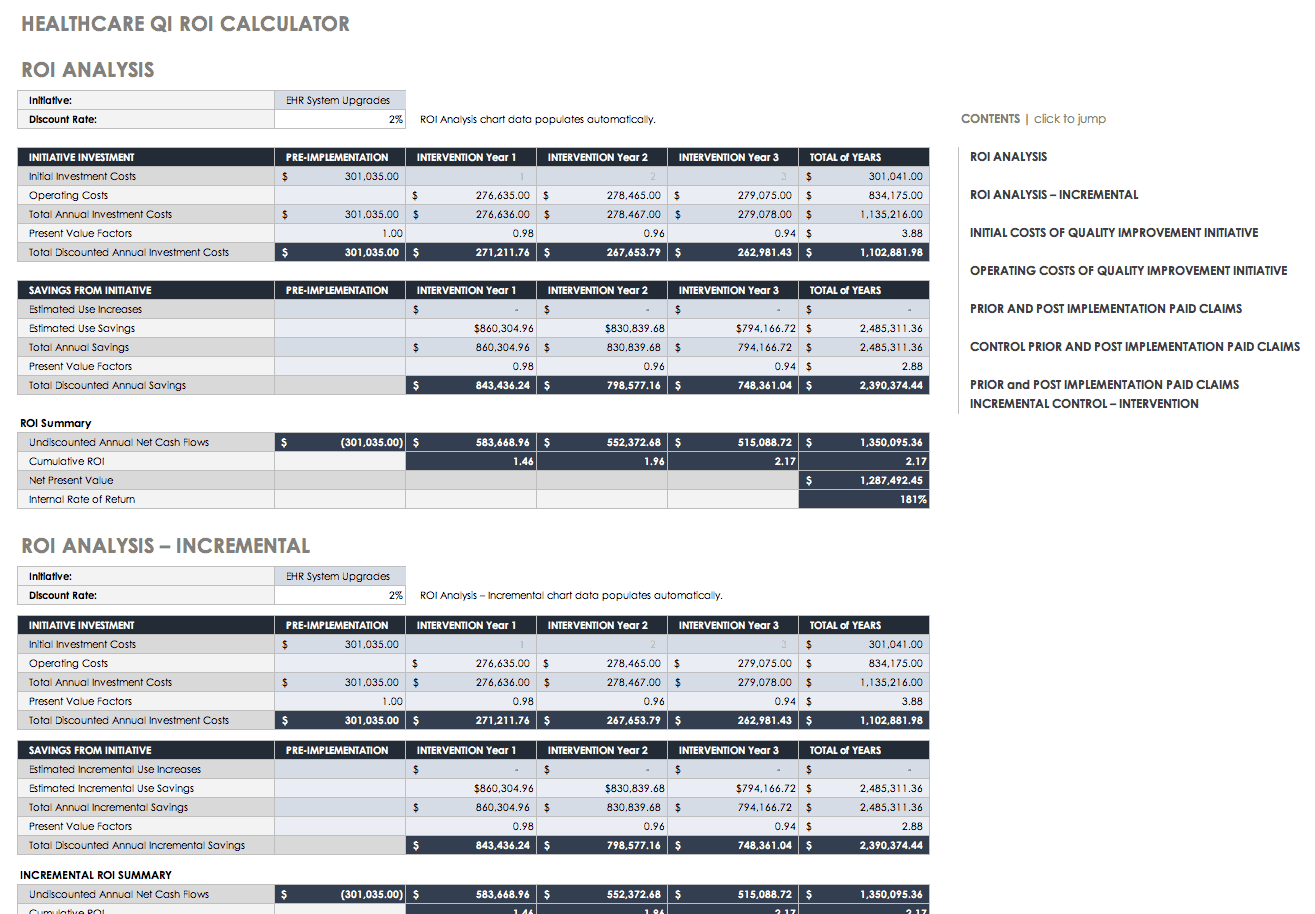
Download Healthcare Quality Initiative ROI Templates
Project ROI Templates
There are many projects that require you to calculate ROI. Some of these may be due to technology or software system changes that can get extremely expensive, so being able to report ROI to your stakeholders becomes critical.
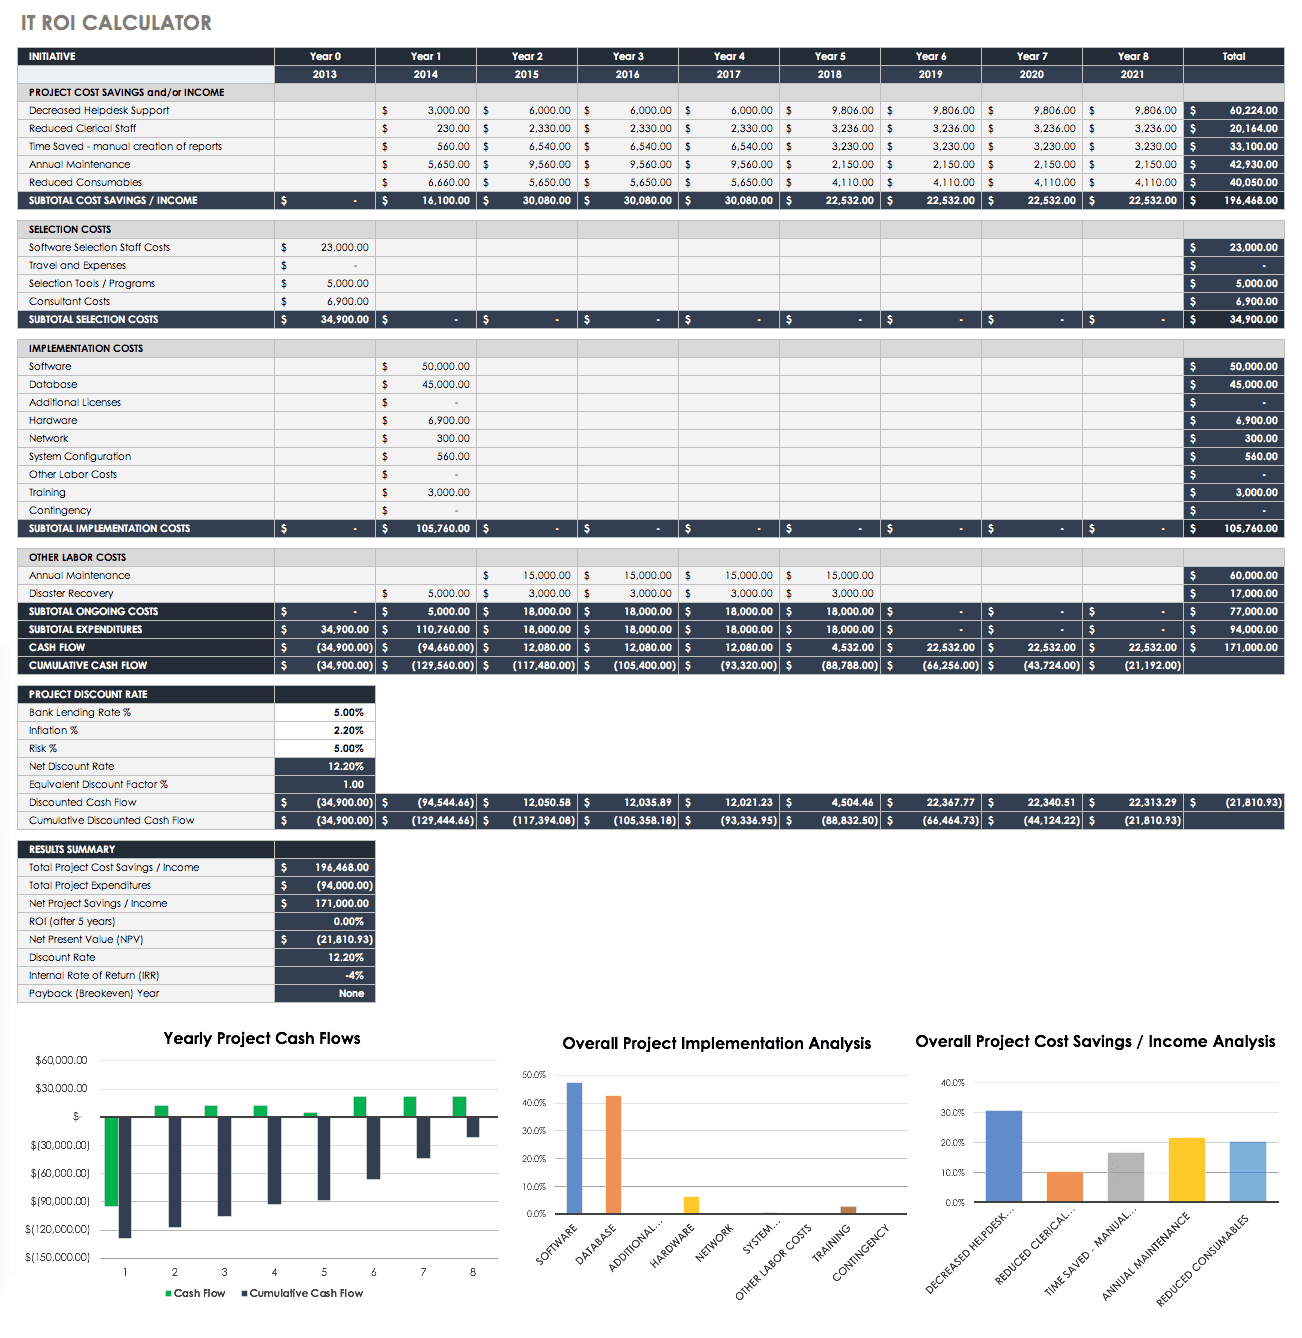
IT ROI Calculator Template
The following is an IT ROI calculator for any basic IT initiative or project. This calculator provides columns to include data for up to eight years, but you can add more years as columns. Inputs include the following:
-
Cost savings by year
-
Selection costs
-
Implementation costs
-
Ongoing costs
-
Project discount rates
The outputs from this include subtotals of each, cash flow, cumulative cash flow, and results. The results include the following:
-
Total project cost savings/income
-
Total project expenditures
-
Net project savings/income
-
ROI (after five years)
-
Net present value (NPV)
-
Discount rate
-
Internal rate of return (IRR)
-
Payback (breakeven) year
For ease of reporting, charts have been included that automatically show yearly project cash flows, overall project implementation analysis, and overall project cost savings/income analysis.
Download IT ROI Calculator
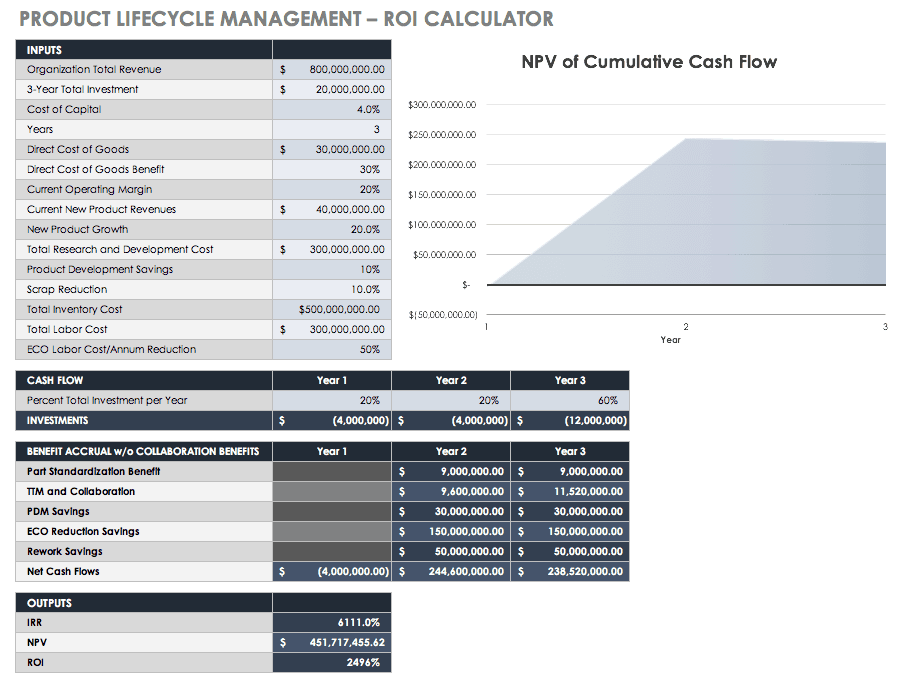
ROI Calculator for Product Lifecycle Management (PLM) Systems
Another software ROI calculator is for product lifecycle management (PLM) systems. Inputs for this calculator include the following:
-
Organization total revenue
-
Three-year total investment
-
Cost of capital
-
Years
-
Direct cost of goods
-
Direct cost of goods benefit
-
Current operating margin
-
Current new product revenues
-
New product growth
-
Total research and development cost
-
Product development savings
-
Scrap reduction
-
Total inventory cost
-
Total labor cost
-
ECO labor cost/annum reduction
-
Percent total investment per year
Outputs from this calculator include the following:
Yearly:
-
Investment amounts
-
Part standardization benefit
-
TTM and collaboration
-
PDM savings
-
ECO reduction savings
-
Rework savings
-
Net cash flows
Overall:
-
IRR
-
NPV
-
ROI
Use the diagram that visually shows the NPV of cumulative cash flow to update your stakeholders.
Download ROI Calculator for Product Lifecycle Management (PLM) Systems
Business Case and Event ROI Template
Building a business case helps your team or company justify the funding in any proposal. This is the expected benefit from any undertaking, whether you are making a case for replacing old equipment or starting a fresh marketing program. Using ROI and other cash flow metrics are an excellent method to help you build your business case — especially in the case of technology investments where financial managers can identify expected costs and benefits to calculate ROI. For example, you may want to make a business case for an event your company is considering hosting. Based on the ROI of past events, you can give your company information on what level of event is relevant for their goals. For example, you can make a case for a large formal event rather than a small less-costly cocktail party if the ROIs are markedly different, and the large event generates more customers. Use this simple event ROI calculator template to discover what ROI your past events yielded by inputting the number of attendees, costs, and deal information. The outputs then give the event cost per person, the ROI, and the ROI percent.
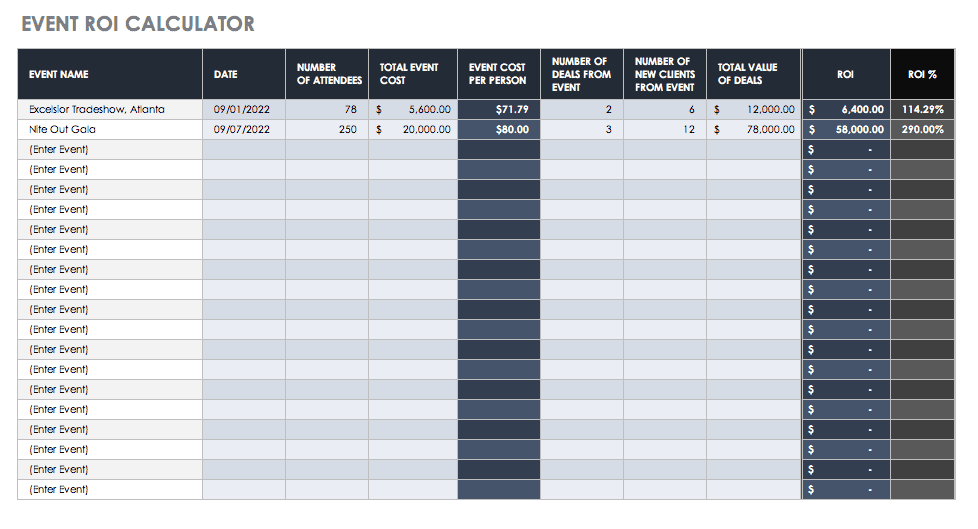
Download Business Case and Event ROI Template — Excel
Justification and Total Cost of Ownership ROI Template
In the same vein as proving a business case, a business plan must have some type of economic justification to provide stakeholders with the knowledge that they are making sound policy and finance decisions. ROI is an appropriate choice, although it does not consider the intangible or fuzzy costs and the benefits that a cost-benefit analysis (CBA) might reveal. However, since those measures are fuzzy, they may not accurately represent the data anyway.
Total cost of ownership (TCO) helps assess costs across an enterprise for products or systems. Mainly used in IT, TCO generally includes not only the hardware and software, but the acquisition, management, support, expenses, training, and any other productivity losses to be expected during implementation. This calculation is made using data over a number of years, so you can present the TCO lifecycle. TCOs can be used to comprehensively justify new software purchases — especially since they are generally such expensive prospects. TCO is the negative data in an ROI equation that shows what you are spending.
Additionally, many professionals interested in TCO also want cost avoidance data, or the positive data in an ROI equation. For example, with both TCO and cost avoidance, you can calculate the ROI of replacing a software system that performs some function that saves you money.
Use this template for such a scenario, where the TCO of a software system (such as a virtual briefing platform) and the cost avoidance of a virtual briefing are combined to discover ROI. You can also use the template independently to determine either TCO or cost avoidance. In this template, you will find space to input your direct and indirect costs across several years. Inputs include costs for the following:
-
Hardware
-
Software
-
Management
-
Support
-
Implementation
-
Programmatic work
There is also space to enter cost avoidance data. The following are calculated from the input data:
-
Total cost of ownership/year
-
Total substitution cost avoidance
-
ROI
-
ROI percent
-
ROI/year
-
Total potential cost avoidance
-
Potential ROI
-
Potential ROI percent
-
Potential ROI/year

Download Justification and Total Cost of Ownership ROI- Template – Excel
Simple ROI Templates
An ROI analysis can vary in the levels of its complexity. Regardless of the amount of data, the basic ROI formula details three steps:
-
Estimate the Cost: Costs may be hard or soft, depending on the project or event planned. Hard costs are simple and are anything that comes with a receipt, such as travel costs, registration fees, and entertaining costs. Each of these can be a line item when you build or use an ROI calculator. Soft costs are more complex since they can include the number of hours spent on preparing, attending, and following-up after the event. This can also include the time spent corresponding, researching, and traveling. Multiply these “soft” hours by the employees’ hourly rate from their base pay to calculate the soft cost. Combine the hard and soft costs for a better representation of the cost estimate.
-
Estimate the Return: First, define your success metric. For a conference-type event, this may vary, but consider the type of event and your company’s function in the marketplace. Your team should help you define your success metrics. Defining success metrics is part art, part science. If the metrics are developed, they should align with your strategic plan and your key performance indicators (KPIs).
-
Compute ROI: Calculate ROI by dividing the activity return by its cost. Below is another formula you may follow:
ROI = (Gain from investment – Cost of investment) / (Cost of investment)
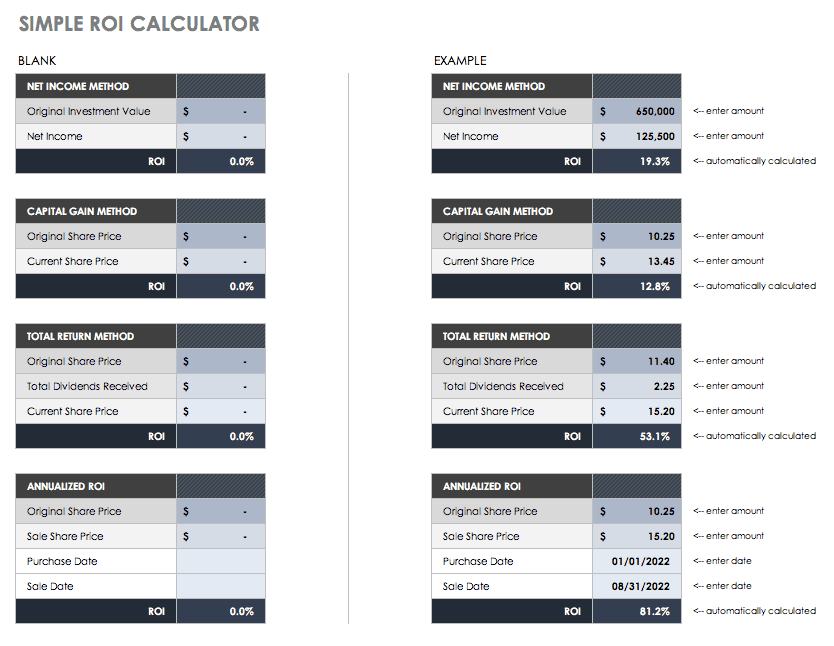
Simple ROI Calculator Excel Template
The attached simple ROI calculator is an Excel template. ROI may be calculated in Excel, but there is no specific formula for it — it simply displays inputs and outputs to help you come up with the final number. In this template, you will find four different methods to calculate ROI. But, you will always need to enter either your original investment value or share price.
Download Simple ROI Calculator Template
Excel | Smartsheet
The four methods in the above template include net income method, capital gain method, total return method, and the annualized method:
Net Income Method: Divide net profit by total assets. Enter your original investment value and its net income, which is what was earned less the taxes and deductions.
-
Capital Gain Method: Subtract your cost base from your capital proceeds. Enter your original share price and the current share price.
-
Total Return Method: The actual rate of return on an investment over a period of time, including capital gains, interest, and any dividends. Enter the original share price, your dividends, and the current share price.
-
Annualized Method: This is the geometric average amount earned every year over a given time. It is geometric to show compounding. Enter the original share price, the sale share price, when you purchased the share(s), and when you sold them.
What Is a Return on Investment (ROI)?
Companies use ROI to gauge the profits from any type of investment, whether time, money, or energy. Return on investment (ROI) is a performance measure that can be calculated in simple cases through a formula or in more complex cases via a template with multiple formulas. Calculations occur when you input what is spent versus what is earned. It can also be an investment view of a company’s cash flow via an action they took. In other words, the benefit of an investment is divided by the cost to see if it was worth making. ROI has many interpretations, depending on the business industry. For many businesses, ROI is simply the measurement of financial gain or loss relative to the costs such as deductions, fees, labor, or resources.
In project management, ROI helps businesses determine whether they want to invest in specific projects, and in the case of several projects, to decide between them. In the case of long-term projects, businesses must take into account inflation and future income to accurately calculate ROI. In the case of some quality projects, the ROI may be difficult to calculate because it’s hard to turn non-quantifiable data such as ideas and good feelings into monetary values. For example, spending money to put in a new breakroom may make your employees happier and feel more positive towards their environment. However, it’s difficult to calculate the revenue of a new break room.
ROI is used as a concept and a specific formula. As a concept, it can measure profitability or efficiency. People refer to ROI when discussing what they get back for their input. However, ROI is a true metric that can be calculated as a ratio or percentage. The basic formula to calculate ROI is:
ROI = Net Profit / Total Investment *100
You would use ROI for several reasons:
-
Provide Quantifiable Value: ROI provides leaders with information about a project’s worth, and can help garner their support by removing uncertainty and subjective benefits.
-
Build Stakeholder Support: When a project is up for decision (whether or not it gets approved), calculating the ROI gives stakeholders the information they need to either provide or deny their support.
-
Show Additional Benefits: Calculating ROI becomes a forcing function for staff to determine benefits they may not have considered at the start of a project.
-
Prioritize Projects: Many companies use ROI as a metric to rank their projects.
However, ROI modeling has some limitations. Some models do not adequately factor in accurate-enough costs and returns. Soft, or intangible, costs are difficult to assess. Another issue is that the costs and returns of a project may not match predictions. Finally, some ROI models may not give more than a financial measure of a project, giving stakeholders an inadequate measure of return or making the project’s actual return misunderstood.
There is more than one way to model ROI, and different analysts can model differently, possibly mischaracterizing the outcome. Therefore, stakeholders and business leaders should ask not only the ROI of a project but how it was modeled. The effects that a project has on more than just the business are sometimes left out. For example, social return on investment (SROI) is a modern metric that considers social, environmental, economic, and environmental outcomes in projects. SROI uses impact mapping, which is a strategic planning technique.
The ROI Formula
ROI is calculated by subtracting the project cost from the financial value. Financial value is what the project pays you back, but occasionally there is uncertainty in assigning monetary values to outcomes. To do so, break the values into known components and define them. These components usually include time, volume, and dollars for both the present and the project, such as this formula:
Financial value = TVD present – TVD project
T = time
V = volume, quantity of units
D = dollars/cost
Present = the current value
Project = the value of a successful project
One example of using this formula considers a project that decreases the production cycle by 20 percent. The team calculated that the production cost of their product was $5,000. The time to produce one unit was 10 hours, with a $90/hour wage and $41,00 worth of materials. For the production of 500 of these units, the product line cost was $2.5 million.
The project decreased the production cycle time by 20 percent, from 10 hours to eight hours, while keeping the remaining costs the same. The new production cost is $4,820 per unit and $2.41 million for the yearly product line. Therefore, using the formula above, the projects financial value is:
Financial value = $2,500,000 — $2,410,000 = $90,000 in annual savings
The project cost is the second component of the ROI formula. There are two main variables that compose project cost: work decomposition over time and cost of the work. The work decomposition over time breaks down the work or tasks into the most granular level possible, and in best practice by chronological order. In project management, this may also be known as the work breakdown structure (WBS). Here’s an example:
Insert Chart Here
For more information about WBS, see “Getting Started with Work Breakdown Structures (WBS).”
The costs of the required work need the practitioner to consider certain factors when they allot costs. Even these factors they can vary widely, they can include the following:
-
Any rentals/leases
-
Resources, such as workers
-
Wage rates
-
Hours to complete the work
-
Capital costs (hardware/software)
Once you have these costs defined, you can add them to your WBS, such as in the following example:
Insert Chart Here
Some other methods of breaking down work include the following:
-
Gantt Charts: These are the WBS over time, and put your tasks into phases of work. To create your own, see “How to Create a Gantt Chart in Excel.”
-
Process Maps or Process Flow Diagrams: These show the project work as workflow steps. This is a visual representation of your work. For more information on process maps, see “Essential Guide to Business Process Mapping.”
These are all helpful tools to cost out your projects, but practitioners should also consider the following:
-
One-time Costs Versus Costs Over Time: Some equipment may be a one-time purchase or a rental over years. Include those costs over the period to get accurate ROI figures.
-
Consider What the Opportunity Cost May Be: When you have more than one project to compare, there may be savings you can attribute back to your company. Remember that the opportunity to perform the project may have value.
-
Estimate Liberally: Whenever there is a gray area for cost estimation, estimate higher. Cost overruns delay projects and erode confidence.
Once you have calculated all the financial values and project costs, the ROI formula is simple. Let’s assume in the following example that there is a one-time cost of $400,000 for our project to decrease the production time by 20 percent. In this example, Year 5 breaks even, and as the company goes forward, there is an appreciable saving:
Insert Chart Here
ROI and Returns-Based Analysis
Another calculation that is important in a discussion of ROI is returns-based analysis. The financial industry performs style analyses when they are trying to determine the type of investment behavior either an investor or a money manager is using. Two distinct types of styles are holdings-based and returns-based. Returns-based is more widely used by financial professionals because monthly input data is readily available. The returns-based analysis compares three to five years of a portfolio’s monthly returns to the total returns of various style-based indexes. Inferences can be made about how closely the portfolio resembles the different indexes. In other words, a fund manager or investor professes that they will invest in a certain manner. A returns-based analysis is a model that shows if they have done so. Although not directly calculating ROI, a returns-based analysis can help determine whether your investment manager is worth their cost.
Make Better ROI Decisions, Faster with Charts in Smartsheet
Empower your people to go above and beyond with a flexible platform designed to match the needs of your team — and adapt as those needs change.
The Smartsheet platform makes it easy to plan, capture, manage, and report on work from anywhere, helping your team be more effective and get more done. Report on key metrics and get real-time visibility into work as it happens with roll-up reports, dashboards, and automated workflows built to keep your team connected and informed.
When teams have clarity into the work getting done, there’s no telling how much more they can accomplish in the same amount of time. Try Smartsheet for free, today.