
What Is a Payback Period?
The payback period is the amount of time (usually measured in years) it takes to recover an initial investment outlay, as measured in after-tax cash flows. It is an important calculation used in capital budgeting to help evaluate capital investments. For example, if a payback period is stated as 2.5 years, it means it will take 2½ years to receive your entire initial investment back.
Key Takeaways
- The payback period is the amount of time needed to recover an initial investment outlay.
- The main advantage of the payback period for evaluating projects is its simplicity.
- A few disadvantages of using this method are that it does not consider the time value of money and it does not assess the risk involved with each project.
- Microsoft Excel provides an easy way to calculate payback periods.
- The formula for calculating the payback period is the initial investment divided by incoming cash flows.
Advantages and Disadvantages of the Payback Period
One primary advantage of evaluating a project or an asset by its payback period is that it is straightforward. Basically, you’re asking: «How many years until this investment breaks even?» It is also easy to apply across several projects. When analyzing which project to undertake or invest in, you could consider the project with the shortest payback period.
The discounted payback period determines the payback period using the time value of money.
But there are a few important disadvantages that disqualify the payback period from being a primary factor in making investment decisions. First, it ignores the time value of money, which is a critical component of capital budgeting. For example, three projects can have the same payback period; however, they could have varying flows of cash.
Without considering the time value of money, it is difficult or impossible to determine which project is worth considering. Also, the payback period does not assess the riskiness of the project. Projecting a break-even time in years means little if the after-tax cash flow estimates don’t materialize.
How to Calculate the Payback Period in Excel
Financial modeling best practices require calculations to be transparent and easily auditable. The trouble with piling all of the calculations into a formula is that you can’t easily see what numbers go where or what numbers are user inputs or hard-coded.
The easiest method to audit and understand is to have all the data in one table and then break out the calculations line by line.
Calculating the payback period by hand is somewhat complex. Here is a brief outline of the steps to calculate it in Excel, with the exact formulas in the table below (note: if it’s hard to read, right-click and view it in a new tab to see full resolution):
- Enter the initial investment in the Time Zero column/Initial Outlay row.
- Enter after-tax cash flows (CF) for each year in the Year column/After-Tax Cash Flow row.
- Calculate cumulative cash flows (CCC) for each year and enter the result in the Year X column/Cumulative Cash Flows row.
- Add a Fraction Row, which finds the percentage of remaining negative CCC as a proportion of the first positive CCC.
- Count the number of full years the CCC was negative.
- Count the fraction year the CCC was negative.
- Add the last two steps to get the exact amount of time in years it will take to break even.
What Is the Formula for Payback Period in Excel?
Calculating the payback period in Excel is the simplest when the annual cash flows are the same for each year. First, input the initial investment into a cell (e.g., A3). Then, enter the annual cash flow into another (e.g., A4). To calculate the payback period, enter the following formula in an empty cell: «=A3/A4» as the payback period is calculated by dividing the initial investment by the annual cash inflow.
How Do I Calculate a Discounted Payback Period in Excel?
The discounted payback period is the number of years it takes to pay back the initial investment after discounting cash flows. In Excel, create a cell for the discounted rate and columns for the year, cash flows, the present value of the cash flows, and the cumulative cash flow balance. Input the known values (year, cash flows, and discount rate) in their respective cells. Use Excel’s present value formula to calculate the present value of cash flows.
To calculate the cumulative cash flow balance, add the present value of cash flows to the previous year’s balance. The cash flow balance in year zero is negative as it marks the initial outlay of capital. Therefore, the cumulative cash flow balance in year 1 equals the negative balance from year 0 plus the present value of cash flows from year 1. Identify the last year in which the cumulative balance was negative. The discounted payback period is calculated by adding the year to the absolute value of the period’s cumulative cash flow balance and dividing it by the following year’s present value of cash flows.
How Do You Calculate Payback Period?
The payback period is calculated by dividing the initial capital outlay of an investment by the annual cash flow.
Payback Period = Initial Investment / Annual Cash Flow
The payback period as by its name is the number of years (or amount of time) it takes to recover the initial capital back from an investment. From investing point of view, every investor has a defined target or tolerance level as for how long they are willing to wait for a return from the investment they make. It is calculated using the after-tax cash flows only.
It is one of the popular accounting terms or methods which are used to calculate the investment strategies and returns of an investment namely, Internal Rate of Return (IRR), Net Present Value (NPV), Payback Period, etc., as this is all investors need to make a decision as these capital budgeting factors help analyze the internal and working prospects of an investment.
For example, if a payback period is stated as 5 years, it means it will take 5 years for the investment to pay the entire initial investment back.
Advantage:
Easy to calculate and also simple to evaluate and analyze.
Disadvantage:
The accounting method is not completely dependable as it does not consider some critical capital budgeting components, as market valuation, inflation (value of money), external factors, and lastly demand and supply.
Without any further ado, let’s get started with calculating the payback period in Excel.
Step 1. Build the dataset
- Enter financial data in your Excel worksheet.
- If your data contains both Cash Inflows and Cash Outflows, calculate “Net Cash flow” or “Cumulative Cash flow” by applying the formula:
- =Cash Inflows – Cash Outflows, as shown below in our example [B2-C2]

Step 2. Break-even Point – Years with Negative Cash Flow
Now, as you input the data values and calculate the Net Cash Flow, let’s start with the main steps:
- We need to calculate Number of Years in which the Cash Flow is Negative (-)
- To perform this, we use COUNTIF function as:
=COUNTIF({all values in cash flow column}, “{check}”)
- Here, in our example we apply this as, by selecting all the data values in the Net Cash Flow column and then checking for those which are less than 0(<0) which means, negative
=COUNTIF(E2:E7, “<0”)
What is the Break-even point and why do we calculate it?
When the cumulative cash flows exceed the initial investment, it is termed as the break-even point of the project (The break-even point is the point of no profit and no loss). The time taken to reach (years) the break-even point is the Payback Period. But this Payback period is approximate and not exact. To calculate the exact payback period we apply the next steps.

Step 3. Last Negative Cash Flow
- Now, we calculate the negative cash flow which is the most recent, in other words the last or latest negative cash flow.
- Even though we may look at the Net Cash Flow column and find it, but here in our example we will do the same using function in Excel
- To find the last negative cash flow we use the VLOOKUP function, which takes three arguments as for our usage.
=VLOOKUP(Lookup value, Table array(complete), Column index)
Lookup Value is the value which from whose count we intend to search for (here, negative cash flow years – in cell E9)
Table array is the selection of the whole table values (here, A1:E7)
Column Index is the index of the column where we need to find our value (here, 5th column)
=VLOOKUP(E9, A1:E7, 5)

Step 4. Cash Flow in the Next Year
- Now we calculate the estimated Cash flow for the next year.
- As the formula used in previous step, we need to make some modification to it
=VLOOKUP(Lookup value + 1, Table array(complete), Column index)
Lookup value is incremented by 1 as we need to get the cash flow of next year
Also, now we need to search for in the column of Cash Inflows, (2nd column)
VLOOKUP(E9+1, A1:E7, 2)

Step 5. Fraction Year Value (month)
- Calculate the fractional value of year
- This fractional value is calculated as (Last Negative Cash Flow / Cash Flow in Next Year)
- This fractional value is used to know the exact month number for payback period.
- As fractional value represent month of an year, it cannot be negative, hence, we use the absolute function – ABS
=ABS(last negative cash flow/cash flow in next year)
In our example, fractional value is calculated as:
=ABS(E10/E11)

Step 6. Total Payback Period
- The Final Step, as now we have calculated both negative cash flow years (years to reach break-even point) and fraction value (exact years/months of payback period)
- To calculate the Actual and Final Payback Period we:
=Negative Cash Flow Years + Fraction Value
which, when applied in our example =E9 + E12 = 3.2273
This means it would take 3 years and 2 months (approx.) for our investment to capital to start giving returns.

Conclusion
That’s It! Hope you have learned well – What is Payback Period, and how to calculate Payback in Excel.
Listen to this:
The payback period helps us to calculate the time taken to recover the initial cost of investment without considering the time value of money.
This means that it will not evaluate the project based on the present value of money but on the basis of the actual investment made. Also, the shorter the payback the better it is as we are recovering the initial investment deployed in the business.
Table Of Contents
- Types of Payback Period
- Features of the Payback Period Formula
- Advantages and Disadvantages of Payback Period formula
- How to calculate in excel?
- Learn advanced excel concepts with Advanced Excel Tutorial Online by Market Experts
- Frequently Asked Questions
- What is a payback period?
- What is the difference between payback period and return on investment?
- How do you calculate the payback period for a business?
- How is a payback period calculated?
- Conclusion
This method is mostly used by private companies because they are more concerned about liquidity. Once they invest in a huge project their capital is blocked.
Hence, they want to know the time duration in which they will get back the initial investment made so that they can deploy the same in other ventures.
Types of Payback Period
There are two types of payback period that are popularly used –
Non-discounted payback period – This is the general payback period. It does not take into account the time value of money while calculating the time taken to recover the initial cost of investment.
Discounted Payback Period – Discounted payback period is the time taken to recover the initial cost of investment, but it is calculated by discounting all the future cash flows. This method of calculation does take the time value of money into the account.
Features of the Payback Period Formula
The payback period formula has some unique features which make it a preferred tool for valuation. Some of these are –
- This formula is one of the easiest ways for businesses to understand the time it’ll take for their operations to reach break-even point (where there is no profit and no loss).
- This method is very suitable for small businesses with small cash balances, as it is a simple formula that requires minimal and basic information.
- Out of the various factors which affect a business’s ability to reach the break-even point, it focuses most on the speed of recovery of investment.
Advantages and Disadvantages of Payback Period formula
Advantages
- As mentioned before, it is the most straightforward way to calculate the time taken to reach the break-even point.
- This formula can be applied towards any kind of project, irrespective of time duration, capital size, etc.
Disadvantages
- The biggest disadvantage of this formula is that it originally does not take the time value of money into the account. This disadvantage is countered by the discounted payback period formula.
- The formula does not take into account any risk. It only considers the speed with which we can recover our initial capital.
- Since the formula does not consider the capital size, it can only be used in combination with other techniques when it comes to capital budgeting.
How to calculate in excel?
Just like many other valuation techniques, the payback period can be calculated with the help of MS Excel. Calculating it through this method is the easiest way to do it for finance and non-finance managers.
We will understand the process of calculation with the help of an example:
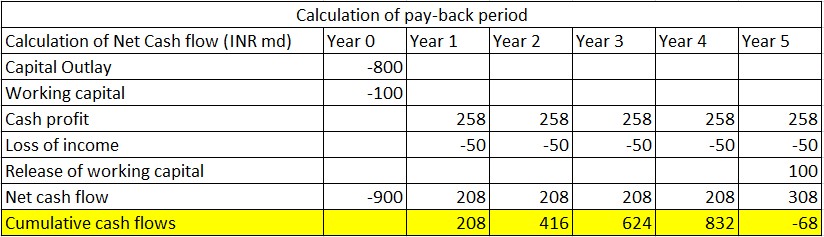
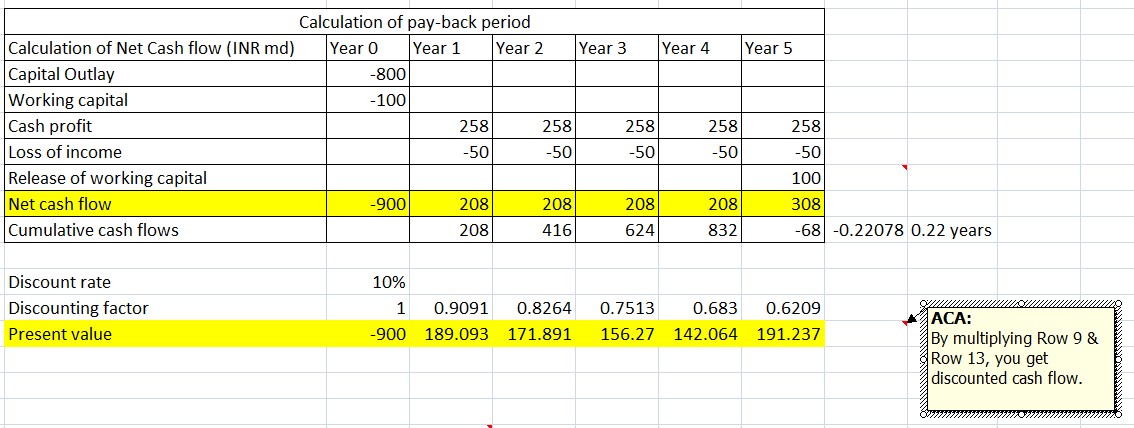
In the above excel sheet, you will see that the company earns a cumulative cash flow of Rs. 832 at the end of the fifth year.
Learn advanced excel concepts with Advanced Excel Tutorial Online by Market Experts
Hence, the amount yet to be recovered –
Initial cash flow invested (outflow) – total cumulative cash flows (inflow) = 900-832 = Rs. 68
Now, the time taken to recover the balance amount of Rs. 68 i.e the time taken to generate this amount will be 0.22 years (68/308).
Hence, the total pay-back period will be 4+0.22 = 4.22 years, as below:

So now we know that 4.22 is the payback period in which we will recover our initial cost of investment of Rs. 900/-
The calculation of the payback method is not an accurate method as it ignores the time value of money, which is a very important concept. Also, this period does not consider the cash flows received after the pay-back period. Hence, it is not a very appropriate method on a stand-alone basis.
The time value of money, which is an important element, can be taken care of while calculating the discounted payback period.
Let us understand the concept of the discounted payback period with the help of the previous example. In the case of discounted payback period, we need to calculate the present value of the cash flows.
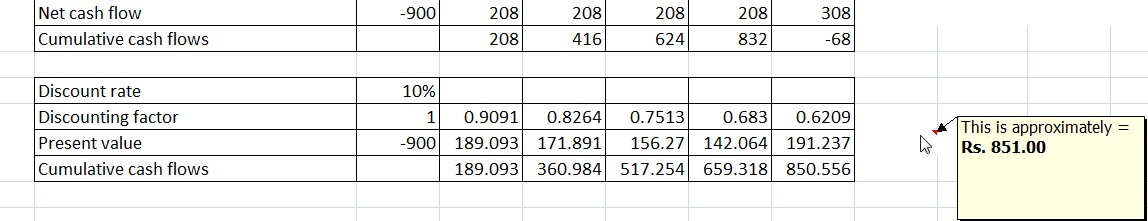
In the above figure you will see that the cumulative amount (ignoring the decimal) aggregates to Rs. 851, which means that even till 5 years, we have not been able to recover the initial investment made.
Hence, we will get the negative of Rs. 49, as shown below:
NPV = Outflow – Inflow = [-900 – (-851)] = (49)
So in this case, as the project is not recovering my initial cash flow, we are not able to calculate the payback period, but it will surely be 5+ years. So that is the difference when taking the discounting payback period.
Once you do not take the time value of money into consideration, the results are positive as we are able to complete the project within the life of the project. On the other hand, if we consider the time value of money, the project goes negative. As seen in the above example, we will not be able to recover the money and will have a loss of Rs. 49/-.
Frequently Asked Questions
What is a payback period?
It helps investors to understand the component which is helping the company to drive profitability. It helps to know if the company is running on debt or more Equity funding or genuine cash flows.
What is the difference between payback period and return on investment?
The payback period is the time calculated in months or years by which time your initial investment into any business is expected to yield returns anticipated by you
How do you calculate the payback period for a business?
Payback period refers to the time taken by an initial investment to yield returns whereas return on Investment means the percentage yield delivered by the initial investment.
How is a payback period calculated?
It is calculated by calculating the time period over which the Initial Capital investment is returned by the business and the business by itself starts generating more capital. Thus the time frame between these two is known as the calculation of the payback period.
Conclusion
The discounted payback period will always be lower than the payback period because we are using the discounted cash flow which will always be lower than the normal cash flows.
So by now, we have learned the steps for estimating cash flows, few methodologies for estimating our project results. Apart from these, there are also other accounting methodologies that can be used.
The payback period is the time it takes for a project to recover the investment cost. For example, if you invest $100 and the returns are $50 per year, you will recover your initial investment in two years.

The payback period is a simple and quick way to assess the convenience of an investment project and to compare different projects. For example, if project A has a payback period of three years, while project B has a payback period of four years, you will choose project A.
Can you notice an issue with the payback period? Think for a moment. OK, the payback period has two main issues:
- It doesn’t take the time value of money into account.
- It doesn’t take into account all the cash flows that happen after the accumulated cash flow is zero.
The time value of money is an economic concept that refers to the fact that money available in a near future is worth more than the identical sum in the far future.
The payback period can be seen as the time it takes a project, to reach an accumulated cash flow of zero. But two different projects can have the same payback period, while the first one has larger positive cash flows after the payback period. Clearly, the first one is preferable.
Alternatives to the Payback Period
Because of the issues with the payback period, the Internal Return Rate (IRR) and the Net Present Value (NPV) are better alternatives to the PP. These measurements do take the time value of money and all the cash flows into account.
Examples of the Payback Period
Same cash flow every year
When the cash flow remains constant every year after the initial investment, the payback period can be calculated using the following formula:
PP = Initial Investment / Cash Flow
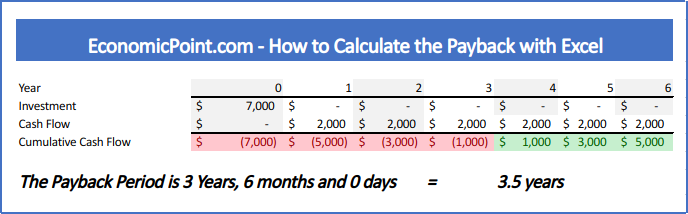
For example, if you invested $10,000 in a business that gives you $2,000 per year, the payback period is $10,000 / $2,000 = 5
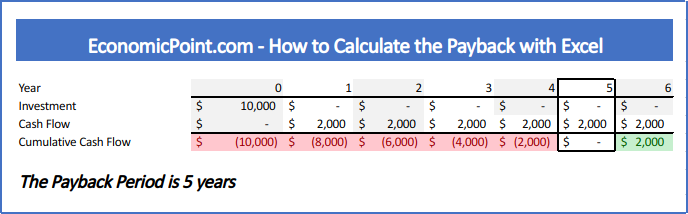
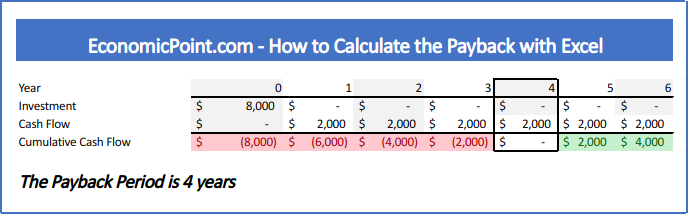
If you invested $8,000 and the cash flow remains $2,000 per year, the payback period reduces to 4 years:
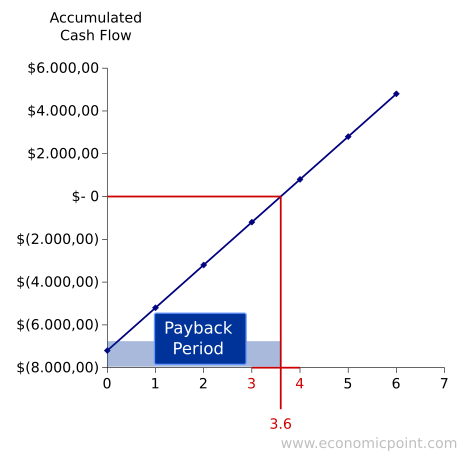
Another way to view the payback period is to check when the accumulated cash flow, including all the investments, equals zero. But sometimes this is not so easy, because there is a period of negative accumulated cash flow followed by a period with positive accumulated cash flow. There is no period with zero accumulated cash flow.
In this case, what period do we take into account? The first one or the second one?
When there is no period of zero accumulated cash flow, the payback period will be a positive rational number, not an integer. To calculate the payback, you must estimate the fraction of the year that passed since the cash flow was negative for the last time until it reached the zero value. For this estimation, we assume a linear behavior of the evolution of the cash flow.
If the absolute value of the last negative accumulated cash flow is the same as the first accumulated positive one, the fraction is 0.5, like in the following example:
In the following plot, we can see the evolution of the accumulated cash flow:
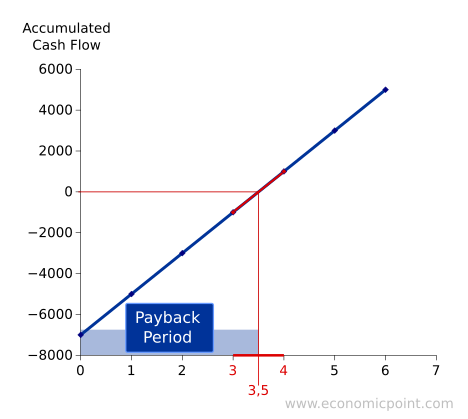
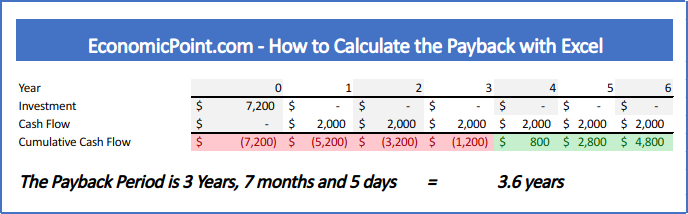
When the absolute value of the last accumulated cash flow is not the same as the first positive cash flow, the fraction will not be 0.5:
How to Calculate the Payback Period in Excel
While is it possible to have a single formula to calculate the payback, it is better to split the formula into several partial formulas. This way, it is easier to audit the spreadsheet and fix issues.
Follow these steps to calculate the payback in Excel:
- Enter all the investments required. Usually, only the initial investment.
- Enter all the cash flows.
- Calculate the Accumulated Cash Flow for each period
- For each period, calculate the fraction to reach the break even point. Use the formula “ABS”
- Count the number of years with negative accumulated cash flows. Use the formula “IF”
- Find the fraction needed, using the number of years with negative cash flow as index. Use the formula “INDEX”
- To get the exact payback period, sum the number of years with negative accumulated cash flow and the corresponding fraction
Shameless plug: We created an Excel file to calculate the payback. It updates automatically and allows to enter multiple investments, not only an initial investment. It displays the payback using fraction years and also years months and days. Actually, we used this file to create our examples, you can get it for only $5 using the following link:
На чтение 5 мин Просмотров 261к.
Рассмотрим такой инвестиционный показатель как срок окупаемости инвестиций, его модификации, примеры и формулы расчета.
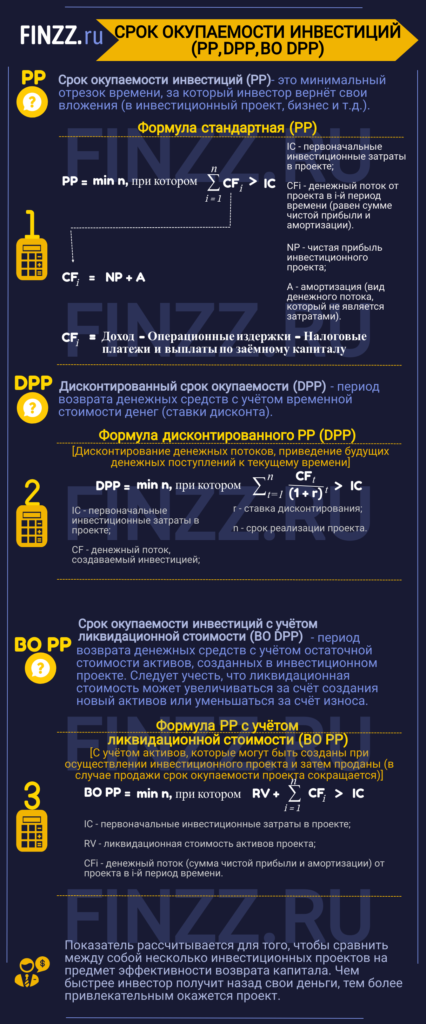
Срок окупаемости инвестиций (англ. PP, payback period) – это минимальный период времени возврата вложенных средств в инвестиционный проект, бизнес или любую другую инвестицию. Срок окупаемости является ключевым показателем оценки инвестиционной привлекательности бизнес плана, проекта и любого другого объекта инвестирования. Рассмотрим различные показатели срока окупаемости используемые на практике:
- Срок окупаемости инвестиций (PP).
- Дисконтированный срок окупаемости инвестиций (DPP).
- Срок окупаемости инвестиций с учетом ликвидационной стоимости (BO PP).
Содержание
- Инфографика: Срок окупаемости инвестиций (PP, DPP, BO DPP)
- #1 Срок окупаемости инвестиций (PP). Формула
- Cрок окупаемости инвестиций (PP). Пример расчета в Excel
- #2 Дисконтированный срок окупаемости инвестиций (DPP). Формула расчета
- Расчета дисконтированного срока окупаемости инвестиций в Excel
- Мастер-класс: «Как рассчитать срок окупаемости для бизнес плана: инструкция»
- #3 Срок окупаемости инвестиций с учетом ликвидационной стоимости
- Расчет срока окупаемости инвестиции с учетом ликвидационной стоимости в Excel
Инфографика: Срок окупаемости инвестиций (PP, DPP, BO DPP)
★ Инвестиционная оценка в Excel. Расчет NPV, IRR, DPP, PI за 5 минут
Данный показатель позволяет сравнивать между собой различные проекты по степени их эффективности возврата капитала.
#1 Срок окупаемости инвестиций (PP). Формула

где:
IC (Invest Capital) – первоначальные инвестиционные затраты в проекте;
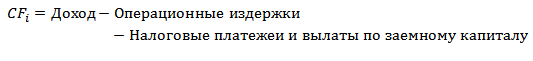
CFi (Cash Flow) – денежный поток от проекта в i-й период времени, который представляет собой сумму чистой прибыли и амортизации.
Для расчета денежного потока необходимо воспользоваться следующими формулами:
![]()
или
 где:
где:
А (Amortization) – амортизация, вид денежного потока, который не является затратами;
NP (Net Profit) – чистая прибыль инвестиционного проекта.
Cрок окупаемости инвестиций (PP). Пример расчета в Excel
Рассчитаем срок окупаемости инвестиций в проект с помощью программы Excel. Для этого необходимо определить первоначальные затраты, которые в нашем примере составили 100000 руб., далее необходимо спрогнозировать будущие денежные поступления (CF) и определить с какого периода сумма денежного потока превысит первоначальные инвестиционные затраты. На рисунке ниже показан расчет срока окупаемости проекта. Формула расчета денежного потока нарастающим итогом следующая:
Денежный поток нарастающим итогом (CF) =C6+D5
, бизнеса. Пример расчета в Excel")
На пятом месяце сумма денежных поступлений окупит первоначальные затраты, поэтому срок окупаемости составит 5 месяцев.
Основные недостатки использования данного показателя в оценке инвестиций заключаются:
- Отсутствие дисконтирования денежных потоков бизнес проекта.
- Не рассматриваются денежные поступления за пределами срока окупаемости.
#2 Дисконтированный срок окупаемости инвестиций (DPP). Формула расчета
Дисконтированный срок окупаемости (англ. DPP, Discounted Payback Period) – период возврата денежных средств с учетом временной стоимости денег (ставки дисконта). Главное отличие от простой формулы срока окупаемости – это дисконтирования денежных потоков и приведение будущих денежных поступлений к текущему времени.

где:
DPP (Discounted Payback Period) – дисконтированный срок окупаемости инвестиций;
IC (Invest Capital) – первоначальные инвестиционные затраты в проекте;
CF (Cash Flow) – денежный поток, создаваемый инвестицией;
r – ставка дисконтирования;
n – срок реализации проекта.
Рассмотрим пример оценки дисконтированного срока окупаемости инвестиций для бизнес-плана. Первоначальные инвестиции составили 100000 руб., денежный поток изменялся ежемесячно и отражен в столбце «С». Ставка дисконтирования была взята равной 10%. Для расчета дисконтированного денежного потока воспользуемся следующей формулой:
Дисконтированный денежный поток =C7/(1+$C$3)^A7
Денежные поступления нарастающим итогом =E7+D8

Проект окупится на 5 месяц, в котором денежные поступления составят 100860 руб.
Мастер-класс: «Как рассчитать срок окупаемости для бизнес плана: инструкция»
#3 Срок окупаемости инвестиций с учетом ликвидационной стоимости
Срок окупаемости с учетом ликвидационной стоимости (англ. Bail-Out Payback Period) – представляет собой период возврата денежных средств с учетом остаточной стоимости активов, созданных в инвестиционном проекте. При осуществлении инвестиционного проекта могут создаваться активы, которые могут быть проданы (ликвидированы) в результате этого срок окупаемости проекта существенно сокращается.
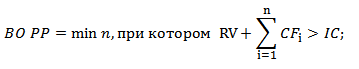
где:
IC (Invest Capital) – первоначальные инвестиционные затраты в проекте;
RV (Residual Value)– ликвидационная стоимость активов проекта;
CFi (Cash Flow) – денежный поток от проекта в i-й период времени, который представляет собой сумму чистой прибыли и амортизации.
Ликвидационная стоимость может, как увеличиться в результате создания новых активов, так и уменьшаться за счет износа.
Расчет срока окупаемости инвестиции с учетом ликвидационной стоимости в Excel
На рисунке ниже показан расчет периода окупаемости проекта с учетом ликвидационной стоимости. Формула в Excel достаточно простая и имеет вид:
Денежные поступления с ликвидационной стоимостью =C6+E5+D6

В итоге, срок окупаемости с учетом ликвидационной стоимости составит ~4 лет. Данный способ оценки целесообразно применять при высокой ликвидности создаваемых активов. Как можно заметить, в данном варианте расчета срока окупаемости тоже может быть использована ставка дисконтирования.
Кроме срока окупаемости инвестиций существуют другие показатели оценки эффективности, позволяющие более точно провести анализ проекта. Более подробно о них вы можете узнать в статье: «6 методов оценки эффективности инвестиций в Excel. Пример расчета NPV, PP, DPP, IRR, ARR, PI«.
★ Инвестиционная оценка в Excel. Расчет NPV, IRR, DPP, PI за 5 минут
Резюме
Срок окупаемости является важнейшим показателем инвестиционного анализа проектов и бизнеса. Он позволяет определить целесообразность вложения в тот или иной проект. Использование дисконтирования денежных потоков и ликвидационной стоимости активов позволяет инвестору более точно оценить период возврата капитала. Помимо данного коэффициента необходим анализ через другие показатели эффективности: чистой приведенной стоимости (NPV), внутренней нормы доходности (IRR) индекса прибыльности (PI). Кроме точечной оценки необходим анализ динамики денежных потоков и их равномерность.
Автор: к.э.н. Жданов Иван Юрьевич