
Продолжаем работать в Excel через Powershell. Напомню, что в предыдущей части мы создали небольшую таблицу и заполнили её данными. Также напомню, что это не моё “изобретение”, а очень вольный перевод вот этих трёх статей.
Для начала подготовим плацдарм для работы: создадим объект Excel и заполним его начальными данными. Я не буду на этом останавливаться, так как это было подробно рассмотрено в прошлой статье.
# Создаём Excel
$Excel = New-Object -ComObject Excel.Application

# Делаем Excel видимым
$Excel.Visible = $true

# Добавляем рабочую книгу
$WorkBook = $Excel.Workbooks.Add()

# Цепляемся к первому листу
$DiskInformation = $WorkBook.Worksheets.Item(1)

# Переименовываем лист
$DiskInformation.Name = 'Информация о дисках'

# Заголовок таблицы (самая первая ячейка)
$Row = 1
$Column = 1
$DiskInformation.Cells.Item($Row, $Column) = 'Сведения о дисковом пространстве'

# Форматируем текст, чтобы он был похож на заголовок
$DiskInformation.Cells.Item($Row, $Column).Font.Size = 18
$DiskInformation.Cells.Item($Row, $Column).Font.Bold = $true
$DiskInformation.Cells.Item($Row, $Column).Font.ThemeFont = 1
$DiskInformation.Cells.Item($Row, $Column).Font.ThemeColor = 4
$DiskInformation.Cells.Item($Row, $Column).Font.ColorIndex = 55
$DiskInformation.Cells.Item($Row, $Column).Font.Color = 8210719

# Объединяем диапазон ячеек
$Range = $DiskInformation.Range('A1','G2')
$Range.Merge()
На данном этапе у нас будет одна текстовая строка, размещённая в диапазоне ячеек с A1 по G2, т.е. в двух строках и семи столбцах, что по умолчанию выглядит не очень презентабельно, так как текст выравнивается по нижнему краю:

Объединённые ячейки (неформатированные)
Чтобы текст в объединённых ячейках выглядел красивее его можно выровнять по вертикали по центру.
Все варианты вертикального выравнивания можно посмотреть в MSDN. А значения, которые нужно при этом использовать можно узнать выполнив команду:
[Enum]::getvalues([Microsoft.Office.Interop.Excel.XLVAlign]) |
    Select-Object @{n="Name";e={"$_"}},value__
В результате мы увидим следующую таблицу:
| Name | value__ |
| xlVAlignTop | -4160 |
| xlVAlignJustify | -4130 |
| xlVAlignDistributed | -4117 |
| xlVAlignCenter | -4108 |
| xlVAlignBottom | -4107 |
Из таблицы видно, что для выравнивания по середине нужно использовать значение
–4108.
Выравниваем:
# Выравнивание по вертикали
$Range.VerticalAlignment = -4108
После выравнивания наш текст будет выглядеть уже красивее:

Объединённые ячейки (отформатированные)
Переходим к заполнению таблицы данными.
Для начала переходим на следующую строку. Так как в последствии вокруг таблицы мы нарисуем рамку, нам понадобится номер начальной строки, поэтому сохраним его в отдельной переменной.
Начинаем с шапки таблицы:
# Переходим на следующую строку
$Row++; $Row++

# Номер начальной строки
$InitialRow = $Row

# Заполняем шапку таблицы, устанавливая цвет фона ячейки и текст жирным
$DiskInformation.Cells.Item($Row, $Column) = 'Буква диска'
$DiskInformation.Cells.Item($Row, $Column).Interior.ColorIndex = 15
$DiskInformation.Cells.Item($Row, $Column).Font.Bold = $true
$Column++

$DiskInformation.Cells.Item($Row, $Column) = 'Метка'
$DiskInformation.Cells.Item($Row, $Column).Interior.ColorIndex = 15
$DiskInformation.Cells.Item($Row, $Column).Font.Bold = $true
$Column++

$DiskInformation.Cells.Item($Row, $Column) = 'Размер'
$DiskInformation.Cells.Item($Row, $Column).Interior.ColorIndex = 15
$DiskInformation.Cells.Item($Row, $Column).Font.Bold = $true
$Column++

$DiskInformation.Cells.Item($Row, $Column) = 'Занято'
$DiskInformation.Cells.Item($Row, $Column).Interior.ColorIndex = 15
$DiskInformation.Cells.Item($Row, $Column).Font.Bold = $true
$Column++

$DiskInformation.Cells.Item($Row, $Column) = 'Свободно'
$DiskInformation.Cells.Item($Row, $Column).Interior.ColorIndex = 15
$DiskInformation.Cells.Item($Row, $Column).Font.Bold = $true
$Column++

$DiskInformation.Cells.Item($Row, $Column) = 'Свободно, %'
$DiskInformation.Cells.Item($Row, $Column).Interior.ColorIndex = 15
$DiskInformation.Cells.Item($Row, $Column).Font.Bold = $true

# Переходим на следующую строку, возвращаемся в первый столбец
$Row++
$Column = 1
Сама таблица заполняется в цикле по логическим дискам:
Get-WmiObject Win32_LogicalDisk -Filter "DriveType = 3" | ForEach-Object {...}
Фильтрация нужна для того, чтобы исключить из рассмотрения CD/DVD диски (которые чаще всего пустые, и следовательно их размер будет равен нулю).
В цикле выводим в таблицу, интересующую нас информацию:
# Буква
$DiskInformation.Cells.Item($Row, $Column) = $_.DeviceID
$Column++

# Метка
$DiskInformation.Cells.Item($Row, $Column) = $_.VolumeName
$Column++

# Размер
$DiskInformation.Cells.Item($Row, $Column) = ([Math]::Round($_.Size/1GB, 2))
$Column++

# Занято
$DiskInformation.Cells.Item($Row, $Column) =
    [math]::Round((($_.Size - $_.FreeSpace)/1GB),2)
$Column++

# Свободно
$DiskInformation.Cells.Item($Row, $Column) =
    ([Math]::Round($_.FreeSpace/1GB, 2))
$Column++

# Сводобно, %
$DiskInformation.Cells.Item($Row, $Column) =
    ("{0:P}" -f ($_.FreeSpace / $_.Size))
А также раскрашиваем строки в зависимости от процента свободного места на диске. Для простоты я раскрашиваю строку, относящуюся к конкретному диску в жёлтый цвет, если свободного места на нём меньше 5 ГБ, и в красный цвет, если свободного места меньше 1 ГБ:
# Смотрим на заполненность дисков и раскрашиваем

# Выделяем строку таблицы
$Range = $DiskInformation.Range(("A{0}" -f $Row),("F{0}" -f $Row))
$Range.Select() | Out-Null

# Если свободного места меньше 1 ГБ
if ($_.FreeSpace -lt 1GB)
{
    # Подсвечиваем красным
    $Range.Interior.ColorIndex = 3
}

# Если свободного места меньше 5 ГБ
elseif ($_.FreeSpace -lt 5GB)
{
    # Подсвечиваем жёлтым
    $Range.Interior.ColorIndex = 6
}

# Переходим на следующую строку и возвращаемся к первой строке
$Column = 1
$Row++
Смотрим, что получилось:

Результаты работы (неформатированные)
Как видно на дисках C и D свободного места меньше 5 ГБ, поэтому соответствующие строки подсвечены жёлтым цветом. А на Диске F свободного места вообще меньше 1 ГБ, поэтому он подсвечен красным цветом. Кстати, для быстрого забивания диска мне пришёл на помощь скрипт, генерирующий файл заданного размера.
В целом работа выполнена. Осталось привести таблицу к боле красивому виду. Для этого мы выровняем ширину столбцов в таблице и нарисуем рамку вокруг таблицы.
Начнём с рамки.
Сейчас курсор стоит уже на следующей строке, так как в цикле мы его перевели находясь ещё в цикле. А так как нам нужны только строки таблицы возвращаемся на одну строку назад и выделяем таблицу:
# Возвращаемся на одну строку назад
$Row--

# Выделяем нашу таблицу
$DataRange = $DiskInformation.Range(("A{0}" -f $InitialRow), ("F{0}" -f $Row))
Напомню, что $InitialRow – это номер начальный строки таблицы, который мы заранее сохранили.
Переходим к “рисованию” рамки – границы диапазона ячеек.
Чтобы узнать все возможные варианты границ диапазона ячеек можно выполнить команду:
[Enum]::getvalues([Microsoft.Office.Interop.Excel.XlBordersIndex]) |
    Select-Object @{n="Name";e={"$_"}},value__
В результате получим таблицу:
| Name | value__ |
| xlDiagonalDown | 5 |
| xlDiagonalUp | 6 |
| xlEdgeLeft | 7 |
| xlEdgeTop | 8 |
| xlEdgeBottom | 9 |
| xlEdgeRight | 10 |
| xlInsideVertical | 11 |
| xlInsideHorizontal | 12 |
Как видно из таблицы для рамки подходят значения с 7 по 12.
“Рисуем”:
7..12 | ForEach-Object `
{
    $DataRange.Borders.Item($_).LineStyle = 1
    $DataRange.Borders.Item($_).Weight = 2
}
Подгоняем ширину столбцов:
# Подгоняем ширину столбцов
$UsedRange = $DiskInformation.UsedRange
$UsedRange.EntireColumn.AutoFit() | Out-Null
В результате получается вот так:

Результаты работы (отформатированные)
Осталось сохранить полученный результат и выйти из Excel:
# Сохраняем результат и выходим
$WorkBook.SaveAs("C:tempDiskSpace.xlsx")
$Excel.Quit()
Continuing from my previous Excel article, I will now take the report that I created and make more pleasant to the eyes and really show why this is different from just piping the output into Export-CSV to a CSV file.
If you recall, the finished product from my previous article gave you essentially the same type of report that you would find from a typical CSV report generated by Export-CSV. The report was a common report showing the drive spaces of a system.
There will be some re-hashing of code as I am going to perform the same query and the same type of inputting of values in each cell for Excel. The differences are how I format the cells in Excel to give it a nicer look.
#Create excel COM object
$excel = New-Object -ComObject excel.application

#Make Visible
$excel.Visible = $True

#Add a workbook
$workbook = $excel.Workbooks.Add()

#Remove other worksheets
1..2 | ForEach {
    $Workbook.worksheets.item(2).Delete()
}

#Connect to first worksheet to rename and make active
$serverInfoSheet = $workbook.Worksheets.Item(1)
$serverInfoSheet.Name = 'DiskInformation'
$serverInfoSheet.Activate() | Out-Null
Nothing new here as I am connecting to the Excel COM object and then removing all of my workbooks.
Instead of first creating my headers for the data for each drive, I want to add a title to announce what type of report this is.
#Create a Title for the first worksheet and adjust the font
$row = 1
$Column = 1
$serverInfoSheet.Cells.Item($row,$column)= 'Disk Space Information'

Ok, so I can’t really call this a title by any means. We need to format this and give a more “title” look. I will be using the Font property of the cell object to make this look a lot better.
$serverInfoSheet.Cells.Item($row,$column).Font.Size = 18
$serverInfoSheet.Cells.Item($row,$column).Font.Bold=$True
$serverInfoSheet.Cells.Item($row,$column).Font.Name = "Cambria"
$serverInfoSheet.Cells.Item($row,$column).Font.ThemeFont = 1
$serverInfoSheet.Cells.Item($row,$column).Font.ThemeColor = 4
$serverInfoSheet.Cells.Item($row,$column).Font.ColorIndex = 55
$serverInfoSheet.Cells.Item($row,$column).Font.Color = 8210719

Now that is more like it! This gives it a little more pop and better separates itself from the rest of the data in the worksheet. Here I made the font bold, changed the font type to Cambria as well as updating some colors on the font as well. For those paying attention, this is the same as setting the Style to Title, which can also be done by the following code:
$range = $serverInfoSheet.Range("a1","h2")
$range.Style = 'Title'
However, there is just one more thing that I want to do to clean it up a bit.
$range = $serverInfoSheet.Range("a1","g2")
$range.Merge() | Out-Null
$range.VerticalAlignment = -4160

What I’ve done is I selected an extra row as well as selecting as many columns as I know I will be using with my headers and data. Once I have that, I merged everything and then set the verticalalignment to align at the top. So how in the world did I know how to use the correct value for the top alignment when it is not so easily readable (-4160)?
I first ran the following command to figure out the type of Enum that I needed to work with:
$range | Get-Member -Name verticalalignment
TypeName: System.__ComObject#{00020846-0000-0000-c000-000000000046}
Name MemberType Definition
—- ———- ———-
VerticalAlignment Property Variant VerticalAlignment () {get} {set}
Next I went out to the MSDN site for the excel COM object and looked up the enumeration of this type. Unfortunately, I was not able to get the values that relate to the type of alignment. The solution was to work with the Enum using the following code:
[Enum]::getvalues([Microsoft.Office.Interop.Excel.XLVAlign]) |
select @{n="Name";e={"$_"}},value__
VerticalAlignment
|
Name |
value__ |
|
xlVAlignTop |
-4160 |
|
xlVAlignJustify |
-4130 |
|
xlVAlignDistributed |
-4117 |
|
xlVAlignCenter |
-4108 |
|
xlVAlignBottom |
-4107 |
Now I know exactly what value is needed to get the alignment right! This technique will be used a number of times during this article to quickly find out what is the correct value needed to configure a specific property.
Next up we get to add the headers for each data set, but this time with a few additions to really let it stand out as a header.
#Increment row for next set of data
$row++;$row++

#Save the initial row so it can be used later to create a border
$initalRow = $row

#Create a header for Disk Space Report; set each cell to Bold and add a background color
$serverInfoSheet.Cells.Item($row,$column)= 'Computername'
$serverInfoSheet.Cells.Item($row,$column).Interior.ColorIndex =48
$serverInfoSheet.Cells.Item($row,$column).Font.Bold=$True
$Column++
$serverInfoSheet.Cells.Item($row,$column)= 'DeviceID'
$serverInfoSheet.Cells.Item($row,$column).Interior.ColorIndex =48
$serverInfoSheet.Cells.Item($row,$column).Font.Bold=$True
$Column++
$serverInfoSheet.Cells.Item($row,$column)= 'VolumeName'
$serverInfoSheet.Cells.Item($row,$column).Interior.ColorIndex =48
$serverInfoSheet.Cells.Item($row,$column).Font.Bold=$True
$Column++
$serverInfoSheet.Cells.Item($row,$column)= 'TotalSize(GB)'
$serverInfoSheet.Cells.Item($row,$column).Interior.ColorIndex =48
$serverInfoSheet.Cells.Item($row,$column).Font.Bold=$True
$Column++
$serverInfoSheet.Cells.Item($row,$column)= 'UsedSpace(GB)'
$serverInfoSheet.Cells.Item($row,$column).Interior.ColorIndex =48
$serverInfoSheet.Cells.Item($row,$column).Font.Bold=$True
$Column++
$serverInfoSheet.Cells.Item($row,$column)= 'FreeSpace(GB)'
$serverInfoSheet.Cells.Item($row,$column).Interior.ColorIndex =48
$serverInfoSheet.Cells.Item($row,$column).Font.Bold=$True
$Column++
$serverInfoSheet.Cells.Item($row,$column)= 'PercentFree'
$serverInfoSheet.Cells.Item($row,$column).Interior.ColorIndex =48
$serverInfoSheet.Cells.Item($row,$column).Font.Bold=$True

Making the font Bold and adjusting the background color (using the Interior.ColorIndex property of each cell) really helps to make the headers appear more prominent on the worksheet.
Now it is time to add the data into the worksheet!
#Increment Row and reset Column back to first column
$row++
$Column = 1

#Get the drives
$diskDrives = Get-CimInstance -ClassName Cim_LogicalDisk

#Process each disk in the collection and write to spreadsheet
ForEach ($disk in $diskDrives) {
    $serverInfoSheet.Cells.Item($row,$column)= $disk.__Server
    $Column++
    $serverInfoSheet.Cells.Item($row,$column)= $disk.DeviceID
    $Column++
    $serverInfoSheet.Cells.Item($row,$column)= $disk.VolumeName
    $Column++
    $serverInfoSheet.Cells.Item($row,$column)= [math]::Round(($disk.Size /1GB),2)
    $Column++
    $serverInfoSheet.Cells.Item($row,$column)= [math]::Round((($disk.Size - $disk.FreeSpace)/1GB),2)
    $Column++
    $serverInfoSheet.Cells.Item($row,$column)= [math]::Round(($disk.FreeSpace / 1GB),2)
    $Column++
    $serverInfoSheet.Cells.Item($row,$column)= ("{0:P}" -f ($disk.FreeSpace / $disk.Size))

    #Check to see if space is near empty and use appropriate background colors
    $range = $serverInfoSheet.Range(("A{0}"  -f $row),("G{0}"  -f $row))
    $range.Select() | Out-Null

    #Determine if disk needs to be flagged for warning or critical alert
    If ($disk.FreeSpace -lt 65GB -AND ($disk.FreeSpace / $disk.Size) -lt 75) {
        #Critical threshold
        $range.Interior.ColorIndex = 3
    } ElseIf ($disk.FreeSpace -lt 80GB -AND ($disk.FreeSpace / $disk.Size) -lt 80) {
        #Warning threshold
        $range.Interior.ColorIndex = 6
    }

    #Increment to next row and reset Column to 1
    $Column = 1
    $row++
}
I am using PowerShell V3 to get the data with Get-CIMInstance; for V2 you should still use Get-WmiObject.

Some big changes here. Instead of just having plain old text with no color. I decided to track which drives might be having issues with space. Ok, I know that this is not the best representation of running out of space, but as you can see in the code, I can set a threshold based off of free space and percentage free to make a determination if the disk space is Critical or a Warning and highlight the entire row accordingly. I also hard code the range of the row as it will never change to make it easier to highlight the row. This makes it easier now to quickly locate drives that need some attention and resolve the space issue.
We are not done yet! I want to add some borders to this to give it a cleaner look.
$row--
$dataRange = $serverInfoSheet.Range(("A{0}"  -f $initalRow),("G{0}"  -f $row))
7..12 | ForEach {
    $dataRange.Borders.Item($_).LineStyle = 1
    $dataRange.Borders.Item($_).Weight = 2
}

How did I know which Border index to use to make the borders look like this? By using the same trick that I used with the VerticalAlignment property.
[Enum]::getvalues([Microsoft.Office.Interop.Excel.XlBordersIndex]) |
select @{n="Name";e={"$_"}},value__
Border Index
|
Name |
value__ |
|
xlDiagonalDown |
5 |
|
xlDiagonalUp |
6 |
|
xlEdgeLeft |
7 |
|
xlEdgeTop |
8 |
|
xlEdgeBottom |
9 |
|
xlEdgeRight |
10 |
|
xlInsideVertical |
11 |
|
xlInsideHorizontal |
12 |
The same method applies when it comes to deciding what the LineStyle and Weight are for the borders.
[Enum]::getvalues([Microsoft.Office.Interop.Excel.XLLineStyle]) |
select @{n="Name";e={"$_"}},value__
LineStyle
|
Name |
value__ |
|
xlContinuous |
1 |
|
xlDashDot |
4 |
|
xlDashDotDot |
5 |
|
xlSlantDashDot |
13 |
|
xlLineStyleNone |
-4142 |
|
xlDouble |
-4119 |
|
xlDot |
-4118 |
|
xlDash |
-4115 |
[Enum]::getvalues([Microsoft.Office.Interop.Excel.XLBorderWeight]) |
select @{n="Name";e={"$_"}},value__
BorderWeight
|
Name |
value__ |
|
xlHairline |
1 |
|
xlThin |
2 |
|
xlThick |
4 |
|
xlMedium |
-4138 |
The last thing that needs to be done is to auto fit everything so there will be no need for re-sizing of the columns.
#Auto fit everything so it looks better
$usedRange = $serverInfoSheet.UsedRange
$usedRange.EntireColumn.AutoFit() | Out-Null

Much better now! Now we have a nice report that makes it easier to read and identify drives that are in need of attention. Now to save it off and clean up the excel COM object connection and we are set.
Save the file
$workbook.SaveAs("C:tempDiskSpace.xlsx")

#Quit the application
$excel.Quit()

#Release COM Object
[System.Runtime.InteropServices.Marshal]::ReleaseComObject([System.__ComObject]$excel) | Out-Null
Hopefully this helps you out with creating a nice report using Excel and PowerShell. My next article will touch on adding some more features to this report such as a chart and filtering headers.
4 minute read
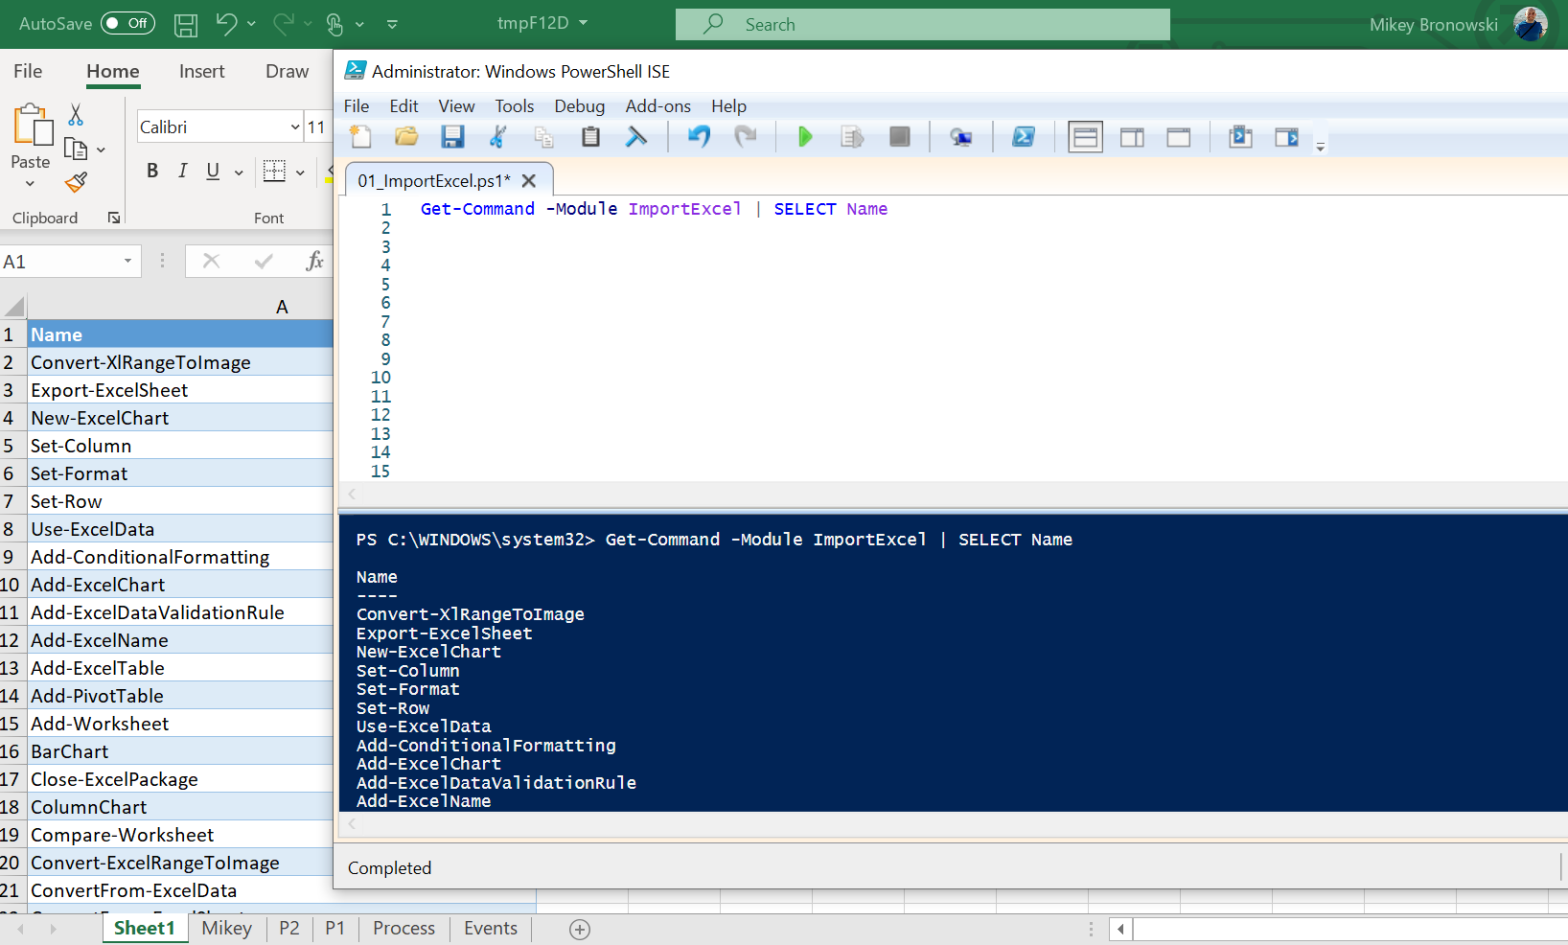
This is part of the How to Excel with PowerShell series. Links to all the tips can be found in this post.
If you would like to learn more about the module with an interactive notebook, check this post out.
Another week and another tip for Excel using Powershell. Today’s post was inspired by one of my readers (thank you Harsha).
Conditional formatting is important, however by default we change the look of the cells that have specific values. What about changing the entire row if a specific cell meets certain conditions?
Preparation
Let’s prepare our environment first.
# set location for the files - I am using the temporary folder in my user profile
Set-Location $env:TEMP

# that is the location of our files
Invoke-Item $env:TEMP

# cleanup any previous files - this helps in case the example has been already ran
$excelFiles = "ImportExcelHowTo002.xlsx"
Remove-Item $excelFiles -ErrorAction SilentlyContinue
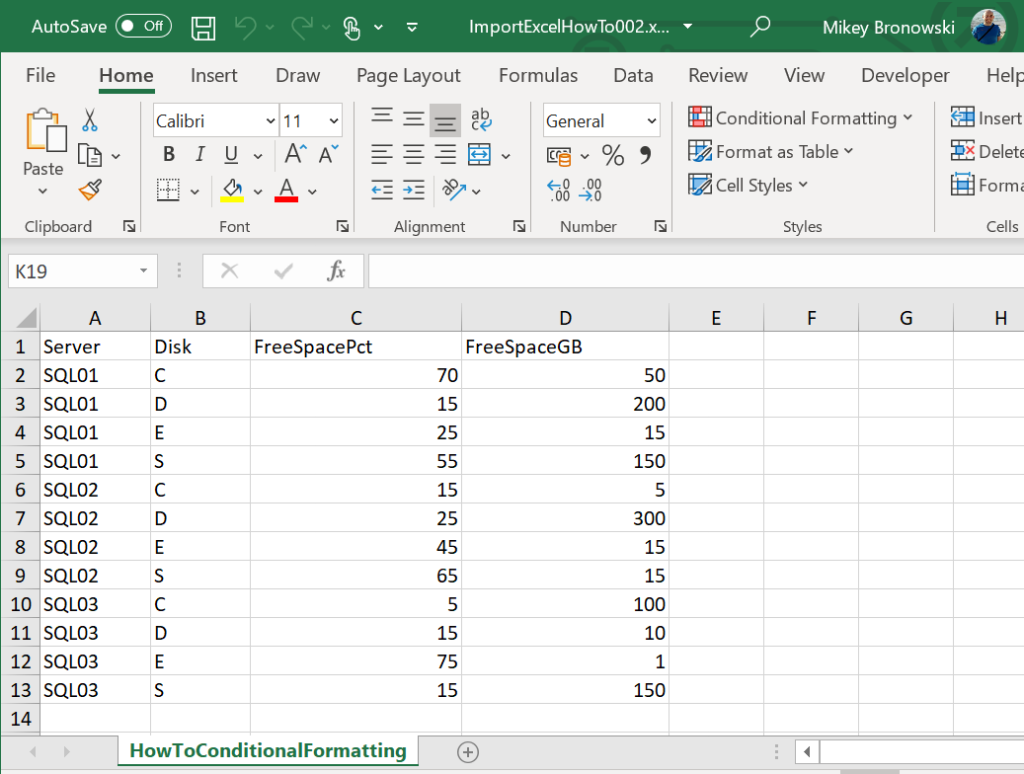
We are going to use this sample data set
# get some data
$data = ConvertFrom-Csv @'
Server,Disk,FreeSpacePct,FreeSpaceGB
SQL01,C,70,50
SQL01,D,15,200
SQL01,E,25,15
SQL01,S,55,150
SQL02,C,15,5
SQL02,D,25,300
SQL02,E,45,15
SQL02,S,65,15
SQL03,C,5,100
SQL03,D,15,10
SQL03,E,75,1
SQL03,S,15,150
'@

# pipe the data into the blank Excel file
$data | Export-Excel -Path $excelFiles -WorksheetName HowToConditionalFormatting -KillExcel -Show
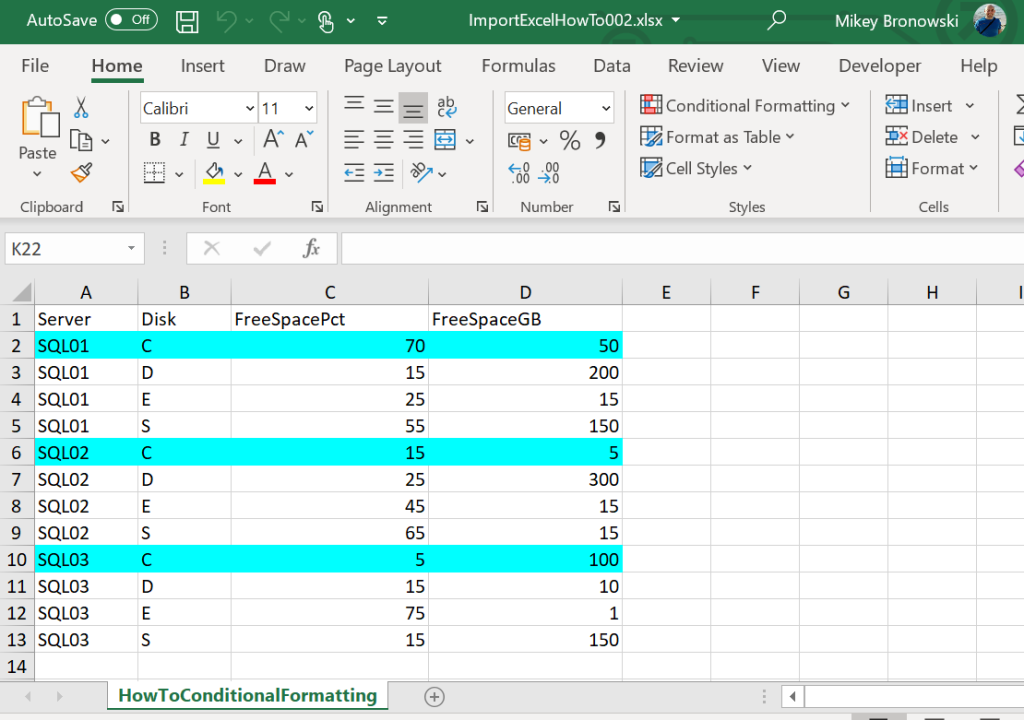
Format entire row based on the single-cell value
Our goal is to highlight the entire row for the C drives, so in this case rows 2, 6 and 10. To add the formatting to an existing file I am going to use a combination of Open-ExcelPackage/Add-ConditionalFormatting/Close-ExcelPackage.
For the ConditionalFormatting we want the RuleType = Expression and ConditionValue would contain our formula. Note that I am using $ sign to lock the column, so only the B column will be checked for the matching condition.
# open Excel file with PowerShell
$excelPackage = Open-ExcelPackage -Path $excelFiles -KillExcel

# get the worksheet
$excel = $excelPackage.Workbook.Worksheets['HowToConditionalFormatting']

# apply formatting to the range and put a formula in the RuleType parameter
Add-ConditionalFormatting -Worksheet $excel -Address A2:D12 -RuleType Expression -ConditionValue '=$B2="C"' -BackgroundColor Cyan

# save the changes and open the spreadsheet
Close-ExcelPackage -ExcelPackage $excelPackage -Show
And that is what we wanted to achieve:
That is neat, and we want more! What about multiple conditions?! Good question, but first…
Clean up the conditional formatting
While I was testing different things my Excel file was a collection of similar rules in the conditional formatting area. We can delete them one by one from the Excel, but there is a way to do it with PowerShell as well.
Follow the same process, open the package, do the change, close the package. In our case, I do not think there is a built-in
# open Excel file with PowerShell
$excelPackage = Open-ExcelPackage -Path $excelFiles -KillExcel

# get the worksheet
$excel = $excelPackage.Workbook.Worksheets['HowToConditionalFormatting']

# remove the conditional formatting from the whole worksheet
$excel.ConditionalFormatting.RemoveAll()

# save the changes and open the spreadsheet
Close-ExcelPackage -ExcelPackage $excelPackage -Show
That will do. The formatting is gone, so we can move on to the next step.
Format entire row based on the multiple cells values
So the goal here would be here to highlight the rows where FreeSpacePct (percentage) is less than 20 and at the same time FreeSpaceGB (gigabytes) is less than 50, so rows 6 and 11.
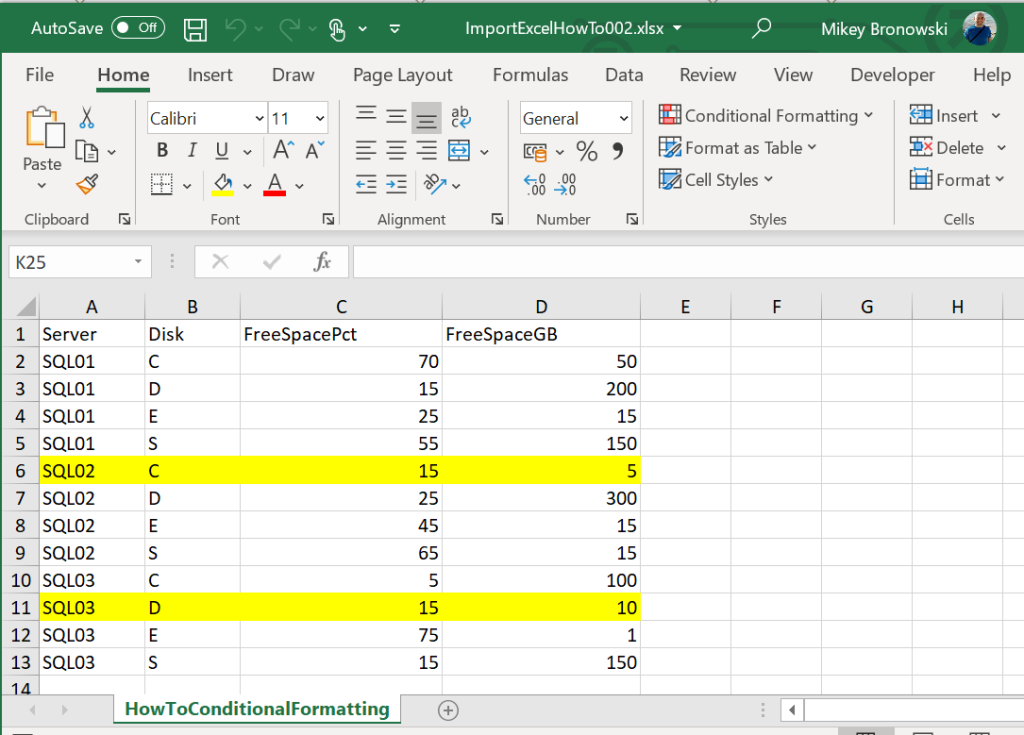
That’s great, but how to handle multiple
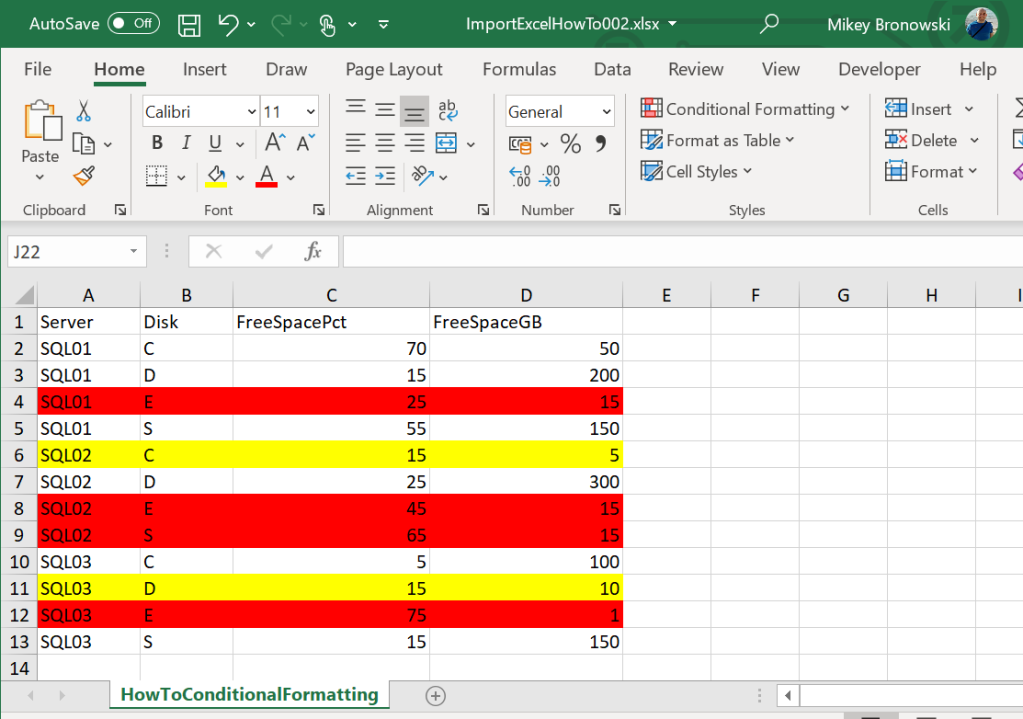
Let’s add another condition to mark all the disks with FreeSpaceGB less than 20. Make them in RED.
# open Excel file with PowerShell
$excelPackage = Open-ExcelPackage -Path $excelFiles -KillExcel

# get the worksheet
$excel = $excelPackage.Workbook.Worksheets['HowToConditionalFormatting']

# apply formatting to the range and put a formula in the RuleType parameter
Add-ConditionalFormatting -Worksheet $excel -Address A2:D12 -RuleType Expression -ConditionValue '=$D2<=20' -BackgroundColor Red

# save the changes and open the spreadsheet
Close-ExcelPackage -ExcelPackage $excelPackage -Show
Rules priority
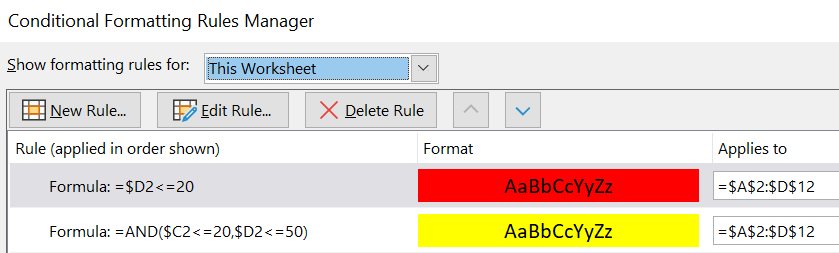
One thing to note is that every time you add the rule it gets lower priority then the existing rules, so if we switch the order of the rules added in this post the output will be different. Here is the code: cleaned up the formatting, added the RED then YELLOW (so in the reverse order):
# open Excel file with PowerShell
$excelPackage = Open-ExcelPackage -Path $excelFiles -KillExcel

# get the worksheet
$excel = $excelPackage.Workbook.Worksheets['HowToConditionalFormatting']

# remove the entire formatting
$excel.ConditionalFormatting.RemoveAll()

# apply formatting to the range and put a formula in the RuleType parameter
Add-ConditionalFormatting -Worksheet $excel -Address A2:D12 -RuleType Expression -ConditionValue '=$D2<=20' -BackgroundColor Red
Add-ConditionalFormatting -Worksheet $excel -Address A2:D12 -RuleType Expression -ConditionValue '=AND($C2<=20,$D2<=50)' -BackgroundColor Yellow

# save the changes and open the spreadsheet
Close-ExcelPackage -ExcelPackage $excelPackage -Show
and the output does not contain any YELLOWS, because all of them were marked RED first:
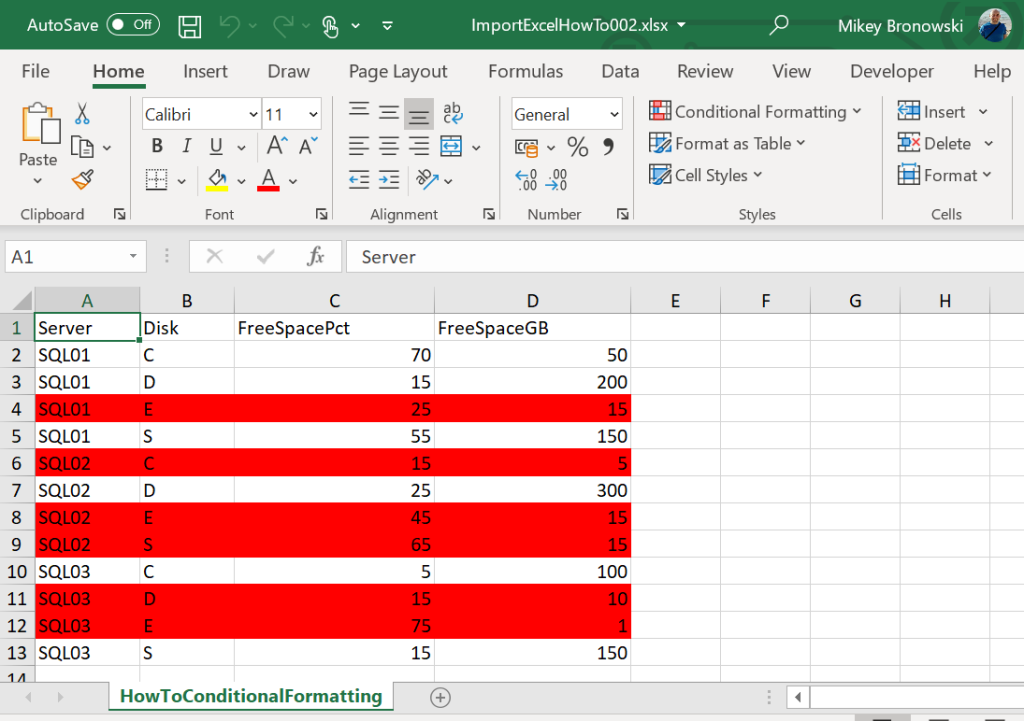
The reason is the priorities. The below image comes from YELLOW/RED example and the second one from the reverse RED/YELLOW:
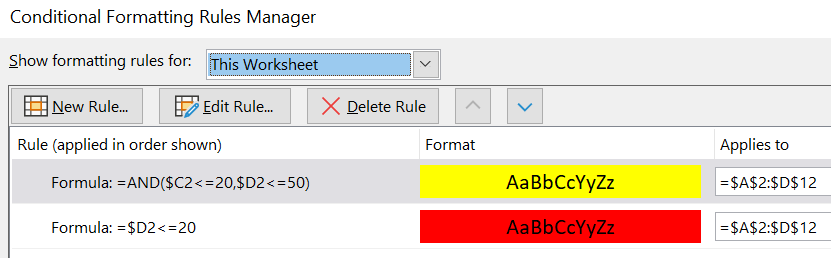
We could try to change the priority of the rules as well. Try playing with the ConditionalFormatting like the example below.
# open Excel file with PowerShell
$excelPackage = Open-ExcelPackage -Path $excelFiles -KillExcel

# get the worksheet
$excel = $excelPackage.Workbook.Worksheets['HowToConditionalFormatting']

# change the priority of the first rule (Priority = 1)
$excel.ConditionalFormatting[0].Priority = 2

# save the changes and open the spreadsheet
Close-ExcelPackage -ExcelPackage $excelPackage -Show
Summary
Today I have showed you how to do the conditional formatting for the entire row based on a single or multiple cells values. We have learned how to clear up the whole conditional formatting as well as how to manage the priorities.
Thank you,
Mikey
- Remove From My Forums
-
Вопрос
-
Hello,
I have a powershell script that I created that pulls data from some servers I manage and displays the info into a .csv file. I now need to take that .csv file and format the cells so that they autofit the data and add a chart. Here is my current
script. Where do I begin to have powershell format these cells and create a chart from the data it displays?$servname = Get-Content c:FSserv.txt
Get-WmiObject win32_logicalDisk -ComputerName $servname | Where-Object {$_.VolumeName -like «JH*R*»} | select-object `
DeviceID,VolumeName, `
@{label=»Size»;Expression={«{0:n2}» -f ($_.Size/1GB)}},
@{label=»FreeSpace»;Expression={«{0:n2}» -f ($_.FreeSpace/1GB)}},
@{label=»%Free»;Expression={«{0:p2}» -f ($_.FreeSpace/$_.Size)}} | Export-CSV c:jhFSfreespace.csv -NoTypeInformation
Ответы
-
-
Помечено в качестве ответа
27 марта 2012 г. 15:31
-
Помечено в качестве ответа
Applies to PowerShell, Excel, Reporting
Modules needed: ImportExcel
Very frequently, I use PowerShell to extract data. Generating a list of users with expiring passwords, checking O365 licenses, finding stale Active Directory objects- you name it. Sometimes finding this information is easiest using PowerShell. But, if you need to give this data to your boss, or send it out to a manager, you need to extract it somehow. Export it to CSV? Gross!
Doug Finke has created a beautiful PowerShell module that has made the creation of Excel documents with PowerShell possible. (Without COM objects!) ImportExcel is my new favorite module- and I made it a little bit simpler to use for my needs.
I’ve set this script up as a function, because I want to be able to take what I’m currently working on, and quickly turn it into an Excel document. Here’s the code:
function xl {
  Write-Host
  Write-Host
  $getpath = Read-Host "File Name"
  $path = "c:temp" + $getpath + ".xlsx"
  [int]$sheetcount = Read-Host "Number of sheets"
  [int]$count = 0
  while ($count -lt $sheetcount) {
    Write-Host
    $sheetname = Read-Host "Sheet name"
    $command = Read-Host "Command"
    Write-Host
    Write-Host "Include Pivot Table?"
    Write-Host
    Write-Host "1) Yes"
    Write-Host "2) No"
    Write-Host
    $selection = Read-Host "Select"
    switch ($selection) {
      '1' { Write-Host "Working on it..." -ForegroundColor Yellow
        $ex = Invoke-Expression $command | Export-Excel -Path $path -AutoSize -FreezeTopRow -TableName $sheetname.Replace(' ','') -TableStyle Medium2 -WorkSheetname $sheetname -IncludePivotTable }
      '2' { Write-Host "Working on it..." -ForegroundColor Yellow
        $ex = Invoke-Expression $command | Export-Excel -Path $path -AutoSize -FreezeTopRow -TableName $sheetname.Replace(' ','') -TableStyle Medium2 -WorkSheetname $sheetname }
    }
    Write-Host
    Write-Host "Sheet Completed." -ForegroundColor Green
    $count = $count + 1 }

  Write-Host "Exporting to Excel..." -ForegroundColor Yellow
  Invoke-Item $path
}
What it does:
Ideally, you would have entered your ps commands before running this script, so you know what your output is going to be.
The script asks for a filename, which it stores in C:Temp, and adds the .xlsx extension.
It asks for the number of sheets- the use for which is entering multiple commands. I’ll get into that in a moment.
The sheet name is, as it says, the sheet name at the bottom tab of the Excel document.
It then asks for a command. This is where you enter your PowerShell command that you want exported on that sheet. The reason you would enter multiple sheets, is so you can have multiple command outputs in the same document. For example, if your first command is get-host, and your second command is get-service- the document will separate the outputs of these commands into sheets.
This can be extremely helpful if gathering info from multiple sources, say for example:
Sheet 1:
invoke-command -ComputerName PC1 -ScriptBlock {get-service}
Sheet 2:
invoke-command -ComputerName PC2 -ScriptBlock {get-service}
This leaves you with all the information you need in one workbook, but separated by tabs, for organization.
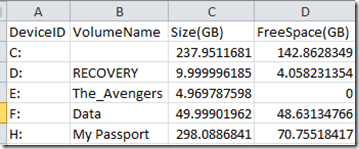
Something that I found out about this script only after writing it, was that it actually functions fantastically as a csv converter as well! Say you’ve got a lovely spreadsheet that looks like this:

With a quick command, you can turn this eye-sore into a readable, usable spreadsheet.
This file is located in c:tempservices.csv
PS C:> xl

File Name: Services Formatted
Number of sheets: 1

Sheet name: Services
Command: import-csv c:tempservices.csv

Include Pivot Table?

1) Yes
2) No

Select: 2
Working on it...

Sheet Completed.
Exporting to Excel...

Boom- looks great, and definitely saves some time formatting. Of course, the commands I’ve used here are pretty useless in this format, but the concept of being able to run complex PowerShell commands side-by-side on multiple sheets in one workbook was a cool idea to me, and can potentially be very powerful.