Microsoft Excel Features
Almost all the professionals use this spreadsheet tool. MS Excel is the universal language that speaks in practically all the offices. However, as a starter or intermediate-level user, you need to know some of the important features of MS Excel. This article will show you the features of MS Excel.
Table of contents
- Microsoft Excel Features
- Top 9 Main Features of Microsoft Excel with Examples
- #1 – You Can Insert a New Worksheets at Will
- #2 – Time Saving Shortcut Keys
- #3 – Get Quick Sum of Numbers
- #4 – Filtering Data
- #5 – Paste Special Feature
- #6 – Insert Random Numbers
- #7 – Insert Random Fraction Numbers
- #8 – Goal Seek Analysis Tool
- #9 – Insert Serial Numbers
- Things to Remember about Features of MS Excel
- Recommended Articles
- Top 9 Main Features of Microsoft Excel with Examples
Top 9 Main Features of Microsoft Excel with Examples
Now, we shall discuss the 9 different features of Microsoft Excel with examples which are as follows:
You can download this Features of MS Excel Template here – Features of MS Excel Template
#1 – You Can Insert a New Worksheets at Will
You might have seen one to three default worksheets while opening the new workbook (the number of worksheets may vary depending on the settings).
You can insert a new worksheet in excelTo add a new worksheet, go to the bottom of the screen and press the ‘+’ button. You can also navigate to ‘Home’, ‘Insert,’ and then ‘Insert Sheet’ to add a new sheet.read more and delete the same at any time. First, press the “+” icon key to insert any new worksheet available at the bottom.
![]()
Now, click on this button to insert a new worksheet.
We can also insert a new worksheet by pressing the shortcut key “Shift + F11.“
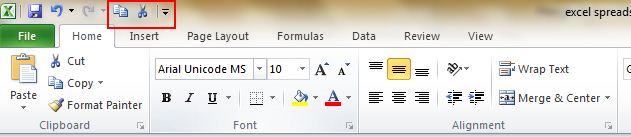
#2 – Time Saving Shortcut Keys
The time on Excel can be reduced drastically by masterful Excel shortcut keys. Apart from universal “Ctrl + C, Ctrl + X, and Ctrl + V,” we can use many other abundant shortcut keys in excelAn Excel shortcut is a technique of performing a manual task in a quicker way.read more.
Shortcut key for Copy:
![]()
Shortcut key for Cut:
![]()
Shortcut key for Paste:
![]()
You can refer to our article on “Excel Shortcut Keys” to learn some of the important shortcut keys.
#3 – Get Quick Sum of Numbers
If we have serial numbers or any numerical data, we can quickly get the sum of these numbers with simple shortcut keys.
Assume we have numbers in 10 cells, and imagine how long it will take us to get the total of these numbers.
I can say less than a second!!!!
Yes, you hear it right less than a second.
Select the cell where we need to get the total of these numbers and press the shortcut key “ALT + =” to get the AutoSum.
![]()
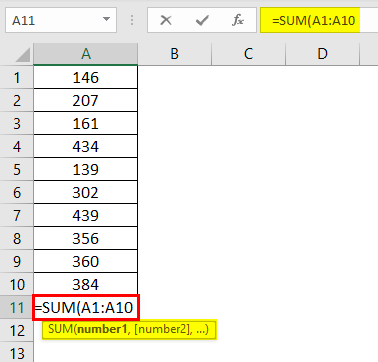
We get the following result.

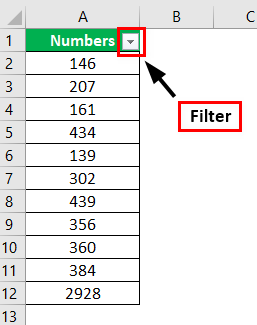
#4 – Filtering Data
Filtering the excel dataThe filter in excel helps display relevant data by eliminating the irrelevant entries temporarily from the view. The data is filtered as per the given criteria. The purpose of filtering is to focus on the crucial areas of a dataset. For example, the city-wise sales data of an organization can be filtered by the location. Hence, the user can view the sales of selected cities at a given time.
read more is one of the important features of Microsoft Excel. We can filter any data available under the “Filter” section.
We can use more advanced techniques to filter the data. For example, to insert a short filter, we can press the shortcut key “Ctrl + Shift + L” or “Alt + D + F + F.”
Shortcut key to Insert the Filter:
![]()
or
![]()
For example,
#5 – Paste Special Feature
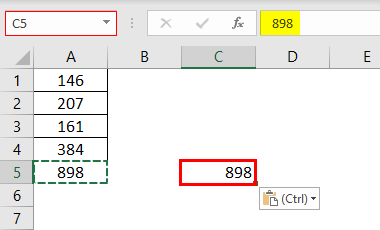
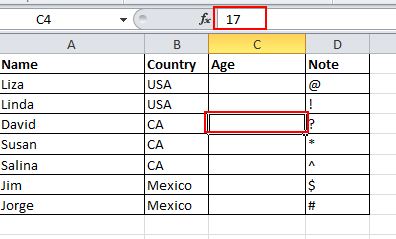
We love paste specialPaste special in Excel allows you to paste partial aspects of the data copied. There are several ways to paste special in Excel, including right-clicking on the target cell and selecting paste special, or using a shortcut such as CTRL+ALT+V or ALT+E+S.read more because it gives us more edge to increase workplace productivity. For example, look at the below data.
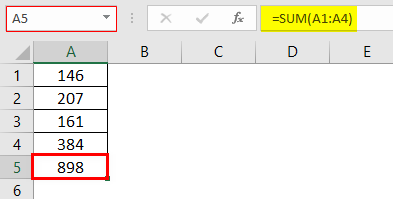
In the A5 cell, we have a formula that takes the range of cells from A1 to 4. So, the A5 cell is dependent on the above cells. So, if we copy and paste this cell to other cells, we may get this formula only, not value.
So, we can use the Paste Special technique to paste as only values. Therefore, we must copy cell A5 and place a cursor on the cell where we need to paste.
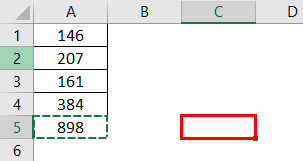
I have copied the cell A5 and placed the cursor on the C5 cell.
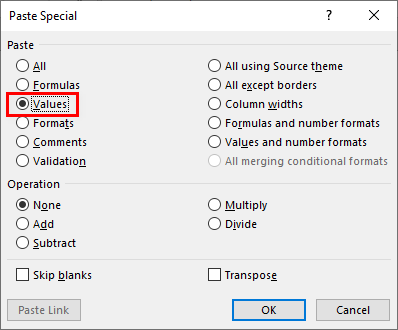
Now, press the “ALT + E + S” shortcut key and open the “Special” dialog box.
![]()
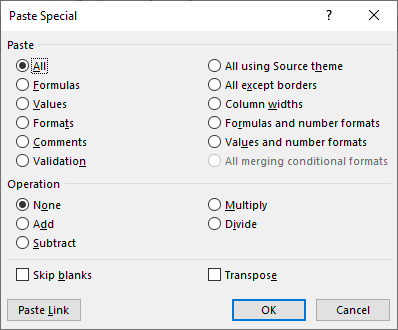
We have plenty of options under “Paste Special” features. However, we want to paste only the value in this example, so we must select the “Values” option to paste as the only value.
So this will paste only the value from A5 cell to C5 cell.
Like this, under “Paste Special,” we can use other available techniques like “Formulas,” “Formats,” etc.
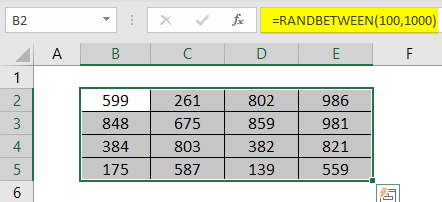
#6 – Insert Random Numbers
Excel has plenty of formulas and functions in its arsenal. For example, if we want to insert random numbers with an Excel worksheet, we can use a built-in function called“RANDBETWEENRANDBETWEEN excel formula determine random numbers between two extreme variables (bottom and top numbers). The user needs to fill in the bottom and top numbers in the syntax =RANDBETWEEN (bottom, top) to acquire the random integer.read more.”
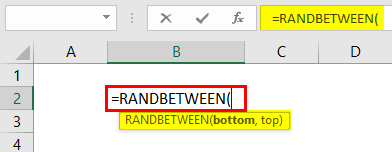
For the first argument, supply the least number that you want to insert.
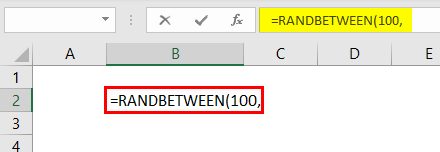
For the last argument, we must enter the highest number that we want to insert.
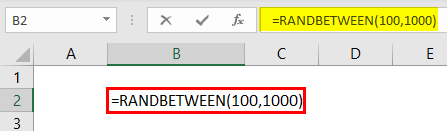
So, now, the RANDBETWEEN function inserts numbers from 100 to 1,000.
#7 – Insert Random Fraction Numbers
As seen above, we can insert random numbers. Now, we will see how we can insert random fraction numbers.
We must use the RAND functionThe RAND function in Excel, also known as the random function, generates a random value greater than 0 but less than 1, with an even distribution among those numbers when used on multiple cells. read more to insert random fraction numbers greater than 0 and less than 1.
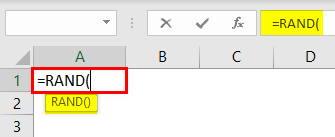
The RAND function does not have any parameters, so we must close the bracket and insert the function.

Note:
Both RAND and RANDBETWEEN are volatile functions and keeps varying whenever we make any changes in the workbook.
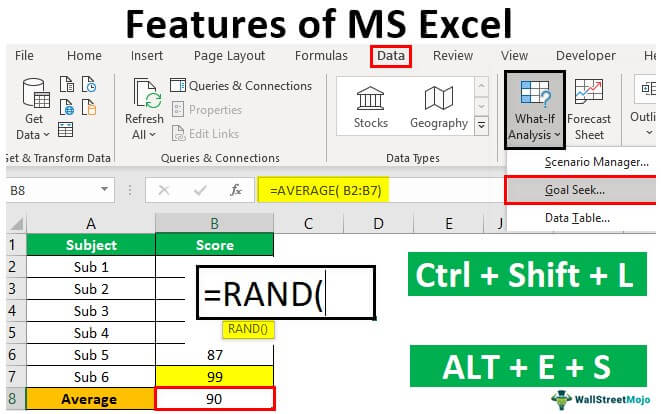
#8 – Goal Seek Analysis Tool
The Goal Seek analysisThe Goal Seek in excel is a “what-if-analysis” tool that calculates the value of the input cell (variable) with respect to the desired outcome. In other words, the tool helps answer the question, “what should be the value of the input in order to attain the given output?”
read more tool is extremely useful for determining what needs to be done to achieve the desired goal. For example, Mr. A wants to get an overall average score of 90 in 6 subjects. However, Mr. A has already attended five exams. Below are his anticipated scores.
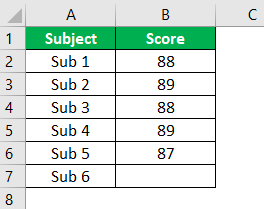
Now, Mr. A is left with only one examination. He wants to know how much he must score in the final examination to get an overall average of 90.
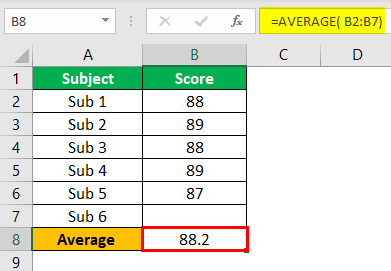
So, first, we must apply the AVERAGE function for the first five exams.
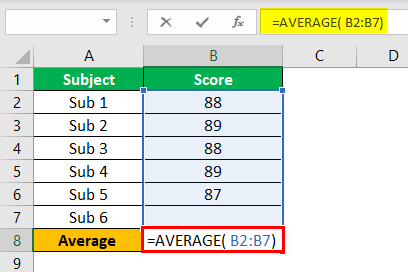
We get the following result.
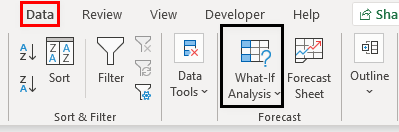
Now go to the DATA tab and click on the What-If AnalysisWhat-If Analysis in Excel is a tool for creating various models, scenarios, and data tables. It enables one to examine how a change in values influences the outcomes in the sheet. The three components of What-If analysis are Scenario Manager, Goal Seek in Excel, and Data Table in Excel.read more tool to open the “Goal Seek” tool.
In the Goal Seek window, we can see three options.
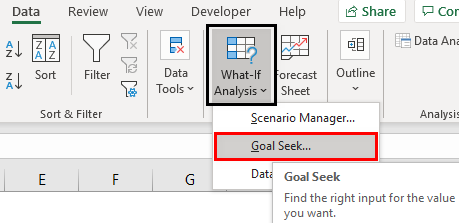
We must select “Goal Seek.” Then, we may get the following options: “Set cell,” “To value,” and “By changing cell.”

The average function applies to the cell for the “Set cell,” the B8 cell.
In the “To value,” the cell enters the value as 90.
The “Changing cell” gives the cell reference to the B7 cell.

Now, we must click on “OK.” As a result, the “Goal Seek” analysis tool will help Mr. A to know how much he needs to score in the final examination to get the overall average of 90.

Mr. A has to score 99 on his final examination to get an overall average of 90.
#9 – Insert Serial Numbers
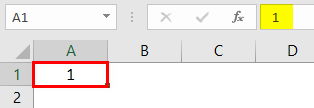
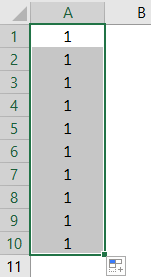
If we want to insert serial numbers incremented by 1, we can do this by the “Fill Series” option. Then, enter the value 1 in any of the cells.
Using the Excel FILL HandleThe fill handle in Excel allows you to avoid copying and pasting each value into cells and instead use patterns to fill out the information. This tiny cross is a versatile tool in the Excel suite that can be used for data entry, data transformation, and many other applications.read more function, we must drag until the cell where we want to insert serial numbers
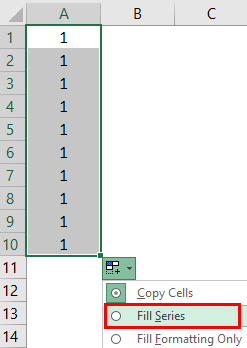
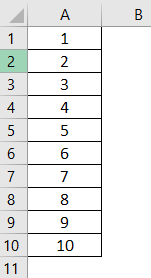
Now, click on the “AutoFill” option and choose “Fill Series” to get the serial numbers incremented by 1.
We get the following result.
Things to Remember about Features of MS Excel
- These are some of the basic and cool features of Excel.
- We have so many uses that other features will also cover incoming topics.
- We must use the shortcut keys to use an excellent spreadsheet tool skillfully.
- We must first learn the basic formulas to get started with functions.
Recommended Articles
This article is a guide to the features of MS Excel. Here, we discuss the top 9 features of Microsoft Excel, including “Time Saving Shortcut Keys,” “Get Quick Sum of Numbers,” “Filtering Data,” “Paste Special” feature, etc., along with examples and a downloadable Excel template. You may learn more about Excel from the following articles: –
- Bullet Chart in Excel
- Formula in Excel Not Working
- SUM Shortcut in Excel
- “Save As” Excel Shortcut
![]()
What is Excel?

Microsoft Excel is a spreadsheet program available in the Microsoft Office Package. MS Excel is used to create Worksheets (spreadsheets) to store and organize data in a table format.
Microsoft Excel is one of the most used software application in the world. Excel have the Powerful Tools and Functions, using it for wide verity of applications across the global IT Companies. It is easy to enter the data, read and manipulate the data. Excel stores the data in a table format in Rows and Columns.
Here is a screen-shot of a Microsoft Excel File:
- What is Excel in Computer?
- What is Excel Used for?
- Where Excel is Used?
- Features of MS Excel:
- Key Components:
- Usage
- Industries
- Interface
- Data Analysis
- Data Visualization
- Templates
- Enhancing Excel Features
- Programming Language
- Macros
- Add-ins
- Integration with Other Office Applications:
- Security Features
- Resource and Support Communities:
- Limitations
- Data security and privacy
- Data accuracy and integrity
- Alternative Applications
- Conclusion
- Excel Objects and Definitions
- What is Excel Ribbon?
- What is Excel Workbook?
- What is Excel Worksheet?
- What is Excel Range?
- What is Excel Cell?
- What is Excel Row?
- What is Excel Column?
- What are Excel Macros?
- What is Excel VLookUp?
What is Excel in Computer?
In computer terms, Excel is a spreadsheet application in Microsoft Office Pack. It is one of the most using Applications in business industries. We can store any kind of the data in the spreadsheets in the Excel Range or Excel Cells. We can also insert Images, Shapes, Charts, Pivot Tables in the Excel Sheets to understand the data.
What is Excel Used for?
Microsoft Excel used for storing the data, processing the data, analyzing and presenting the data.
- We can enter data in Strings, Dates or Numerical type of Data in the Excel Cells and Save the Files for future reference
- We can use verity of formulas available in Excel to perform calculations
- We can Develop Tools and Dashboards
- We can Interact with Other Applications
- We can connect to verity of Data Bases
- We can represent data in Charts
- We can drill down and analyze the data using Pivot Tables
Read More Uses
Where Excel is Used?
Microsoft Excel used in almost all industries. Here are the some of the real-time Excel Using industries and domains:
- Financial sector is excessively using to perform different kind of calculations.
- Analytical professional use Excel almost everyday for applying the basic analytical techniques and tools.
- Banking Sector use to understand the Customer
- Retail Associates uses for analyzing the POS data to check the change and trend in sales
- Reporting Analysts uses for generating Daily, Weekly, Monthly, Quarterly and Yearly Reports.
- Healthcare Teams uses for performing the longitudinal data analysis.
- Market Research Analysts uses for finding the frequencies and cumulative aggregates.
- VBA Developers uses for developing the Office Applications, Tools, Office Add-ins and Dashboards.
Features of MS Excel:
The following features of Excel made the Excel as most widely using application:
-
Graphical Features of Excel
Excel have verity of the graphical features to represent the data in Charts and pictorial format. For Example, Charts, Shapes, Smart Arts, Clip Arts, Pictures.
-
Data Base Features of Excel
Excel can be used as data base and perform of verity of data operations. For example, Pivot Tables, Slicers, Tables, Spark lines, Database, Sorting, Filtering, Data Validation, Grouping, etc.
-
Functional Features of Excel
Excel Tools and Functions will help to perform powerful calculations and enhance the Excel Application Features. For example, Formulas, VBA Macros, Add-ins, Hyperlinks, Conditional Formatting, Spell Check, Protection, etc.
Key Components:
Excel is a spreadsheet software developed by Microsoft that is used to perform calculations, data analysis, and data visualization. Some of the key components of Excel include:
- Workbook: A workbook is the main file that contains one or more worksheets where you can enter data, perform calculations, and create charts and graphs.
- Worksheet: A worksheet is a single spreadsheet within a workbook that consists of rows, columns, and cells.
- Cell: A cell is a rectangular box in a worksheet where you can enter data, formulas, and functions.
- Range: A group of adjacent cells, which can be selected and formatted together.
- Chart: A chart is a visual representation of data in a worksheet that can help you to identify patterns and trends.
- PivotTable: A PivotTable is a powerful tool that allows you to summarize and analyze large amounts of data quickly and easily.
- Sparklines: Sparklines are small, simple charts that are used to show trends in data over time.
- Ribbon: The Ribbon is a graphical user interface that contains all the tools and commands you need to work with Excel. It is organized into tabs, which are further divided into groups of related commands.
- Quick Access Toolbar: The Quick Access Toolbar is a customizable toolbar that provides quick access to frequently used commands.
- Name box: The box located to the left of the formula bar, which displays the reference of the selected cell or range.
- Solver: Solver is an add-in tool that allows you to find the optimal solution to a problem by changing the values of certain variables.
- Goal Seek: Goal Seek is a tool that allows you to determine the value of a variable that will achieve a certain goal in a formula.
- Scenario Manager: Scenario Manager is a tool that allows you to create and compare different scenarios for a worksheet by changing the input values of certain variables.
- Power Query: Power Query is a tool that allows you to transform and analyze large amounts of data from various sources, such as databases, spreadsheets, and web pages.
- Power Pivot: Power Pivot is an add-in tool that allows you to create advanced data models and perform complex data analysis using large amounts of data.
- Data Tables: Data Tables are tools that allow you to calculate multiple results based on different sets of input values for one or more formulas.
- Web Queries: Web Queries are tools that allow you to import data from a website directly into Excel, making it easier to collect and analyze data from the internet.
- Get & Transform: Get & Transform is a feature that allows you to connect to various data sources, transform and reshape data, and load it into Excel for analysis and reporting.
- Freeze Panes: Freeze Panes is a feature that allows you to keep certain rows or columns visible as you scroll through a worksheet, making it easier to view and analyze large amounts of data.
- Collaboration Tools: Excel also provides various collaboration tools that allow multiple users to work on the same worksheet simultaneously, such as shared workbooks and co-authoring.
- Protect Workbook/Worksheet: Protect Workbook/Worksheet is a feature that allows you to restrict access to certain parts of a workbook or worksheet by setting password protection, so that only authorized users can view or edit the data.
- Error Checking: Error Checking is a feature that allows you to identify and correct errors in your formulas and functions, which can help to ensure data accuracy.
- Templates: Excel Templates are pre-designed spreadsheets that you can use to quickly create different types of documents, such as budgets, calendars, and invoices.
- Macro: A macro is a set of instructions that automate repetitive tasks in Excel.
- Office Add-ins: Office Add-ins are third-party tools that you can install in Excel to extend its functionality, such as data connectors, visualization tools, and productivity apps.
- Merge cells: A tool that allows you to combine multiple cells into a single, larger cell.
- Autofill: A tool that allows you to quickly fill a series of cells with a pattern or sequence of data.
- Data Validation: Data Validation is a feature that allows you to restrict the type of data that can be entered into a cell. This can help to ensure data accuracy and consistency.
- Custom Number Formats: Custom Number Formats are tools that allow you to create your own number formats, making it easier to display numbers in a way that is more meaningful for your data.
- Text to Columns: Text to Columns is a feature that allows you to split data in a column into multiple columns based on a delimiter, such as a comma or space.
- Flash Fill: Flash Fill is a tool that allows you to automatically fill in data based on a pattern that you specify, making it easier to clean and transform data.
- Print Options: Excel also provides various print options that allow you to customize the layout and formatting of your worksheet before printing, such as page orientation, margins, and scaling.
- Page Layout View: Page Layout View is a feature that allows you to view your worksheet as it will appear when printed, making it easier to adjust the layout and formatting.
- Filter: A tool that allows you to display only specific data in a worksheet, based on certain criteria.
- Sort: A tool that allows you to arrange data in a worksheet in ascending or descending order, based on certain criteria.
- Function: A function is a built-in formula that performs a specific calculation or task, such as SUM, AVERAGE, MAX, and MIN.
- Formula: A formula is an equation that performs a calculation in a cell based on the values in other cells.
- Formula bar: The area at the top of the Excel window where you can view and edit the contents of a selected cell.
- Cell reference: A way to identify a cell in a worksheet, which is a combination of the column letter and row number, such as A1, B2, etc.
- Relative reference: A cell reference that changes when you copy or move a formula to a different location in a worksheet.
- Absolute reference: A cell reference that remains constant when you copy or move a formula to a different location in a worksheet, which is denoted by a dollar sign ($).
- Mixed reference: A cell reference that has both absolute and relative components, which is denoted by a dollar sign ($) before the column or row reference.
- Dynamic Arrays: Dynamic Arrays are a new feature in Excel that allow you to create formulas that automatically expand or shrink to fit the size of the data, making it easier to perform calculations on large datasets.
- Formula auditing: A tool that allows you to trace the relationships between cells and formulas in a worksheet, which can help you identify errors and troubleshoot problems.
Usage
Excel is a widely used spreadsheet program developed by Microsoft. It is part of the Microsoft Office suite of applications and is used to organize, analyse, and manipulate data. Excel allows users to create, format, and manipulate tables of numerical and textual data in rows and columns.
Users can perform various mathematical and statistical calculations on the data, create charts and graphs to visualize the data, and use formulas and functions to automate calculations and analysis. Excel also provides various tools and features for data analysis, such as sorting, filtering, and pivot tables, that allow users to extract insights quickly and easily from large data sets.
Industries
Excel can be used in a variety of industries and professions, including finance, accounting, marketing, and research. It is often used for budgeting, financial forecasting, tracking expenses, inventory management, and analyzing sales data.
Interface
Excel has a user-friendly interface and is widely available on Windows and Mac OS systems. Additionally, Excel supports collaboration features, such as sharing workbooks and co-authoring, which allow multiple users to work on the same spreadsheet simultaneously.
Data Analysis
Another important feature of Excel is its ability to handle large amounts of data. Excel can handle millions of rows of data and thousands of columns, making it ideal for working with large datasets. Additionally, Excel provides several features for managing large datasets, such as sorting, filtering, and searching.
Excel also allows users to collaborate on workbooks in real-time using cloud-based solutions like OneDrive or SharePoint. This feature makes it easy for teams to work on the same document simultaneously and ensures that everyone is working with the most up-to-date version of the data.
Data Visualization
Excel also provides various tools for data visualization, which make it easy to create charts, graphs, and other visualizations that help to communicate data insights. With features like sparklines and conditional formatting, users can quickly identify trends and patterns in data without the need for complex analysis.
Overall, Excel is an essential tool for anyone who works with data. Its extensive feature set, customizability, and ease of use make it an ideal choice for businesses, researchers, educators, and individuals. Whether you are working with small datasets or large, Excel can help you manage and analyze your data efficiently, saving you time and improving your productivity.
Templates
Excel also provides various templates that help users get started with common tasks, such as budgeting, invoicing, and project management. These templates can be customized to meet specific needs, making it easy for users to create professional-looking spreadsheets without starting from scratch.
Enhancing Excel Features
Another way to overcome some of the limitations of Excel is to use Excel add-ins or plugins that provide additional features and capabilities. There are many add-ins available that can help users automate tasks, perform advanced analysis, and enhance visualization.
- For example, the Analysis ToolPak add-in provides a wide range of statistical and engineering functions, while the Power Query add-in allows users to extract and transform data from a variety of sources. The Solver add-in can help users find optimal solutions for complex problems, while the Power Pivot add-in provides advanced data modeling and analysis capabilities.
- In addition to add-ins, users can also consider using Excel templates or pre-built solutions that provide pre-configured spreadsheets and models for specific use cases. There are many templates available for financial modeling, budgeting, project management, and other applications. These templates can help users save time and avoid errors by providing pre-built formulas and templates for common tasks.
Finally, to improve collaboration and data sharing, users can consider using cloud-based collaboration platforms such as Microsoft Teams or SharePoint. These platforms allow users to share and collaborate on Excel spreadsheets in real-time, providing a more efficient and collaborative workflow.
Programming Language
Excel also has a programming language called VBA (Visual Basic for Applications) that allows users to automate repetitive tasks and create custom solutions. With VBA, users can create macros, which are small programs that automate common tasks, such as formatting data or generating reports.
VBA also provides access to many of Excel’s built-in features, as well as the ability to create custom functions and procedures. This allows users to create highly customized solutions that can save time and increase efficiency.
Macros
In addition to add-ins, templates, and complementary tools, users can also consider using Excel macros to automate repetitive tasks and improve productivity. Macros are small programs written in Visual Basic for Applications (VBA) that can be used to automate tasks and add custom functionality to Excel.
- With macros, users can automate tasks such as formatting, data entry, and data cleaning, as well as perform more advanced tasks such as data analysis and modeling. Macros can also be used to create custom functions and formulas that can be reused in other Excel spreadsheets.
- To create macros, users need to have a basic understanding of VBA programming. Excel provides a built-in macro recorder that allows users to record their actions and convert them into VBA code. Users can also write their own code from scratch or modify existing code to create more complex macros.
- Macros can be saved as part of the Excel spreadsheet or as a separate file, and can be easily shared with other users. However, it is important to be cautious when using macros as they can potentially contain malicious code that can harm your computer or compromise your data.
- Excel VBA Macros can be a powerful tool for automating tasks and improving productivity in Excel. By learning how to write and use macros, users can save time and improve their workflow, and add custom functionality to Excel spreadsheets. However, it is important to be careful when using macros, and to ensure that they come from a trusted source and do not contain any malicious code.
Add-ins
In addition to its core features, Excel also supports a wide range of add-ins and third-party applications that can further extend its functionality. For example, users can install add-ins to enhance data visualization, automate data entry, or integrate Excel with other software tools.
Integration with Other Office Applications:
One of the advantages of Excel is its compatibility with other Microsoft Office applications, such as Word and PowerPoint. Excel data can easily be copied and pasted into these applications, allowing users to create professional-looking documents and presentations that include charts, tables, and graphs.
Excel also supports a wide range of file formats, including CSV, TXT, XML, and HTML, making it easy to share data with other applications or import data from external sources. Additionally, Excel can connect to external data sources such as SQL databases, SharePoint lists, and OData feeds, allowing users to work with data from a wide range of sources.
Security Features
Excel also provides various security features, such as password protection and file encryption, that help to keep data safe and secure. This is especially important when working with sensitive or confidential information.
Finally, Excel is widely supported by third-party tools and services, which can further enhance its capabilities. For example, there are many add-ins and plug-ins available that provide additional functionality, such as data analysis tools, charting software, and collaboration platforms.
In conclusion, Excel is a powerful and versatile tool that provides many features and capabilities for managing and analyzing data. Whether you are a business owner, financial analyst, researcher, or student, Excel can help you work with data more efficiently and effectively. Its ease of use, customizability, and compatibility with other applications make it an ideal choice for anyone who works with data on a regular basis.
Resource and Support Communities:
Excel’s popularity has led to the development of many resources and support communities, which can help users learn how to use the software effectively. These resources include online tutorials, user forums, and training courses, which can help users become proficient in Excel quickly.
- Furthermore, Excel’s features are constantly evolving, with new updates being released on a regular basis. These updates often include new tools and functionality that help users work with data more effectively.
- In addition to its features, Excel’s versatility and wide range of applications make it an essential tool for many industries and professions. For example, Excel is commonly used in finance and accounting for budgeting, forecasting, and financial modeling. It is also used in marketing and sales for data analysis, customer segmentation, and campaign tracking.
- In research, Excel is used for data cleaning, manipulation, and analysis. Excel is also frequently used in education, where it is used to teach data analysis, statistics, and financial modeling.
In summary, Excel is a powerful and versatile tool that provides many features and capabilities for managing and analyzing data. Its ease of use, customizability, compatibility with other applications, and wide range of applications make it an essential tool for many industries and professions. With its continued development and support, Excel is likely to remain a key tool for data management and analysis for years to come.
Limitations
Despite its many advantages, Excel is not without its limitations. One limitation is its ability to handle extremely large datasets. While Excel can handle millions of rows of data, it may become slow and unwieldy with datasets that exceed this limit.
- Additionally, Excel is not well-suited for complex data modeling and analysis. While it provides many tools and features for data analysis, it may not be the best choice for advanced statistical analysis or machine learning.
- Another limitation of Excel is its potential for errors. Because it relies on manual data entry and manipulation, it is vulnerable to human errors such as typos and miscalculations. Additionally, its use of cell-based formulas and references can lead to errors when cells are moved or deleted.
- Finally, Excel’s use of proprietary file formats can make it difficult to share data with users who do not have access to the software. While Excel can save files in a variety of formats, users may need to use specialized software to open or work with these files.
- While Excel is a powerful and versatile tool for managing and analyzing data, it does have some limitations. Users should be aware of these limitations and choose the appropriate tools and software for their specific needs. Despite its limitations, Excel remains a popular and widely used tool for data management and analysis, and its continued development and support make it a valuable tool for many industries and professions.
Data security and privacy
Another important consideration when working with Excel is data security and privacy. Excel files can contain sensitive and confidential data, such as financial records, personal information, or trade secrets. As such, it is important to take appropriate measures to protect this data from unauthorized access or disclosure.
- One way to improve data security in Excel is to use password protection. Excel allows users to password-protect their spreadsheets and workbooks, which can prevent unauthorized access or editing. Passwords should be strong and complex, and users should avoid sharing passwords with others or storing them in an insecure location.
- Another way to improve data security is to restrict access to Excel files. Users can use file permissions to control who has access to their Excel files and what they can do with them. For example, users can set read-only permissions for certain users, or prevent users from copying or printing the file.
- Users should also be aware of the risks associated with sharing Excel files over email or cloud storage services. Excel files can be intercepted or accessed by unauthorized parties if they are not encrypted or secured properly. To avoid these risks, users can use secure file-sharing services or encrypt their Excel files before sharing them.
- Finally, users should be aware of privacy laws and regulations that may apply to their use of Excel. For example, certain types of data, such as personal information or medical records, may be subject to specific data protection laws. Users should ensure that they are complying with applicable privacy laws and regulations when working with Excel.
In conclusion, data security and privacy are important considerations when working with Excel. By using password protection, access restrictions, secure file-sharing, and complying with privacy laws, users can protect their sensitive data and ensure that it is not disclosed or accessed by unauthorized parties.
Data accuracy and integrity
Another important consideration when working with Excel is data accuracy and integrity. Excel spreadsheets can be prone to errors, such as data entry mistakes, formula errors, or incorrect formatting. These errors can lead to incorrect analysis, decision-making, or reporting, and can have serious consequences for businesses or organizations.
- To ensure data accuracy and integrity, users should follow best practices for data entry and management in Excel. This includes using consistent and clear naming conventions for data and columns, validating data as it is entered, using data validation rules to restrict data entry to specific formats or ranges, and using formulas and functions to perform calculations and analysis.
- Users should also be careful when using copy-and-paste or importing data from external sources, as these actions can introduce errors or inconsistencies in the data. Users should validate and clean data as it is imported, and ensure that data is formatted consistently with the rest of the spreadsheet.
- Another way to improve data accuracy and integrity is to perform regular checks and audits of Excel spreadsheets. Users can use tools such as Excel’s auditing and error-checking features to identify potential errors or inconsistencies in their data, and correct them before they become serious issues. Users can also use third-party tools or add-ins that provide more advanced auditing and error-checking capabilities.
In conclusion, data accuracy and integrity are critical considerations when working with Excel. By following best practices for data entry and management, validating and cleaning data, performing regular checks and audits, and using tools and add-ins that improve data accuracy and integrity, users can ensure that their Excel spreadsheets are reliable, accurate, and trustworthy.
Alternative Applications
To mitigate some of the limitations of Excel, there are several alternatives and complementary tools that users can consider. For example, users can consider using more advanced data analysis software such as Python, R, or MATLAB, which offer more powerful statistical analysis and machine learning capabilities.
- Users can also consider using cloud-based data management and analysis tools such as Google Sheets or Microsoft Power BI, which offer collaborative features, more powerful data visualization options, and support for larger datasets.
- Finally, to ensure compatibility and interoperability with other software and systems, users can consider using open-source or non-proprietary file formats such as CSV or JSON, which can be read and manipulated by a wide range of software tools and platforms.
- In summary, while Excel remains a valuable tool for data management and analysis, it is important for users to be aware of its limitations and consider using complementary tools and software to meet their specific needs. By combining Excel with other tools and techniques, users can work more efficiently, reduce errors, and extract more value from their data.
Conclusion
Excel is constantly evolving, with new features and capabilities being added with each new version. For example, recent updates have introduced new functions, new chart types, improved data analysis tools, and enhanced collaboration features.
- Excel is also widely used in data analysis and business intelligence. With features like Power Query and Power Pivot, users can easily connect to external data sources, clean and transform data, and create interactive dashboards and reports.
- In addition to its business applications, Excel is also used extensively in education, where it is used to teach data analysis, mathematical modeling, and financial analysis.
- Overall, Excel is a powerful and versatile tool that can be used to perform a wide range of tasks. Whether you are a small business owner, financial analyst, researcher, or student, Excel can help you manage and analyse data more efficiently, saving you time and improving your productivity. With its user-friendly interface, extensive feature set, and customizability, Excel is a valuable tool for businesses, professionals, and individuals alike.
In conclusion, while Excel has some limitations, there are many ways to overcome these limitations and enhance its capabilities. By using add-ins, templates, and complementary tools and software, users can work more efficiently, perform advanced analysis, and share data more effectively. With its continued development and support, Excel is likely to remain a key tool for data management and analysis for years to come.
Excel Objects and Definitions

What is Excel Ribbon?
Excel ribbon is the navigation menu in Excel, shows all the Controls and Commands in different Tabs.

What is Excel Workbook?
Excel Workbook is the Main File which can contain at one or more worksheet or spreadsheets.

What is Excel Worksheet?
Excel workbook can contain more than one worksheet. It is a spreadsheet with rows, columns and cells.

What is Excel Range?
Excel range is the worksheet object contains one or more Cells.

What is Excel Cell?
Cell is an Object of Excel Sheet to enter information. It represents with Column Name followed by Row Number.

What is Excel Row?
Rows are the Records in Excel Spreadsheet. Excel Rows are represented by row numbers (1,2,3,…).

What is Excel Column?
Columns are Fields in Excel Spreadsheet. Each Column in a sheet represented with a unique Column Name, starts with Column name A.

What are Excel Macros?
A Macro is a re usable tiny program which we can save and run to repeat the same action or tasks in Excel.

What is Excel VLookUp?
VLOOKUP Function in Excel helps to lookup the corresponding values of a Range, Table and Arrays.
- Microsoft Excel
- What’s New in Excel?
- MS Excel Resource
© Copyright 2012 – 2020 | Excelx.com | All Rights Reserved
Page load link
Microsoft Office Excel is one of the most important tools to perform the calculation, analysis, and visualization of data and information. It helps people to organize and process data by the use of columns and rows with formulas and some cool features of MS Excel. In MS-Excel 2010, row numbers range from 1 to 1048576. There are a total of 1048576 rows, and columns range from A to XFD and there are a total of 16384 columns. Now, let’s take a closer look at some of the best Microsoft Excel features or functions you can use to become more efficient.
- Vlookup() function
- Pie Chart
- Mixed or Combination Type Charts
- Data Validation
- IFERROR Function
- Removing Duplicates
- Conditional Formatting
- MINVERSE() function
- DB() function
- Data Visualization
- Complex() function
- MKDIR() function
- IF() and OR() functions
- Hyperlink() function
- Transpose() function
- INDIRECT() function
- FORMAT() function
- CONCATENATE() function
- Paste Special
- TRIM() function
- ROUND() function
- PROPER() function
- NOW() function
- CHOOSE() function
- Named Ranges
- Quick Feature
- Input Restriction
- New Shortcut Menu
- Hide Data
- PMT() and IPMT() functions
- REPT()
- CONCATENATEX
- NETWORKDAYS
- ACCRINT
- DOLLARDE
- FV
- DISC function
- RANDBETWEEN
- QUARTILE
- INDEX MATCH
1. Vlookup()
This function helps to search for a value in a table. It returns a corresponding value. In other words, it searches for the given value and returns a matching value from another column. To know more about it, let’s look at the following syntax and its example.
Syntax: VLOOKUP(lookup_value, table_array, col_index_num, [range_lookup])
In the above syntax, lookup_value is the value to search for. It can be text, date, or number. Table_array is two or more data columns. Col_index_num is the column number in table_array from which the value in the comparable row should be returned.
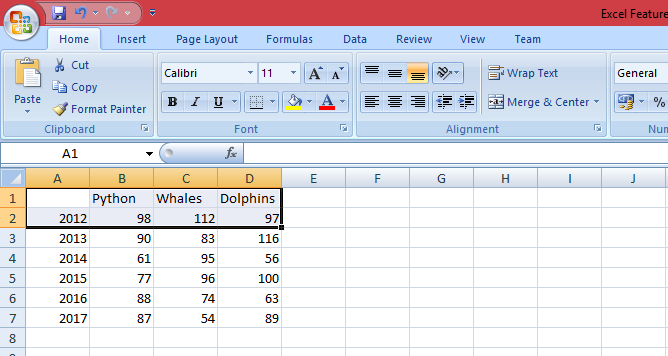
Example: In the below example we have student names and marks in different subjects in columns B to E.
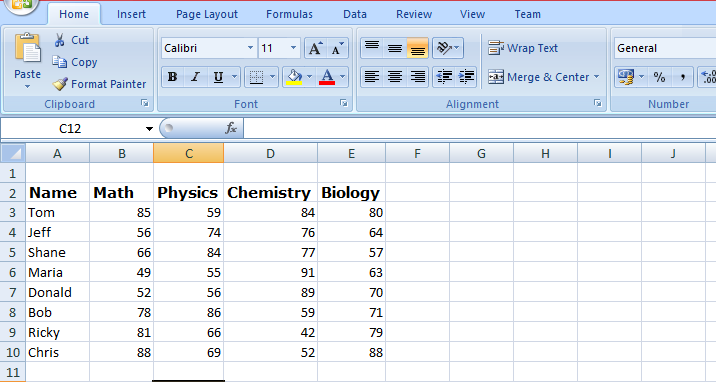
From the above data, we need to know how much Ricky scored in Math.
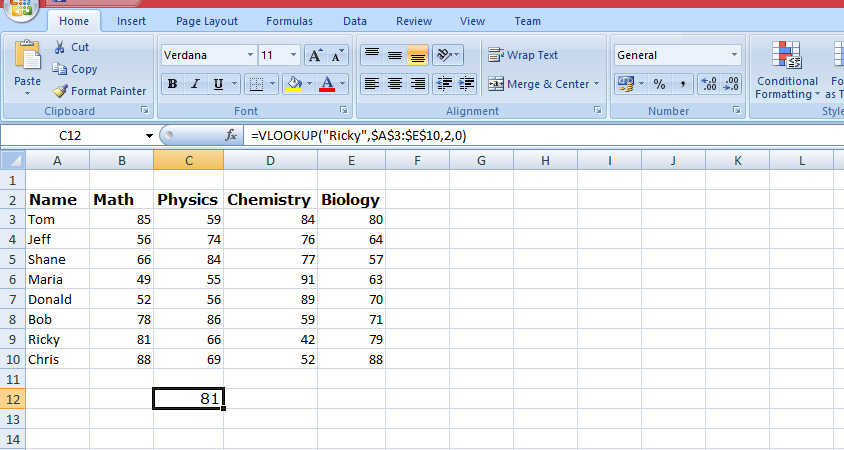
Here is the VLOOKUP formula that will return Ricky’s Math score:
=VLOOKUP("Ricky",$A$3:$E$10,2,0)
First, it looks for the value of Ricky in the Name column. It goes from top to bottom and finds the value in cell A9. After that, as soon as it finds the value of the Math score, it goes to the right in the second column (Math) and fetches the value in it. The following picture shows us Ricky’s marks.
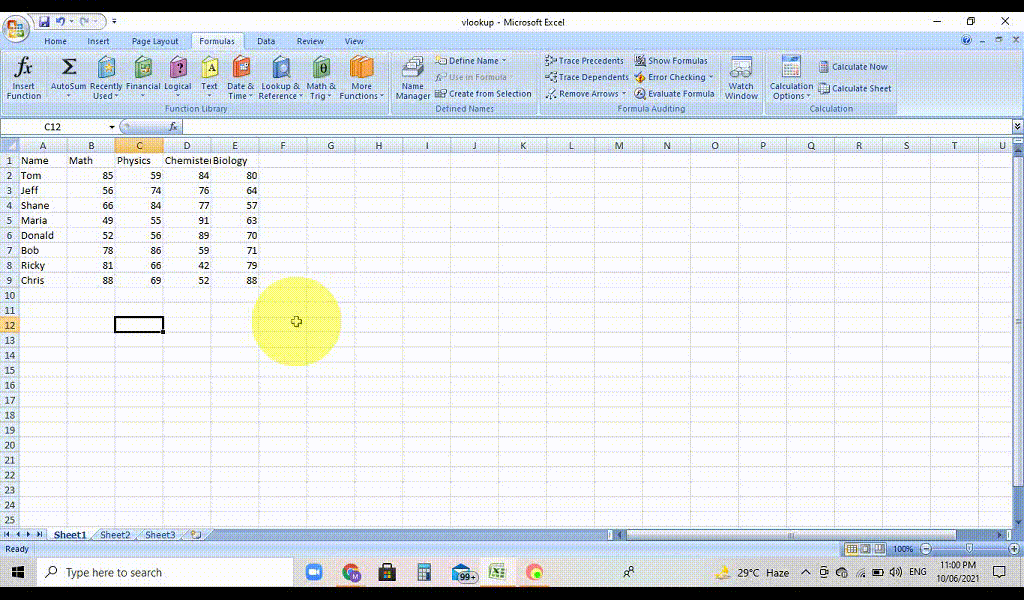
Check out this little demo to see how you can use the VLOOKUP formula:
2. Pie Chart
The pie chart is one of the best MS Excel features. It is used to visualize the contribution of each value to a complete pie diagram. It always uses one data series.
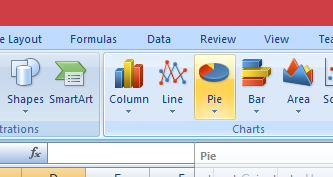
Follow the below steps to create a pie chart:
- Select the range A1: D2.
- Now On the Insert tab, in the Charts group, click the Pie symbol and then click Pie.
- After clicking, the following image will show the result.
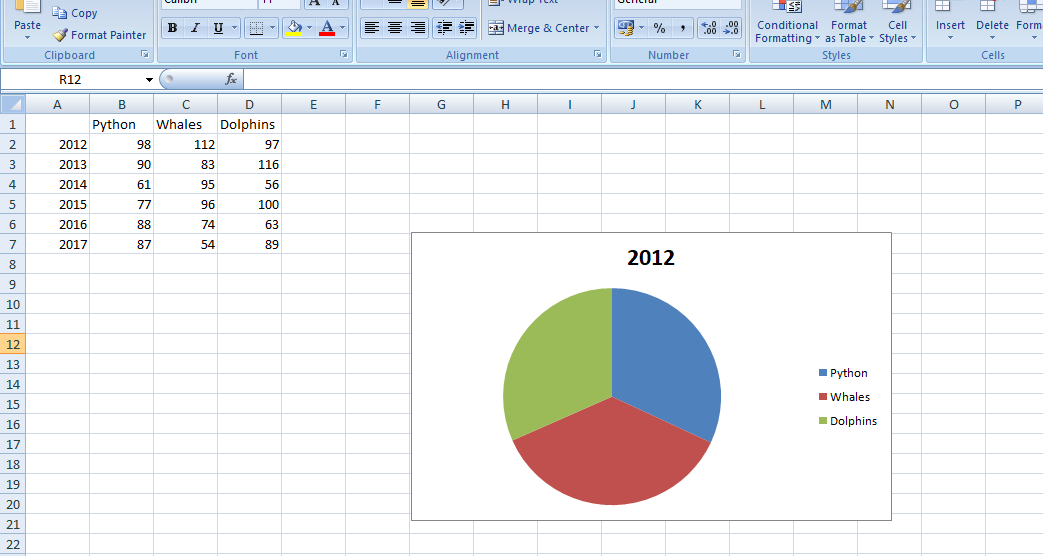
The above figure shows us the pie chart for the year 2012. It is showing us the Python slice, Whales slice, and Dolphins’ slice. In short, the contribution of each slice.
Please find a comprehensive demo where you can see how the pie chart can be used:
3. Mixed or Combination Type Charts
A mixed or combination chart is one of the top features of MS Excel. It combines and displays two or more chart types in a single chart.
To create a combination chart follow the following steps:
- Select the range A1: C13.
- Now, On the Insert tab, in the Charts group, click the Combo symbol, and after that click on create custom combo chart.
- Now, the insert chart dialogue box will appear. Now, for the rainy days series, select the clustered column as the chart type. After that for the profit series, select line chart type. Now, plot the profit series on the secondary axis.
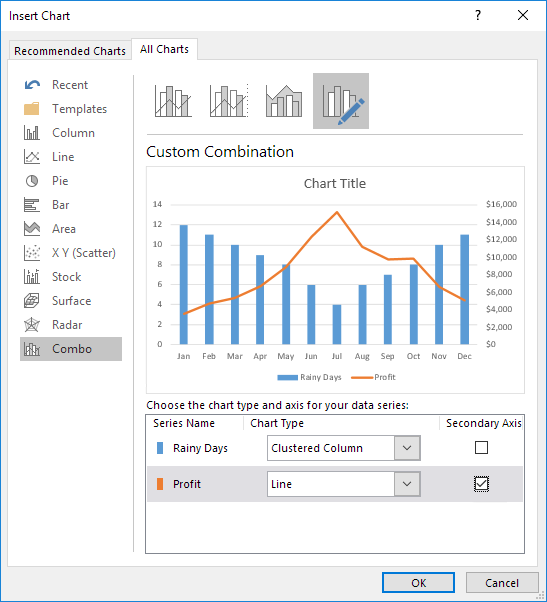
- After clicking OK, it will display the following result:
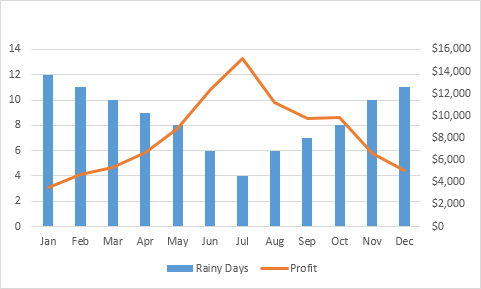
A mixed or combination chart is one of the coolest Microsoft Excel advanced features and functions.
4. Data Validation
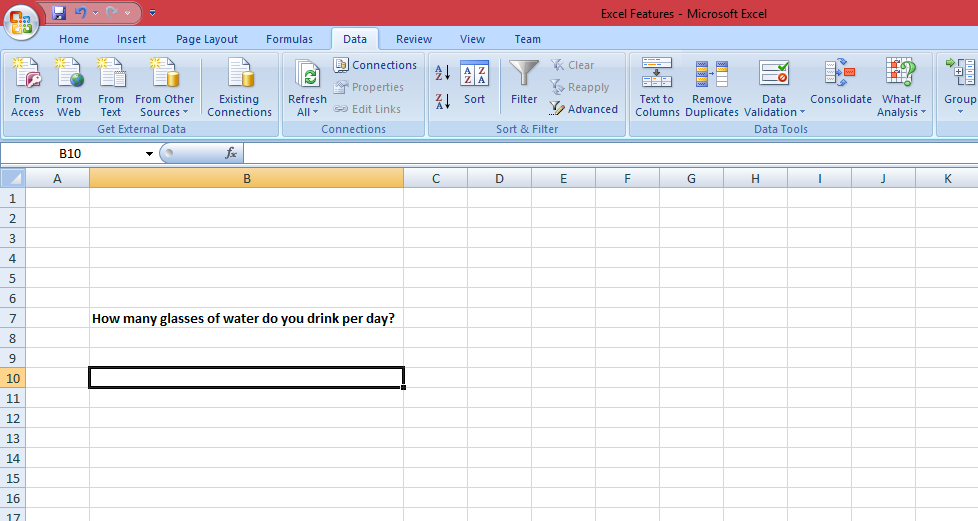
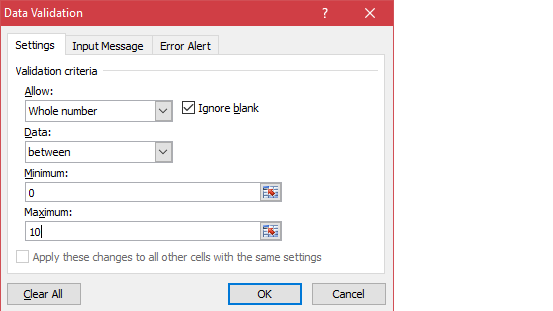
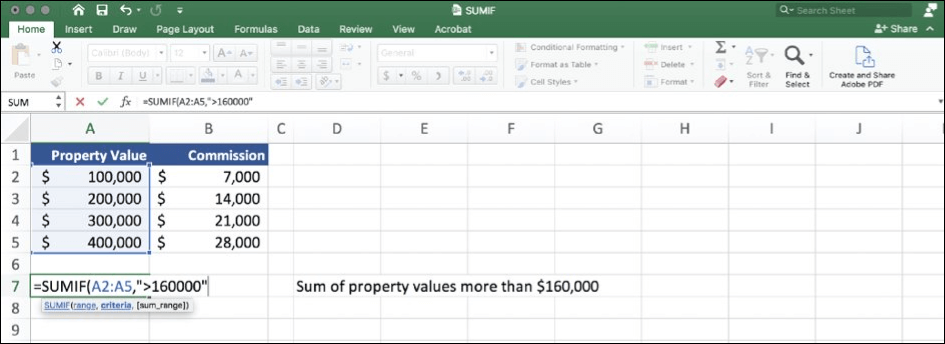
Data validation is one of the most powerful excel capabilities. It makes sure that users enter particular values into a cell. In the following example, we have restricted users to enter a whole number between 0 and 10.
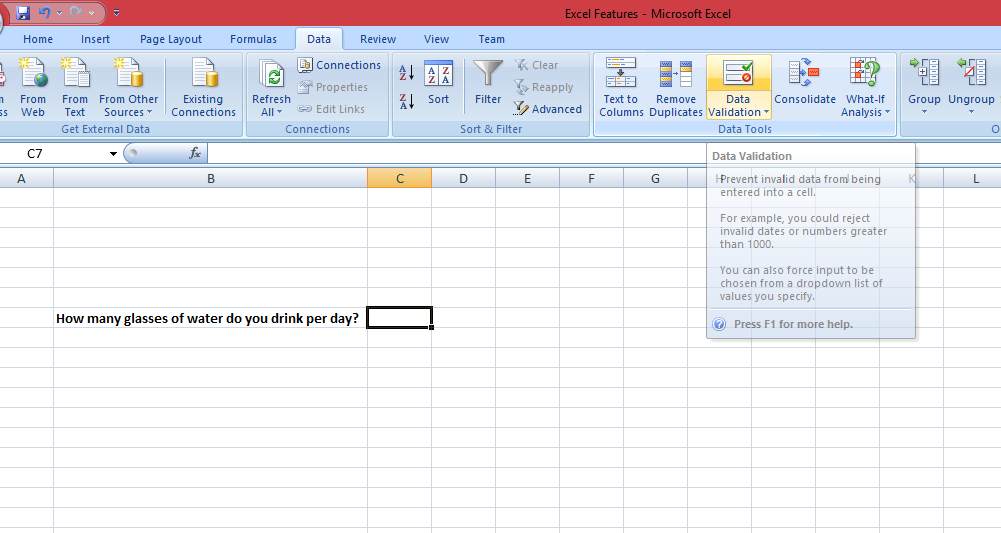
- Now, to create Data Validation Rule, Select cell C7 and now on the Data tab, in the Data Tools group, click Data Validation.
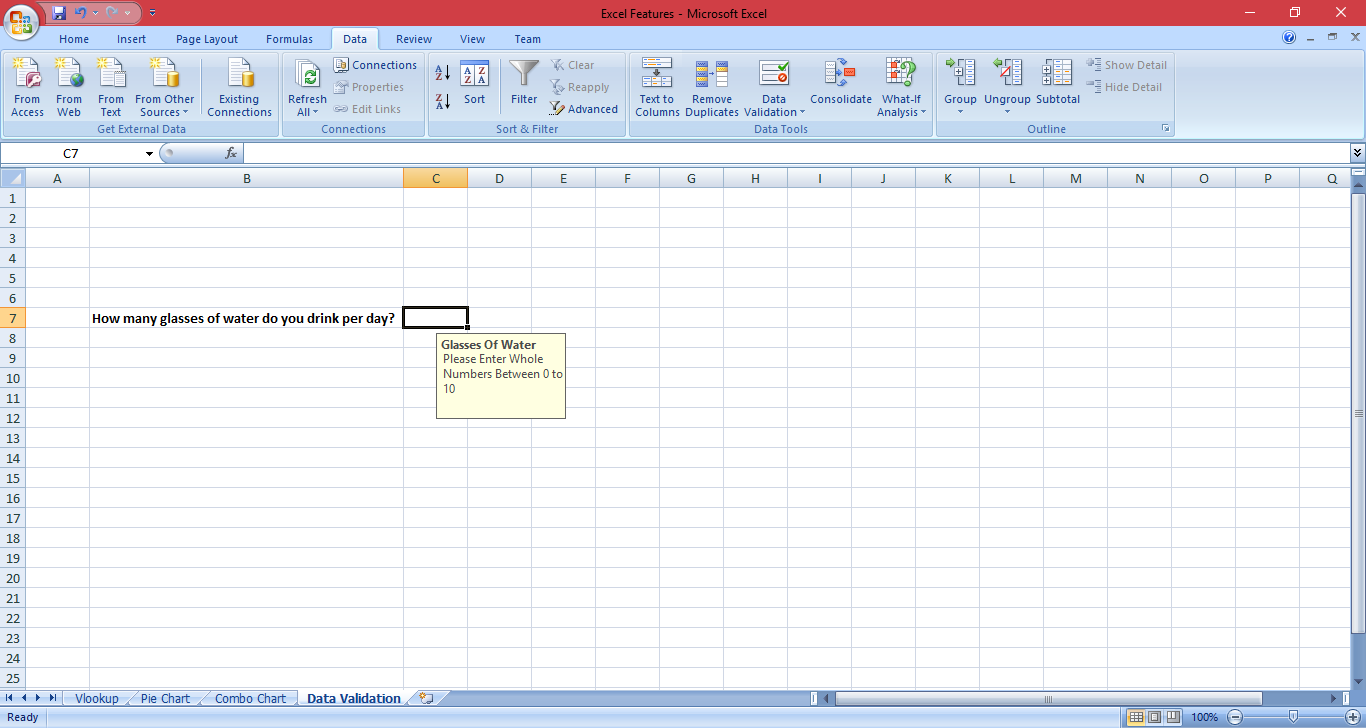
- Now, On the Settings tab, in the allow list, click the Whole number, and after that in the data list, click between. Now enter the minimum and maximum values.
- Now, after this click on Input Message and set the input message. After finishing this click on the Error Alert tab and set the error message to display if a user enters other than whole numbers or some other text. The following two figures show you the result.
Now, try to enter a number higher than 10. The following image is showing us the result:
5. IFERROR Function
If you are in the field of data analysis then IFERROR is one of the coolest advanced Excel formulas and functions. It returns a result when a formula generates an error and a typical result when no error is found. IFERROR is a simple way to manage errors without using more complex nested IF statements.
Syntax
=IFERROR (value, value_if_error)
Example:
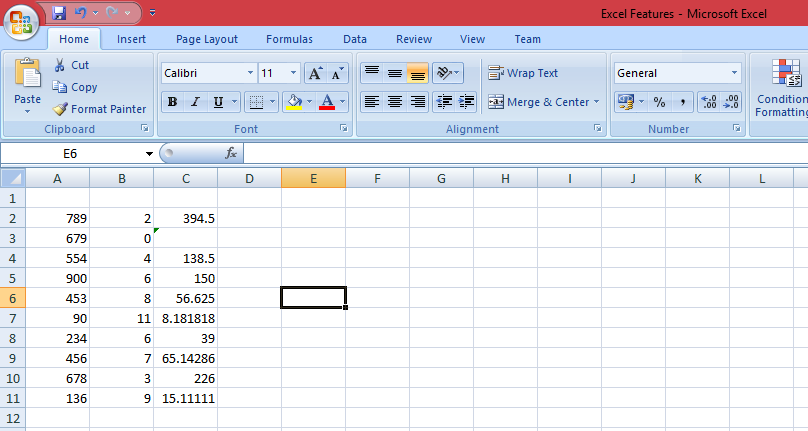
The following example will show the use of IFERROR function. This example displays the #DIV/0! error when a formula tries to divide a number by 0.
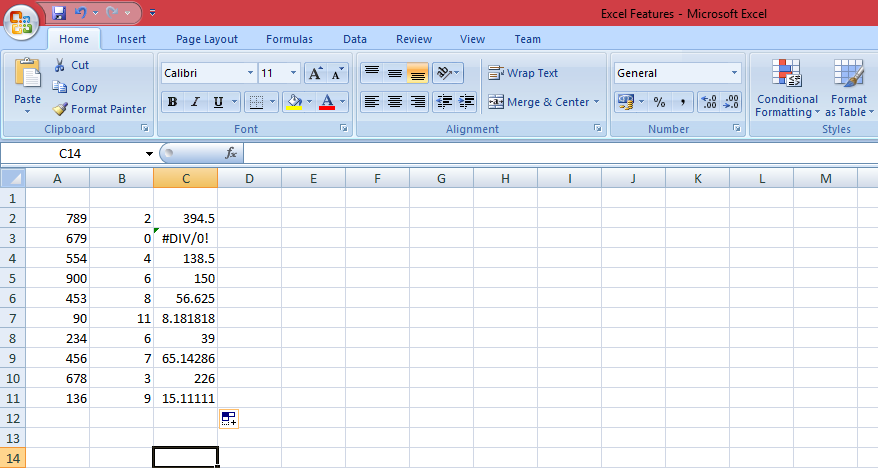
Now if we use iferror function then if a cell contains an error, an empty string (“”) is displayed.
6. Remove Duplicates
Removing duplicates is the most powerful ms excel feature for people who work as data analyst or those who play with data regularly. This example shows you how to remove duplicates in Excel. Check the following example. Click any single cell inside the data set and on the Data tab, in the Data Tools group, click Remove Duplicates.
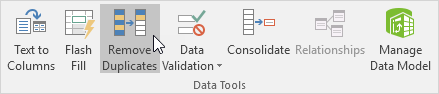
The following dialogue box will appear. Now, leave all checkboxes checked and click OK.
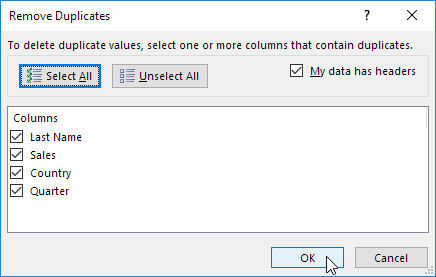
MS Excel will remove all identical rows (blue) except for the first same row.
To remove duplicates, sort, and clean lines in Google Docs / Google Sheets please check these free plugins: Lines Sorter and Cleaner plugin for Google Sheets and Lines Sorter and Cleaner plugin for Google Docs.
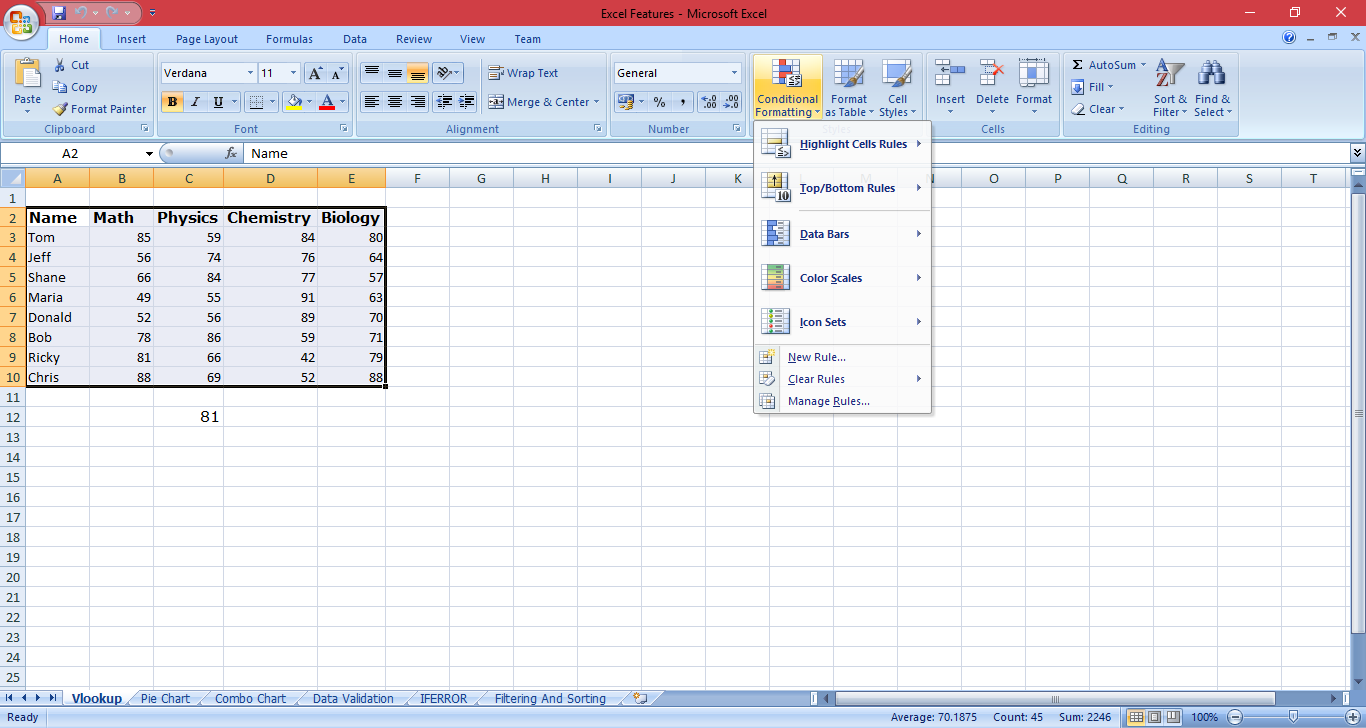
7. Conditional Formatting
Conditional formatting allows a user to change the format of a cell depending on the content of the cell, a range of cells, or another cell or cells in the spreadsheet. It also allows users to highlight errors and find important patterns in data. Conditional formats can apply basic font and cell formattings like number format, font color, and other font properties, cell borders, and cell color. Also, there are different conditional formats that allow visualizing data by using icon sets, color scales, or data bars.
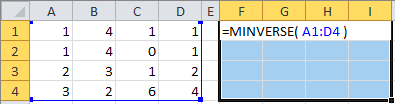
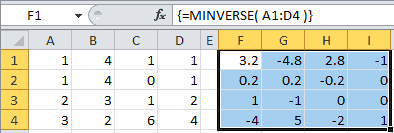
8. MINVERSE
The Microsoft Excel MINVERSE function gives the inverse matrix of a given matrix. This function comes under Math/Trig Function.
Syntax: MINVERSE( array )
In the below example, the minverse function is entered into cell F1 of the spreadsheet. It will be like =MINVERSE( A1: D4 ). Check the following images for a result.
The result is displayed in cells from F1 to I4.
9. DB Function
Microsoft Excel DB function is a financial function. It allows users to calculate the depreciation of an asset. In this, the fixed-declining balance method for each period of the asset’s lifetime is used.
Syntax=DB(cost, salvage, life, period, [month])
In the following spreadsheet, the DB function is finding the yearly depreciation of an asset that costs $10,000 at the start of year 1, and has a salvage value of $1,000 after 5 years.
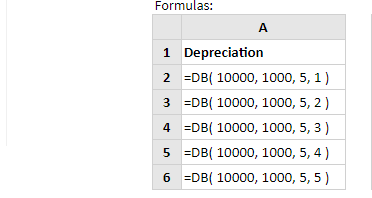
Now after entering the above formulas in each cell the following figure is showing us the result.
10. Data Visualization
Data is the new oil and data visualization is also one of the most powerful Microsoft Excel features. Sparkline is an amazing excel feature. It is also called a visualization tool for MS Excel that enables people to perfectly visualize the overall trend of a set of values. In short, sparklines are mini-graphs situated inside cells. The following example will show you sparklines.
To create the sparklines, follow these steps Select the range that contains the data that you’ll plot. Now, Go to Insert > Sparklines > Select the type of sparkline you want (Line, Column, or Win/Loss). In the above example, we are using lines. Check the below image to see the result:
11. Complex Function
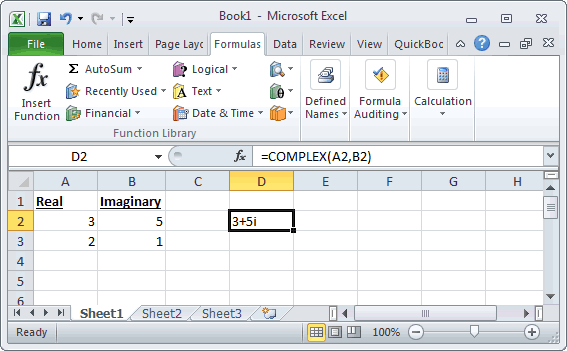
COMPLEX function converts real and imaginary coefficients into a complex number like x + yi or x + yj.
Syntax: COMPLEX( real_coefficient, imaginary_coefficient, [suffix] )
The following image is showing us the conversion. If you write =COMPLEX(A2, B2) in the D2 cell then it will convert a real and imaginary number into a complex number 3+5i as shown in the figure.
12. MKDIR
Yes, MKDIR exists in MS Excel and it is one of the most underrated excel capabilities. It comes under the File/Directory Function. MKDIR can be used as a VBA function. It can be used in macro code that is entered through the Microsoft Visual Basic Editor.
Syntax: MkDir path
Example: MkDir “c:SampleExcel2010”
The MKDIR command will only create the Excel2010 directory under the c:Sample directory. It will not create the c:Sample folder automatically.
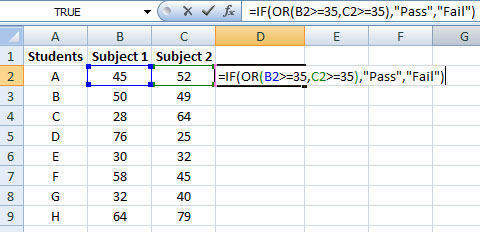
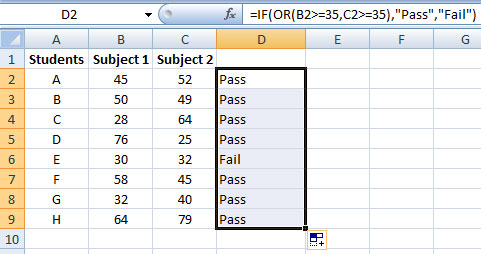
13. IF and OR function
If you want a binary result in excel then the If and Or function is useful. In short, if you want to achieve True or False or Pass or Fail as a result then If or function can be used. In this, our formula starts with an IF function, and in that, we embed the OR function. See the below image.
Now when you press enter and drag the fill handle, the Pass or Fail result will be displayed. Check the below image.
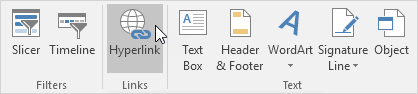
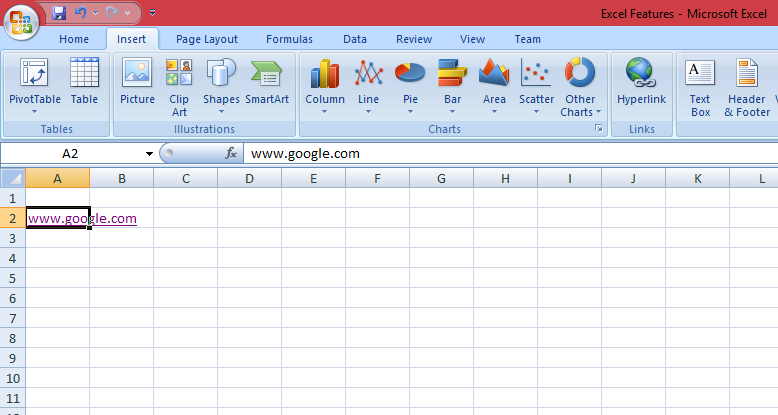
14. Hyperlink
The Excel HYPERLINK function allows you to create a shortcut to a file or website address. To create, click on the Insert tab, in the Links group, click Hyperlink.
Insert Hyperlink dialogue box will appear. Now, to create a link to an already created Excel file, select a file.
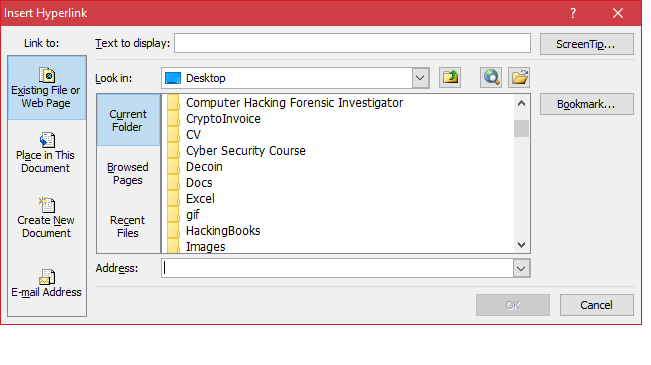
Now, to create a link to a web page, type the text to display, and click OK. We have entered google.com as text to display and the following image is showing us the result.
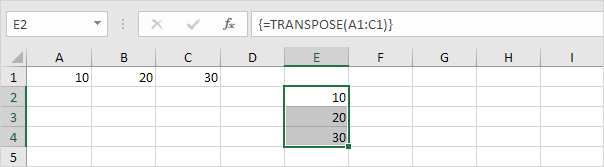
15. Transpose
The TRANSPOSE function allows users to a transposed range of cells. It returns a horizontal range of cells when a vertical range is entered as an input. Or a vertical range of cells is returned if a horizontal range of cells is entered as an input. It comes under a Lookup/Reference Function of features of MS Excel.
Syntax: TRANSPOSE( range )
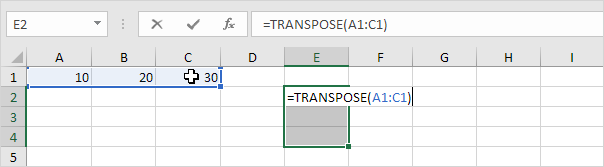
After entering the function. The below image is showing us the result.
Check this article as a VIDEO
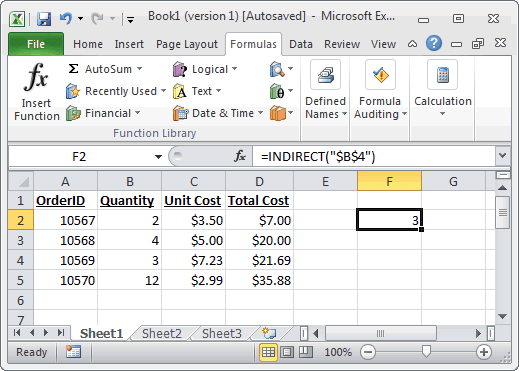
16. INDIRECT
This function returns the reference to a cell based on its string description. It comes under the Lookup/Reference feature of MS Excel. It returns the referenced cell’s value.
Syntax: INDIRECT( string_reference, [ref_style] )
The following image shows us the use of the INDIRECT function.
17. FORMAT
FORMAT function accepts a string argument and returns it as a formatted string. It comes under the String/Text Function of Microsoft Excel.
Syntax: Format ( expression, [ format ] )
Let’s look at some Excel FORMAT function examples:
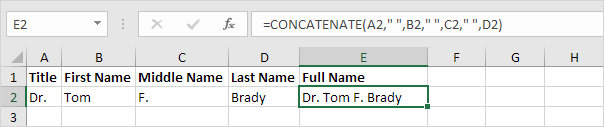
18. CONCATENATE
CONCATENATE function enables users to join 2 or more strings together.
Syntax: CONCATENATE( text1, [ text2, ... text_n ] )
The following figure is showing us the use of the CONCATENATE function:
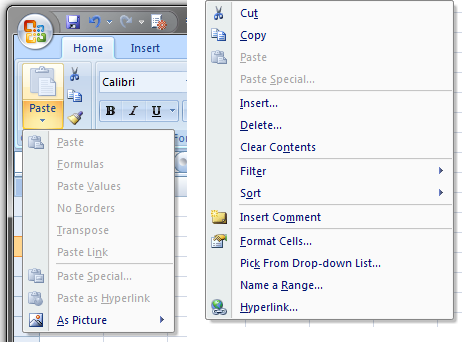
19. Paste Special
Paste Special is one of the most amazing features of Excel. It enables the user to control how the content will be displayed when pasted from the clipboard. The following image is showing how to use paste special.
20. TRIM
If you want to remove extra spaces from a spreadsheet then the TRIM function is useful. The trim function will remove all the unnecessary trailing and leading spaces from the cell.
Syntax: TRIM(text)
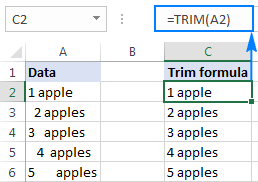
The above figure is showing you how the TRIM function works. It has removed the unwanted spaces from column A and the result is displayed in column C.
Stay tuned and check our next article about Advanced functions in Google Sheets.
Check 10 more Microsoft Excel functions below!
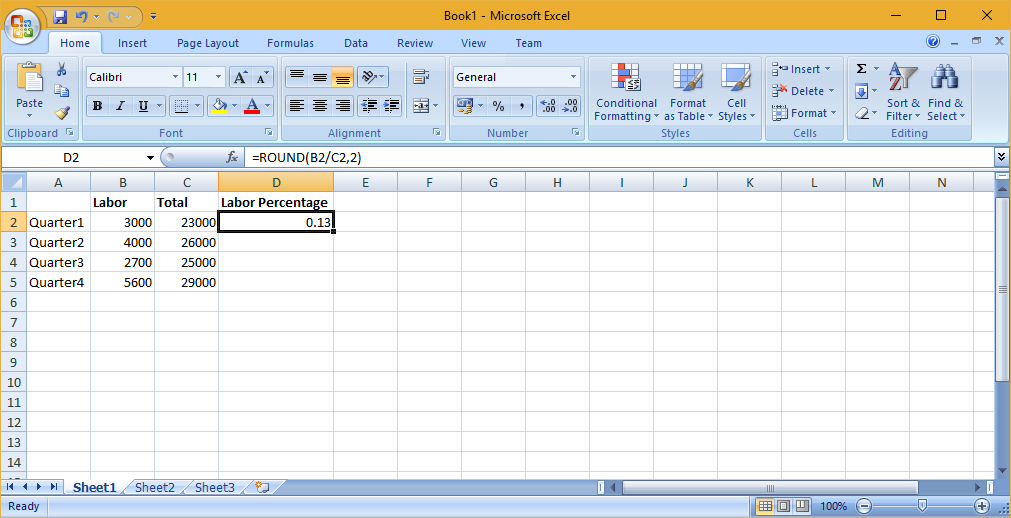
21. ROUND Function
This is one of the coolest Microsoft Excel features. The round function is utilized to receive an amount that has several decimals and round it to the number of specified decimals.
The following image is displaying the use of the Round function. In this, we have divided labor into Total expenses in column D. If we just implement the formula B2/C2, the large number after the decimal will be displayed.
To avoid this we have used the Formula: =ROUND(B2/C2,2). This will format the cell into 2 decimals and it will display it perfectly. The Round() function is pretty useful if there are large decimal numbers. This function is similar to that of Round() function used in SQL.
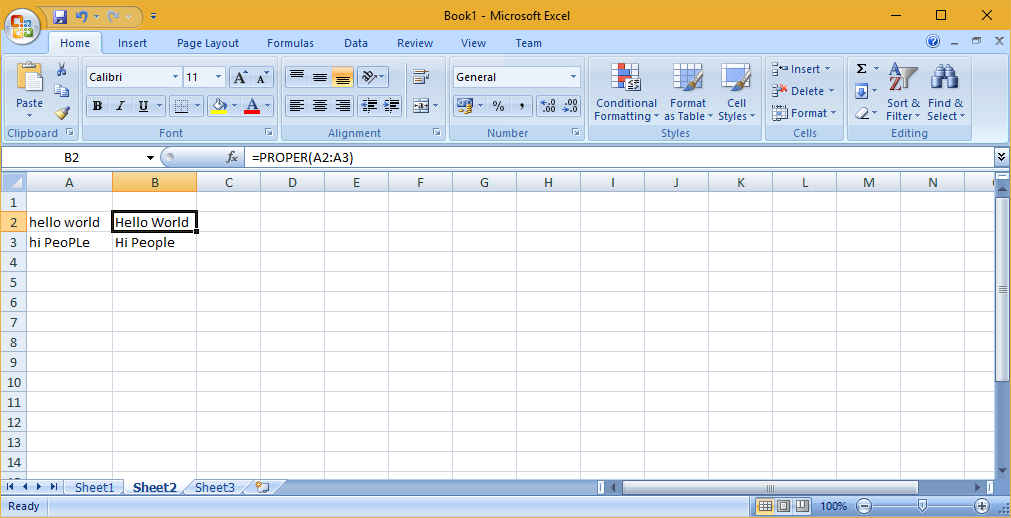
22. PROPER
The PROPER function is used to make each of the entered phrases into a proper-looking style or sentence cases. It is a text function that is used to capitalize each word. The following image is displaying the use of the PROPER function. In this function, you just have to enter the formula =PROPER(A2:A3). The range can be anything. The function is a string function and will convert the entered text into the proper sentence case. The PROPER function is crucial if users have involved in text spreadsheets while data migration. It is simple to implement and use to convert text into proper sentence structure.
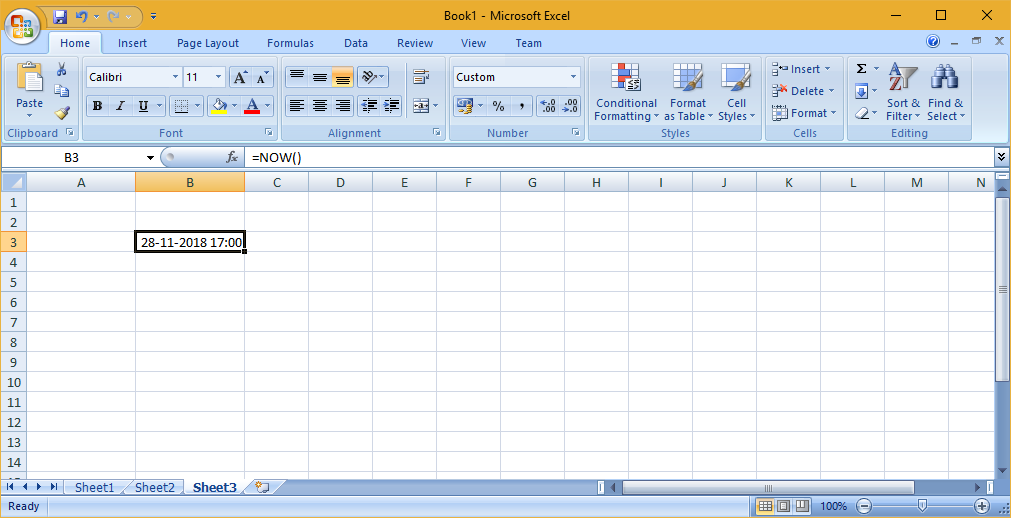
23. NOW function
The NOW function is pretty simple. It is an uncomplicated function that will just tell users precisely what time and day it is. By using this function users can format it as a date to show the date and time or just the date. The following image is displaying the use of NOW() function. Cell B3 is displaying the current date of your system after you enter this formula =NOW() in cell B3.
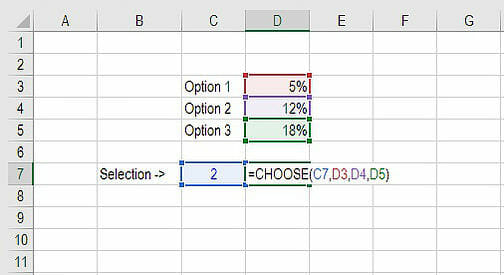
24. CHOOSE function
The CHOOSE function is excellent for summary analysis in commercial modeling. It enables users to choose between a particular number of options, and answer the selected choice. For example, there are three distinct postulates for revenue growth next year: 5%, 12%, and 18%. Applying the CHOOSE formula users can return 12% if they recognize Excel you want choice. The following image is displaying the result.
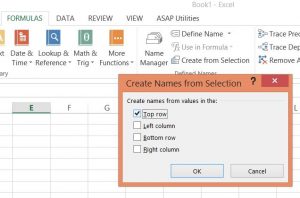
25. Named Ranges
This is one of the best advanced Excel features. If there are large numbers then this feature is helpful to give names to ranges so that users can refer to these names in advanced Excel formulas without clicking and picking long ranges. To promptly give names to the ranges follow these steps:
- Click on the Formulas menu option on the ribbon.
- Now in the next step, click on the Create from Selection button.
- Now in the third step, Select the ranges to give names.
- The following image is displaying the use of Named Ranges.
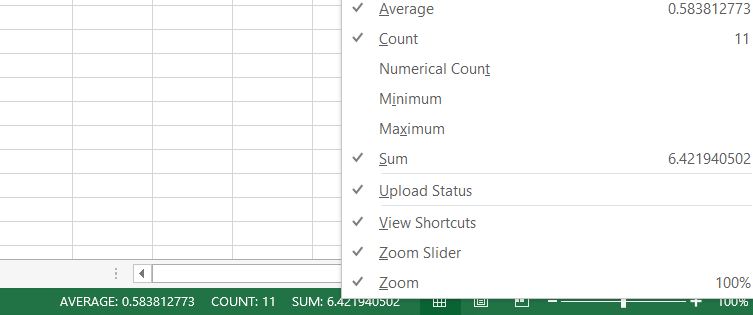
26. Quick Feature
This is one of the best advanced excel tools for business. This feature gives aggregate statistics like Average, Count, Numerical Count, Max, Min, and Sum of the data from a picked range without inserting any formula. To display these results in the bottom toolbar, right-click on the toolbar and pick the wanted statistic. The following image is displaying the use of this feature. The quick feature is really helpful if users want to aggregate numbers quickly.
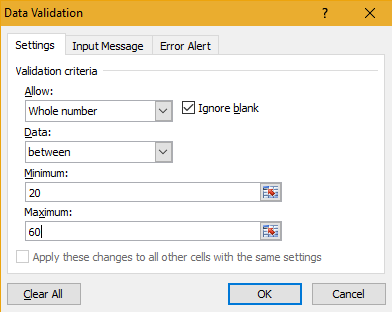
27. Input Restriction
This feature is useful to preserve the validity of data. Often, users need to check the input value and give some advice for further steps. For example, the date of birth in the sheet should be in DD/MM/YYYY format and all users engaging should be between 18 and 55 years old. This feature is just like constraints.
To assure that data outside of this rule isn’t inserted, go to Data->Data Validation->Setting, input the conditions and shift to Input Message to give suggestions like, “Please input your date of birth in DD/MM/YYYY format, which should range from 20 to 60. Users will get this message when hovering over the pointer in this area and get a notification message if the entered data is not proper. The following image is displaying the use of these features.
28. New Shortcut Menu
Usually, there are three shortcuts on the top menu. These are Save, Undo Typing, and Repeat Typing. Nevertheless, if users want to apply or use more shortcut options such as Copy and Cut then they can set them up by following these steps: File->Options->Quick Access Toolbar, add Cut and Copy from the left column to the right, save it. The two more shortcuts will get added to the top menu. This is one of the coolest features of Excel which helps users to quickly apply Excel useful functions. There are many such functions that can be implemented on the top menu by following this simple trick.
29. Hide Data
Almost all Excel enthusiasts understand how to hide data by right-clicking to select the Hide function. The problem with this is that this can be quickly seen if there is only limited data. The safest and smoothest way to hide data completely is to utilize the Format Cells function. Follow these steps: Pick the area and go to Home->Font->Open Format Cells->Number Tab->Custom-> Type;;; -> Click OK, then all the contents in the area will be hidden, and can only be spotted in the preview area near to the Function button.
30. PMT and IPMT
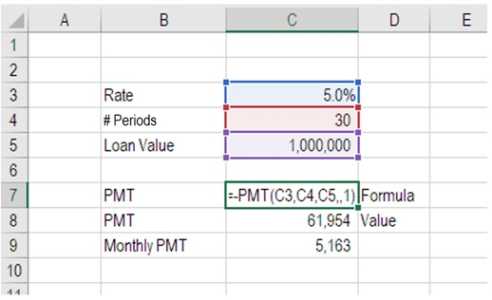
If users are working in any finance sector, real estate, FP&A, or any business analyst position that handles debt programs then these ones are one of the most important Excel advanced functions. The PMT formula provides users with the value of equal amounts over the period of a loan. Users can apply it in combination with IPMT which explains to users the interest amounts for the equivalent type of loan and then separates principal and interest amounts. The following image is displaying how to use the PMT function to get the regular mortgage amount for a $1 million debt at 5% for 30 years.
31. REPT()
The REPT Function is classified under logical functions. The function will duplicate characters a supplied number of times. In a business report, REPT can be used to load a cell to a particular range. We can also develop histograms, a chart usually applied in commercial modeling, utilizing the function by altering values immediately into a definite number of (iterated) cases. This is one of the most important excel functions. It is widely used in business analytics.
Formula =REPT(text, number_times)
The following sample returns the string in the column, [MyValue], returned for the number of terms in the column, [MyAmount]. Because the method continues for the complete column, the output string depends on the topic and amount value in every row.
=REPT([MyValue],[MyAmount])
Output
| MyValue | MyAmount | ResultingColumn1 |
| Text | 3 | TextTextText |
| Number | 0 | |
| 89 | 3 | 898989 |
32. CONCATENATEX
This function Concatenates the outcome of the character assessed for each row in a table. This function accepts as its primary parameter a table or that delivers a table. The second parameter is a column that includes the conditions you want to concatenate, or a character that reflects value.
Example
EMP table
| FirstName | LastName |
| Jeff | Smith |
| Allen | Ford |
CONCATENATEX(Enames, [FirstName] & “ “ & [LastName], “,”)
Returns “Jeff Smith, Allen Ford”
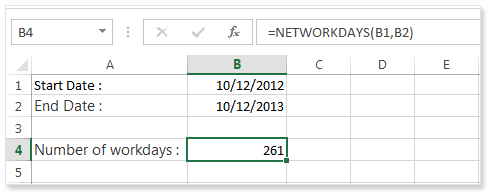
33. NETWORKDAYS
The NETWORKDAYS function estimates the number of workdays between two terms in Excel. It also enables you to jump-defined leaves and only includes working days. It is characterized in Excel as a Date/Time Function. You can apply this method to determine working days in Excel within two dates.
Formula
=NETWORKDAYS(start_date, end_date, [holidays])
For example, the example below gives the number of workdays between the beginning (10/10/2012) and end date (12/10/2013).
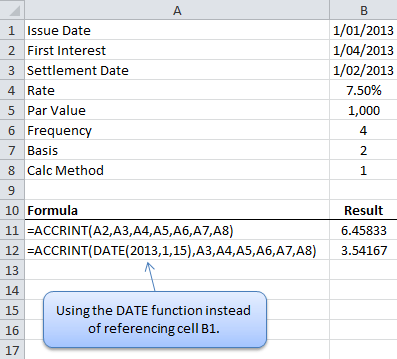
34. ACCRINT
The ACCRINT function will determine the accrued profit for a bond that gives interest periodically. ACCRINT assists users to determine the accrued benefit on security, such as a bond, when that security is traded or is transported to a new buyer on a date other than the delivery date.
The ACCRINT function was included in MS Excel 2007 and so is not accessible in earlier versions. In economics, security rates are rated “clean”. The “clean price” of a bond eliminates any profit collected since the delivery date or most current card payment. The “dirty price” of a security is the amount including accrued gain. The ACCRINT function can be applied to determine accrued benefit for security that gives periodical business but pay heed to date arrangement.
Formula
=ACCRINT(issue, first_interest, settlement, rate, par, frequency, [basis], [calc_method])
The following image is displaying the use of ACCRINT
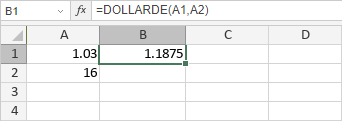
35. DOLLARDE
It assists in transforming a dollar amount in partial representation into a dollar value shown in decimal representation. DOLLARDE will break the section part of the content by an integer defined by the user. It is utilized in valuing US depository bond quotes, which are assessed to the most next 1/32 of a dollar. The function is very helpful for business analysts when creating business reports using capital market figures, as divided dollars are utilized for bond prices. DOLLARDE is accessible from MS Excel 2007.
Formula
=DOLLARDE(fractional_dollar, fraction)
The following image is displaying the use of DOLLARDE function
36. FV
The FV function in Excel is a business function that gives the expected value of an investment. You can apply the FV function to obtain the anticipated price of an investment considering intermittent, regular payments with a fixed interest rate. Users should be constant about the units they apply for defining valuation and nper. If you make regular returns on a four-year loan at 12% yearly interest, one can apply 12%/12 for valuation and 4*12 for nper.
=FV (rate, nper, pmt, [pv], [type])
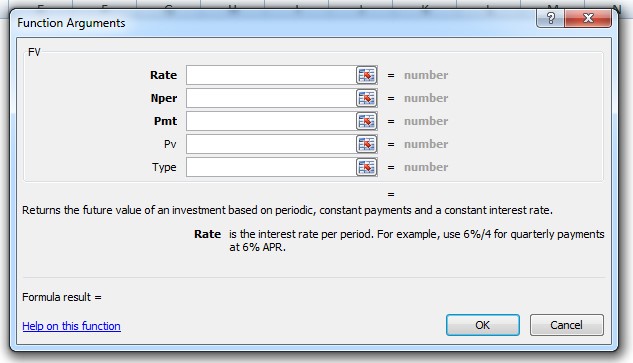
Example: Take the sample data in the given table given in Microsoft, and paste it in cell A1 of your worksheet. For functions to display results, choose them, press F2, and then Enter.
| Data | Description | |
| 0.06 | Interest rate | |
| 10 | Total payments | |
| -200 | Amount | |
| -500 | Present value | |
| 1 | Due Payment is due at the beginning of the period | |
| Formula | Description | Result |
| =FV(A2/12, A3, A4, A5, A6) | Future value of an investment using the terms in A2:A5. | $2,581.40 |
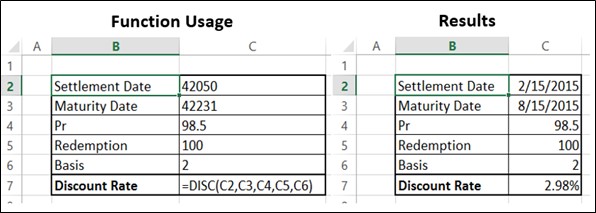
37. DISC function
The DISC function determines the Discount Rate for security. The security’s adjustment date or one can say that the date that the security ticket is bought. The security’s maturity date or the date that the security ticket expires
The syntax of the function is:
DISC( settlement, maturity, pr, redemption, [basis] )
Example: The following image is displaying the use of the DISC function.
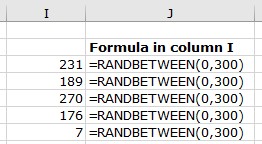
38. RANDBETWEEN
This function allows users to pick a number within an already defined range of numbers. Once users place the lowest and the highest numbers, Excel can pick the correct information from the areas to which the titles in the Range are connected and select from them. The syntax of this function is:
=RANDBETWEEN(starting point, ending point)
Example:
The Randbetween function is used to generate one or multiple random numbers between two values.
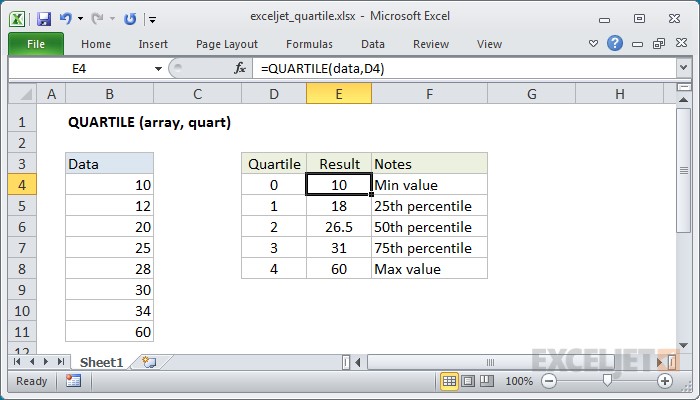
39. QUARTILE
The Quartile function gives the quartile or each of four equal groups in a distributed assortment of data and can give minimum value, first quartile, second quartile, and maximum value. This function returns the quartile value of the cells in an arrangement. It also returns a statistical value as per the entered percentile. Quartiles usually are applied in sales and review data to classify communities into groups. For instance, one can apply the QUARTILE function to discover the top 25 percent of revenues in a population.
Syntax:
=QUARTILE (array, quart)
Example:
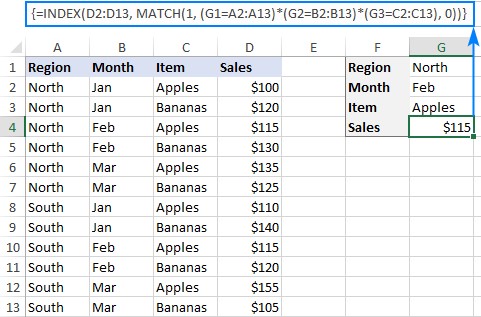
40. INDEX MATCH
An index match function is an exceptional option for the VLOOKUP or HLOOKUP formula that has some disadvantages for implementing lookup jobs. The INDEX MATCH is a sequencing method with 2 distinct functions. For instance, when you are viewing and giving someone’s height based on their identity or name, you can apply this function to switch both the variables applying the INDEX MATCH.
For example, here we want to get the sales amount for a specific item in a particular area and month. The function is a high-level version and gives the output, a match based on a particular pattern. To assess various measures, we apply the multiplication process that serves as the AND operator.
About the Author

ByteScout Team of Writers
ByteScout has a team of professional writers proficient in different technical topics. We select the best writers to cover interesting and trending topics for our readers. We love developers and we hope our articles help you learn about programming and programmers.
Microsoft Excel — программа, позволяющая работать с электронными таблицами. Можно собирать, преобразовывать и анализировать данные, проводить визуализацию информации, автоматизировать вычисления и выполнять еще ряд полезных и необходимых в работе задач.
Изучение возможностей Excel может быть полезно в рамках практически любой профессии и сферы деятельности, от работников продаж до бухгалтеров и экономистов.
Возможности Microsoft Excel
Работа с формулами и числовыми данными
Excel может выполнять практически всё: от простых операций вроде сложения, вычитания, умножения и деления до составления бюджетов крупных компаний.
Работа с текстом
Несмотря на то что некоторые возможности Word в Excel неприменимы, программа очень часто является базовой для составления отчетов.
Организация баз данных
Excel — табличный редактор, поэтому систематизация больших архивов не является для него проблемой. Кроме того, благодаря перекрестным ссылкам можно связать между собой различные листы и книги.
Построение графиков и диаграмм
Для создания отчетов очень часто требуется их визуальное представление. В современных версиях Excel можно создать диаграммы и графики любого типа, настроив их по своему усмотрению.
Создание рисунков
С помощью настройки графических объектов, встроенных в программу, можно создавать двухмерные и трехмерные рисунки.
Автоматизация стандартных задач
Excel обладает функцией записи макросов, которые облегчают работу с однотипными действиями. Под любой макрос можно создать отдельную кнопку на рабочей панели или установить сочетание горячих клавиш.
Импорт и экспорт данных
Для создания масштабных отчетов можно загружать данные различных типов со сторонних ресурсов.
Собственный язык программирования
Язык программирования Visual Basic позволяет сделать работу в программе максимально удобной. Большое количество встроенных функций помогают сделать таблицы интерактивными, что упрощает восприятие.
Интерфейс Excel
В настоящий момент самой современной, 16-й версией программы является Excel 2019. Обновления, появляющиеся с каждой новой версией, касаются прежде всего новых формул и функций. Начальный рабочий стол с версии 2007 года претерпел мало изменений.
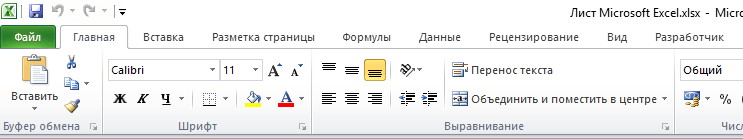
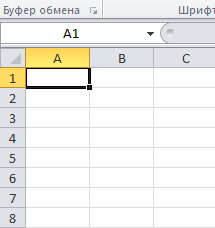
По умолчанию в каждой книге присутствует один лист (в ранних версиях — три листа). Количество листов, которые можно создавать в одной книге, ограничено только возможностями оперативной памяти компьютера. Поле Excel представляет собой таблицу из ячеек. Каждая ячейка имеет свой уникальный адрес, образованный пересечением строк и столбцов. Всего в Excel 1 048 576 строк и 16 384 столбца, что дает 2 147 483 648 ячеек. Над полем с ячейками находится строка функций, в которой отображаются данные, внесенные в ячейки или формулы. Также в программе есть несколько вкладок, которые мы разберем подробнее.
«Файл». С помощью этой вкладки можно отправить документы на печать, установить параметры работы в программе и сделать другие базовые настройки.
«Главная». Здесь располагается основной набор функций: возможность смены параметров шрифта, сортировка данных, простейшие формулы и правила условного форматирования.
«Вставка». Вкладка предназначена для добавления графических элементов на лист. Пользователь может как добавить обычные рисунки и фотографии, так и создать 2D- и 3D-объекты через конструктор. Кроме того, один из самых важных разделов программы — графики и диаграммы — также находится здесь.
«Разметка страницы». Здесь пользователь может менять формат итогового файла, работать с темой и подложкой.
«Формулы». Все формулы и функции, с которыми пользователь может работать в программе, собраны в этой вкладке и рассортированы по соответствующим разделам.
«Данные». Вкладка помогает с фильтрацией текстовых и числовых значений в таблицах, позволяет импортировать данные из других источников.
«Рецензирование». Здесь можно оставлять примечания к ячейкам, а также устанавливать защиту листа и всей книги.
«Вид». На этой вкладке можно добавлять или убирать сетку таблицы, масштабировать значения, закреплять группы данных в таблицах.
«Разработчик». Дополнительная вкладка, которая не включена по умолчанию. Позволяет работать с Visual Basic, создавать новые макросы и запускать уже имеющиеся.
Форматы файлов
Для Excel существует несколько форматов готовых файлов, которые определяют возможности книги:
- .xlsx — стандартная рабочая книга. Пришла на смену бинарному формату .xls с версии 2007 года;
- .xlsm — рабочая книга, позволяющая работать с макросами;
- .xlsb — рабочая книга, использующая бинарный формат, но одновременно и поддерживающая макросы. Обычно используется при работе с большими таблицами;
- .xltm — шаблон-основа для рабочих книг. Имеется поддержка макросов;
- .xlam — надстройка, созданная для добавления дополнительного функционала.
Нужно учитывать, что некоторые формулы и функции из новых версий могут не работать в старых.
Стандартные операции с ячейками
Активной считается ячейка, которая имеет черную рамку выделения с квадратом в правом нижнем углу. Чтобы вносить данные в ячейку, не обязательно делать по ней дополнительные клики мышью. Вносить данные можно как непосредственно в ячейку, так и через строку формул. При перемещении курсора с помощью клавиш-стрелок активной становится соседняя ячейка, текст в предыдущей сохраняется. Чтобы изменить уже имеющийся текст, необходимо дважды кликнуть по ячейке или внести правки через строку формул.
При двойном клике по черному квадрату в правом нижнем углу текстовые данные протянутся до нижнего края созданной таблицы. Если выделить диапазон с последовательными значениями (числа, даты, дни недели), они автоматически пересчитаются в сторону увеличения, заполнив столбец до нижнего края таблицы. Те же операции можно проделать и вручную, протянув за квадрат в нижнем правом углу. В этом случае пользователь самостоятельно определяет границы заполнения.
Чтобы выделить несколько ячеек одновременно, нужно зажать клавишу Ctrl и выбрать нужные ячейки или диапазоны ячеек. Ту же самую операцию можно проделать со строками и столбцами, выделяя необходимое их количество.
Excel автоматически суммирует значения в ячейках, показывая результат в правом нижнем углу листа. Также пользователю предлагаются средние значения данных и общее количество заполненных ячеек.
Ширину столбцов и высоту строк можно менять как вручную, передвигая край столбца/строки, так и нажав правую клавишу мыши и выбрав меню «Ширина столбца (высота строки)». По умолчанию значение ширины указывает на количество символов текущего размера шрифта, которые могут разместиться в ячейке, а значение высоты — на максимально возможный размер шрифта для этой строки.
Ячейки можно объединять с помощью соответствующего меню на вкладке «Главная». Всего существует три варианта объединения:
- объединить и поместить в центре;
- объединить по строкам;
- объединить ячейки.
Следует помнить, что при объединении может нарушаться сортировка данных в таблицах, а также могут некорректно считаться формулы.
Работа с формулами Excel
Главная функция программы — возможность подсчета значений с помощью встроенных формул и функций. Среди них есть простые, позволяющие подсчитать сумму в диапазоне, среднее значение в диапазоне, количество заполненных ячеек и т.д. Есть и более сложные, способные вычислять количество дней между разными датами (в т.ч. рабочих), максимальные и минимальные значения в диапазоне. Работа с функциями и формулами также напрямую зависит от формата ячеек. По умолчанию для всех ячеек установлен общий формат, позволяющий работать как с числовыми, так и с текстовыми данными. Но для более сложной работы он может быть заменен на числовой, процентный, дату, денежный, финансовый, дробный и т.д.
Формула вводится либо через строку функций над таблицей, либо в самой ячейке при двойном клике. В начале функции обязательно должен стоять знак «=». После этого при вводе названия функции появляется помощник, который предлагает выбрать функции из списка. Разберем это на примере формулы средней сложности «СЧЕТЕСЛИ».
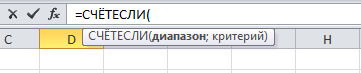
В скобках после функции будут прописаны условия, по которым формула будет проводить вычислениях. Подсказка указывает на то, что потребуется задать диапазон вычислений и критерий, по которому они будут производиться.
Например, нам необходимо подсчитать количество букв «А» в указанном диапазоне:
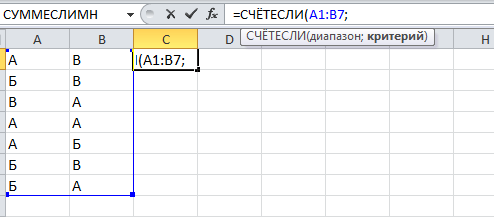
Выделяем диапазон, отмечаем первое условие с помощью знака «;»
Далее выделяем критерий. Его можно прописать вручную, заключив в кавычки; можно выделить ячейку, в которой этот критерий прописан.
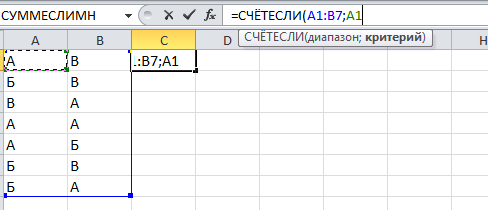
Закрываем скобку, потому что все условия указаны, и нажимаем Enter.
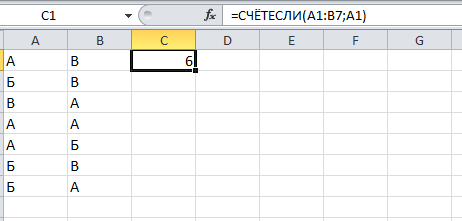
В ячейке C1 получаем ответ: в шести ячейках нашей таблицы написана буква «А».
В случае ошибки в формулах в ячейке будет прописано «#ДЕЛ/0!». В этом случае необходимо перепроверить формулу на предмет неточностей и на корректность.
Excel может проводить вычисления не только на активном листе. Для этого при вводе формулы через строку функций нужно перейти на нужный лист и указать ячейку, с которой нужно провести расчет. При протягивании формул автоматически подтянутся и адреса всех ячеек. Чтобы этого не произошло и формулы были подсчитаны корректно, можно закрепить нужную ячейку, выделив ее адрес и нажав клавишу F4. Формат адреса будет выглядеть так: $A$1.
Excel 2021 for Windows allows you to collaboratively work with others and analyze data easily with new Excel capabilities including co-authoring, Dynamic Arrays, XLOOKUP, and LET functions.
Note: Some features listed below are not included in Excel LTSC 2021 for commercial customers. Each of those features is noted if it does not apply to Excel LTSC 2021 for commercial customers.
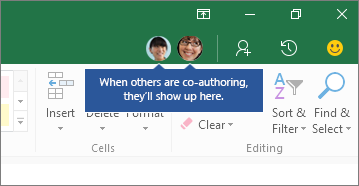
Co-authoring
You and your colleagues can open and work on the same Excel workbook. This is called co-authoring. When you co-author, you can see each other’s changes quickly — in a matter of seconds.
LEARN MORE
Note: Co-authoring is not available in Excel LTSC 2021.

Better collaboration with modern comments
Have control of when you send comments to your co-authors and be productive with a consistent commenting experience in your workbooks and other Office apps.
LEARN MORE
Note: Modern comments is not available in Excel LTSC 2021.
Know who’s in your workbook
See who else is working along with you and where they are in the workbook.
Note: This feature is not available in Excel LTSC 2021.
Visual refresh
Work with a modernized Start experience and newly refreshed tabs in the ribbon. Experience a clean, clear style with monoline iconography, neutral color palette, and softer window corners. These updates communicate action and provide features with simple visuals.
Note: Visual refresh is not available in Excel LTSC 2021.

Look left, look right… XLOOKUP is here!
Row by row, find anything you need in a table or range with XLOOKUP.
Return exact matches by default—there’s no need to specify.
LEARN MORE
LET function
The LET function assigns names to calculation results. This allows storing intermediate calculations, values, or defining names inside a formula. These names only apply within the scope of the LET function.
Similar to variables in programming, LET is accomplished through Excel’s native formula syntax.
LEARN MORE
Dynamic arrays

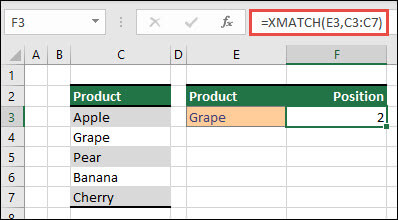
XMATCH function
The XMATCH function searches for a specified item in an array or range of cells, and then returns the item’s relative position.
You can also use XMATCH to return a value in an array.
LEARN MORE
Sheet views
Create customized views in an Excel worksheet without disrupting others.
LEARN MORE
Note: Sheet views are not available in Excel LTSC 2021.

A new way to reach the Accessibility tools
The Accessibility ribbon puts all the tools you need to create accessible content in one place.
LEARN MORE
Note: The Accessibility ribbon is not available in Excel LTSC 2021.

Increase the reach of your content
Accessibility Checker keeps an eye on your documents and tells you in the status bar when it finds something you should look at. Try it by clicking Review > Check Accessibility.

Performance improvements
Experience improved performance, stability, and speed across Excel.
Get faster calculations from common Excel functions like SUMIF, COUNTIF, and AVERAGEIF.
Unhide many sheets at the same time
No need to unhide one sheet at a time anymore—unhide multiple hidden sheets at once.
LEARN MORE

See what’s new in stock media
We’re constantly adding more rich media content to the Office Premium Creative Content collection that helps you express yourself, such as a curated library of stock images, icons, and more.
LEARN MORE
Find what you need with Microsoft Search
At the top of your Microsoft Office apps on Windows, you’ll find the new Microsoft Search box. This powerful tool helps you quickly find what you’re looking for, such as text, commands, help, and more.
LEARN MORE
Save your changes as they happen
Upload your files to OneDrive, OneDrive for Business, or SharePoint Online to make sure all your updates are saved automatically.
LEARN MORE
Note: AutoSave is not available in Excel LTSC 2021.
Support for OpenDocument format (ODF) 1.3
We now include support for the OpenDocument format (ODF) 1.3. The ODF 1.3 specification adds support for many new features.
LEARN MORE
Updated Draw tab
Quickly access and change the color of all your inking tools, all in one place.
Simplify how you work with ink using new Draw tab additions: Point Eraser, Ruler, and Lasso.
LEARN MORE
Get a quick summary of what’s in your workbook
Wondering how big your worksheet or workbook is getting? Excel provides workbook statistics to help you.
LEARN MORE
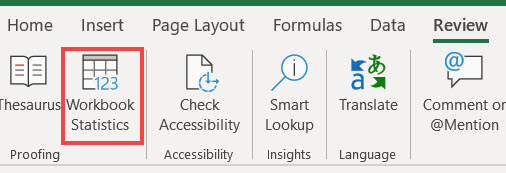
Pick the perfect color
Based on your feedback, we’ve added a new input field in the Colors dialog for Hex color values. No need to convert Hex color values into RGB values.
For any property where you can define a color, you can now enter a Hex color value in the Hex box, for example, #0F4C81 or 444.
Try the Sketched style outline
You can give a casual, hand-drawn look to shapes in your workbook with the Sketched style outline.
Try out the Curved, Freehand, or Scribble options under Format Shape > Line > Sketched style.
LEARN MORE