
When people save data in the JSON or CSV format, they’re intending for that data to be accessed programmatically. But much of the world’s data is stored in spreadsheet files, and many of those files are in the Excel format. Excel is used because people can manipulate it easily, and it’s a powerful tool in its own right. However, there is a lot of automation that can be done by extracting data from a spreadsheet, and this process also allows you to bring data from multiple kinds of sources into one program.
We’ll first take a quick look at how to save an Excel file as a CSV file. This is sometimes the quickest and easiest way to extract data. But it’s a manual process, so you’d have to open the file in Excel and save it as a CSV again every time the file is updated. It’s much better in many situations to just extract the data from Excel directly.
The example we’ll use is the data you can download from Mapping Police Violence. If you can’t download this file from the site for some reason, you can also find a snapshot of this spreadsheet from 6/19/20 in the beyond_pcc/social_justice_datasets/ directory of the online resources for Python Crash Course.
- Converting an Excel File to CSV
- Installing openpyxl
- Opening an Excel File
- Accessing Data in a Worksheet
- Accessing Data from Cells
- Extracting Data from Specific Cells
- Refactoring
- Further Reading
Converting an Excel File to CSV
You can create a CSV file from any single worksheet in an Excel workbook. To do this, first click on the tab for the worksheet you want to focus on. Then choose File > Save As, and in the File Format dropdown choose CSV UTF-8 (Comma-delimited) (.csv). You’ll get a message that the entire workbook can’t be saved in this format, but if you click OK you’ll get a copy of the current worksheet in CSV format.
To look at the file and make sure it contains the data you expect it to, locate the new CSV file in a file browser and open it with a text editor. If you open the file with a spreadsheet application like Excel, it won’t look any different than a regular Excel file.
top
Installing openpyxl
We’ll be using the openpyxl library to access the data in an Excel file. You can install this library with pip:
$ pip install --user openpyxl
top
Opening an Excel File
To follow along with this tutorial, make a folder somewhere on your system called extracting_from_excel. Make a data folder inside this directory; it’s a good idea to keep your data files in their own directory. I saved the file mapping_police_violence_snapshot_061920.xlsx in my data directory; you can work with this file, or any .xls or .xlsx file you’re interested in.
The following code will open the Excel file and print the names of all worksheets in the file:
from openpyxl import load_workbook

data_file = 'data/mapping_police_violence_snapshot_061920.xlsx'

# Load the entire workbook.
wb = load_workbook(data_file)

# List all the sheets in the file.
print("Found the following worksheets:")
for sheetname in wb.sheetnames:
    print(sheetname)
First we import the load_workbook() function, and assign the path to the data file to data_file. Then we call load_workbook() with the correct path, and assign the returned object, representing the entire workbook, to wb. You’ll see this convention in the documentation for openpyxl.
The names of all worksheets in the file are stored in the sheetnames attribute. Here’s the output for this data file:
Found the following worksheets:
2013-2019 Police Killings
2013-2019 Killings by PD
2013-2019 Killings by State
Police Killings of Black Men
top
Accessing Data in a Worksheet
We want to access the actual data in a specific worksheet. To do this we grab the worksheet we’re interested in, and then extract the data from all rows in the worksheet:
from openpyxl import load_workbook

data_file = 'data/mapping_police_violence_snapshot_061920.xlsx'

# Load the entire workbook.
wb = load_workbook(data_file)

# Load one worksheet.
ws = wb['2013-2019 Killings by State']
all_rows = list(ws.rows)

print(f"Found {len(all_rows)} rows of data.")

print("nFirst rows of data:")
for row in all_rows[:5]:
    print(row)
Worksheets are accessed by name through the workbook object. Here we assign a worksheet to ws. Once you have a worksheet object, you can access all the rows through the ws.rows attribute. This attribute is a generator, a Python object that efficiently returns one item at a time from a collection. We can convert this to the more familar list using the list() function. Here we create a list of all the rows in the workbook. We then print a message about how many rows were found, and print the first few rows of data:
Found 55 rows of data.

First rows of data:
(<Cell '2013-2019 Killings by State'.A1>, <Cell...
(<Cell '2013-2019 Killings by State'.A2>, <Cell...
(<Cell '2013-2019 Killings by State'.A3>, <Cell...
In this worksheet, we found 55 rows of data. Each row of data is made up of a series of cell objects.
top
Accessing Data from Cells
So far we have accessed the Excel file, an individual worksheet, and a series of rows. Now we can access the actual data in the cells.
To begin with, we’ll look at just the data in the first row:
from openpyxl import load_workbook

data_file = 'data/mapping_police_violence_snapshot_061920.xlsx'

# Load the entire workbook.
wb = load_workbook(data_file)

# Load one worksheet.
ws = wb['2013-2019 Killings by State']
all_rows = list(ws.rows)

for cell in all_rows[0]:
    print(cell.value)
We loop through all cells in the row, and print the value of each cell. This is accessed through the value attribute of the cell object.
State
Population
African-American Alone
% African-American
% Victims Black
Disparity
--snip--
top
The previous example is helpful, perhaps, when looking at a list of headings for a worksheet over a remote connection. But usually when we’re analyzing the data from a spreadsheet we can just open the file in Excel, look for the information we want, and then write code to extract that information. We usually aren’t interested in every single cell in a row, though. We’re often interested in selected cells in every row in the sheet.
The following example pulls data from three specific columns in each row in the file containing the data we’re interested in:
from openpyxl import load_workbook

data_file = 'data/mapping_police_violence_snapshot_061920.xlsx'

# Load the entire workbook.
wb = load_workbook(data_file)

# Load one worksheet.
ws = wb['2013-2019 Killings by State']
all_rows = list(ws.rows)

# Pull information from specific cells.
for row in all_rows[1:52]:
    state = row[0].value
    percent_aa = row[3].value
    percent_aa_victims = row[4].value

    print(f"{state}")
    print(f" {percent_aa}% of residents are African American")
        print(f" {percent_aa_victims}% killed by police were African American")
Here we loop through the all of the rows that contain the states’ data. For each row, we pull the values at index 0, 3, and 4, and assign each of these to an appropriate variable name. We then print a statement summarizing what these values mean.
The output isn’t quite what we expect:
Alabama
 =C2/B2% of residents are African American
 =G2/N2% killed by police were African American

Alaska
 =C3/B3% of residents are African American
 =G3/N3% killed by police were African American

Arizona
 =C4/B4% of residents are African American
 =G4/N4% killed by police were African American

--snip--
The values in these cells are actually formulas. If we want the values computed from these formulas, we need to pass the data_only=True flag when we load the workbook:
from openpyxl import load_workbook

data_file = 'data/mapping_police_violence_snapshot_061920.xlsx'

# Load the entire workbook.
wb = load_workbook(data_file, data_only=True)

# Load one worksheet.
ws = wb['2013-2019 Killings by State']
all_rows = list(ws.rows)

# Pull information from specific cells.
for row in all_rows[1:52]:
    state = row[0].value
    percent_aa = row[3].value
    percent_aa_victims = row[4].value

    print(f"n{state}")
    print(f" {percent_aa}% of residents are African American")
    print(f" {percent_aa_victims}% killed by police were African American")
Now we see output that’s much more like what we were expecting:
Alabama
 0.2617950029039261% of residents are African American
 0.37681159420289856% killed by police were African American

Alaska
 0.032754132106314705% of residents are African American
 0.12195121951219512% killed by police were African American

Arizona
 0.04052054304611518% of residents are African American
 0.09037900874635568% killed by police were African American

--snip--
Data analysis almost always involves some degree of reformatting. For this output, we’ll round the percentages to two decimal places, and turn them into neatly-formatted integers for display:
# Pull information from specific cells.
for row in all_rows[1:52]:
    state = row[0].value
    percent_aa = int(round(row[3].value, 2) * 100)
    percent_aa_victims = int(round(row[4].value, 2) * 100)
Here’s the cleaner output:
Alabama
 26% of residents are African American
 38% killed by police were African American

Alaska
 3% of residents are African American
 12% killed by police were African American

Arizona
 4% of residents are African American
 9% killed by police were African American

--snip--
Be careful about rounding data during the processing phase. If you were going to pass this data to a plotting library, you probably want to do the rounding in the plotting code. This can affect your visualization. For example if two percentages round to the same value in two decimal places but they’re different in the third decimal place, you’ll lose the ability to sort items precisely. In this situation, it’s important to ask whether the third decimal place is meaningful or not.
Also, note that you will often need to identify the specific rows that need to be looped over. Spreadsheets are nice and structured, but people are also free to write anything they want in any cell. Many spreadsheets have some notes in a few cells after all the rows of data. These can be notes about sources of the raw data, dates of data collection, authors, and more. You will probably need to exclude these rows, either by looping over a slice as shown here, or using a try/except block to only extract data if the operation for each row is successful.
Finally, you should be aware that people can modify the hard-coded values in a spreadsheet without updating the values derived from formulas that use those values. If you have any doubt about whether the spreadhseet you’re working from has been updated, you should re-run the formulas yourself before using the data_only=True flag when loading a workbook.
top
Refactoring
That’s probably enough to get you started working with data that’s stored in Excel files, but it’s worth showing a bit of refactoring on the program we’ve been using in this tutorial. Here’s what the code looks like at this point:
from openpyxl import load_workbook

data_file = 'data/mapping_police_violence_snapshot_061920.xlsx'

# Load the entire workbook.
wb = load_workbook(data_file, data_only=True)

# Load one worksheet.
ws = wb['2013-2019 Killings by State']
all_rows = list(ws.rows)

# Pull information from specific cells.
for row in all_rows[1:5]:
    state = row[0].value
    percent_aa = int(round(row[3].value, 2) * 100)
    percent_aa_victims = int(round(row[4].value, 2) * 100)

    print(f"n{state}")
    print(f" {percent_aa}% of residents are African American")
    print(f" {percent_aa_victims}% killed by police were African American")
If all we wanted to do was generate a text summary of this data, this code would probably be fine. But we’re probably going to do some visualization work, and maybe we want to bring in some additional data from another file. If we’re going to do anything further, it’s worth breaking this into a couple functions. Here’s how we might organize this code:
from openpyxl import load_workbook


def get_all_rows(data_file, worksheet_name):
    """Get all rows from the given workbook and worksheet."""
    # Load the entire workbook.
    wb = load_workbook(data_file, data_only=True)

    # Load one worksheet.
    ws = wb[worksheet_name]
    all_rows = list(ws.rows)

    return all_rows

def summarize_data(all_rows):
    """Summarize demographic data for police killings of African Americans,
    for each state in the dataset.
    """

    for row in all_rows[1:5]:
        state = row[0].value
        percent_aa = int(round(row[3].value, 2) * 100)
        percent_aa_victims = int(round(row[4].value, 2) * 100)

        print(f"n{state}")
        print(f" {percent_aa}% of residents are African American")
        print(f" {percent_aa_victims}% killed by police were African American")


data_file = 'data/mapping_police_violence_snapshot_061920.xlsx'
data = get_all_rows(data_file, '2013-2019 Killings by State')
summarize_data(data)
We organize the code into two functions, one for retrieving data and one for summarizing data. The function get_all_rows() can be used to load all the rows from any worksheet in any data file. The function summarize_data() is specific to this context, and would probably have a more specific name in a more complete project.
top
Further Reading
There’s a lot more you can do with Excel files in your Python programs. For example, you can modify data in an existing Excel file, or you can extract the data you’re interested in and generate an entirely new Excel file. To learn more about these possibilities, see the openpyxl documentation. You can also extract the data from Excel and rewrite it in any other data format such as JSON or CSV.
top
Data Extraction In Excel vs. Modern Solutions
What Is Data Extraction?
What is data extraction? Data extraction is exactly what it sounds like—culling through your spreadsheet to pull out specific data for a new column or spreadsheet, following the standard data entry and scraping processes. For example, if you have a dataset around population density, you may want to extract cities with more than 10,000 people per sq. mile and only those that are in California so that you can analyze the demographic makeup of those cities. Sure, if you’re working with a small dataset, you might be able to get by with copy/paste, but extracting data by hand can quickly become overwhelming. Data extraction is most efficient when you’re able to define the data you need, but use efficient, machine learning software to retrieve it.
It’s no surprise that many businesses use Excel as a data extraction tool to extract data. In order to extract data from Excel columns, you can use some combination of the VLOOKUP, MATCH, and INDEX functions. The VLOOKUP function is perhaps best equipped for data extraction, allowing you to look up and retrieve data from a specific column. The MATCH and INDEX function work somewhat inversely; MATCH finds the position of a given value, while INDEX retrieves the value from a known position. All three are helpful to know (and relatively easy to learn) in order to extract data from Excel. But is Excel the best system for extracting data in the modern landscape?
For simple, structured data, extracting data in Excel is fairly straightforward. However, as the scale and complexity of modern data grows, data extraction in Excel is becoming more challenging for users. Extensive, complicated, and unstructured data can make extracting data time consuming and challenging. Say, for example, you want to extract and analyze specific words from a series of tweets. That means you’re working with JSON data, and in order to extract data from Excel, you’ll first need to unnest it and then proceed with the steps involved in extracting data. Excel wasn’t built for JSON data or most complex data types and systems, which means data extraction not only becomes a more demanding process but a significantly longer one, too. Companies are turning to data extraction tools to combat many of these challenges. When a business needs multiple tools for every piece of the data preparation process, most management teams want another solution. But are there other solutions?
To more efficiently extract data with complex data types—as well as to complete other data preparation tasks—many analysts are adopting data preparation platforms. Data preparation platforms were built to handle data of any type and any size to accelerate the painstaking process of preparing data for analysis. Designer Cloud, routinely named the leader in data preparation by analysts and its extensive customer base alike, also uses machine learning to further accelerate the data preparation process, predicting a user’s next steps with his or her every interaction. Add in its visual nature, and the overall result is a data preparation experience that is interactive, intelligent, and encourages experimentation with data extraction and other data preparation tasks alike. Unlike other data extraction tools, Trifacta comes with many other data prep capabilities that prepares data for analysis.
3 Primary Ways of Data Extraction
Notification
The easiest way for data extraction is to allow for a system notification when a record has been changed. Most platforms offer a notification mechanism or similar functions so they can support data replication.
Incremental Data Extraction
Systems that are unable to provide alerts when an update has occurred, can typically still provide an update as to which data was modified and provide data extraction from that. The one downfall to incremental data extraction is that it is unable to provide an update to deleted data since it no longer exists.
Full Data Extraction
Some platforms have no way to identify if any data has changed. In this instance, it calls for a full data extraction. This is helpful if you have to replicate whole data tables, however, full data extraction involves high data transfer volumes which can put a hold on your network. Use at your own risk.
Data Extraction in Designer Cloud
To perform data extraction in Designer Cloud, start with the “Extract” transform. This will allow you to specify the column in your dataset that contains the pattern that you want to extract, as well as tailor your transform to fit your desired extraction process.
Beyond data extraction tools, Designer Cloud has a lot to offer, including countless data preparation capabilities and a unique, guided experience that reduces the overall time of preparing data by end up to 90%. Our tool performs more than extracting data and can save valuable time and expenses. We’d love to chat with you about your data preparation and integration needs and how you can perform data extraction in Designer Cloud. Contact us for more information. Or, try it out for yourself by signing up for the free Designer Cloud trial here.
When you need to find and extract a column of data from one table and place it in another, use the VLOOKUP function. This function works in any version of Excel in Windows and Mac, and also in Google Sheets. It allows you to find data in one table using some identifier it has in common with another table. The two tables can be on different sheets or even on different workbooks. There is also an HLOOKUP function, which does the same thing, but with data arranged horizontally, across rows.
The MATCH and INDEX functions are good to use when you’re concerned with the location of specific data, such as the column or row that contains a person’s name.
Premium Options
Before we get into the Excel functions, did you know that Envato Market has a range of Excel scripts and plugins that let you perform advanced functions?


Screencast
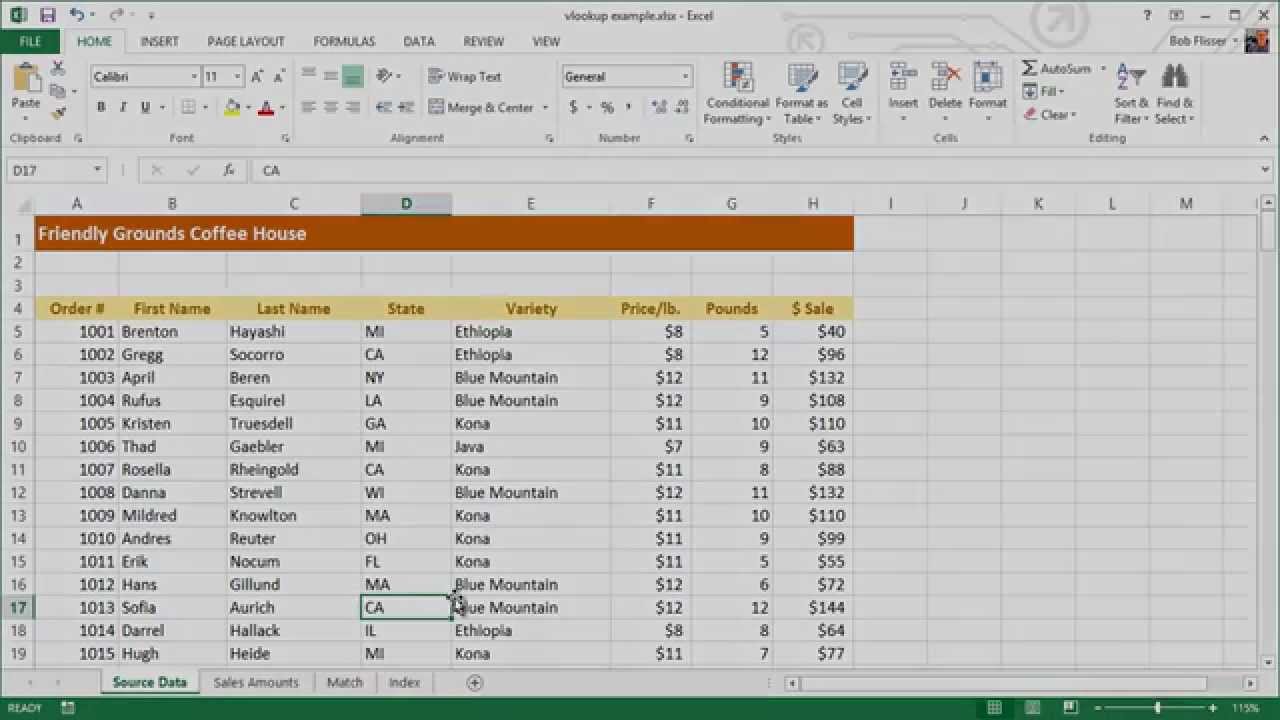
If you want to follow along with this tutorial using your own Excel file, you can do so. Or if you prefer, download the zip file included for this tutorial, which contains a sample workbook called vlookup example.xlsx.
Using VLOOKUP
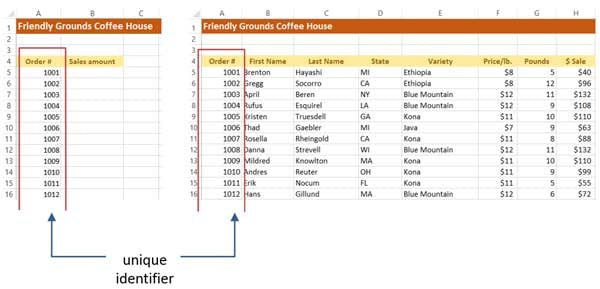
When VLOOKUP finds the identifier that you specify in the source data, it can then find any cell in that row and return the information to you. Note that in the source data, the identifier must be in the first column of the table.

Syntax
The syntax of the VLOOKUP function is:
=VLOOKUP(lookup value, table range, column number, [true/false])
Here’s what these arguments mean:
- Lookup value. The cell that has the unique identifier.
- Table range. The range of cells that has the identifier in the first column, followed by the rest of the data in the other columns.
- Column number. The number of the column that has the data you’re looking for. Don’t get that confused with the column’s letter. In the above illustration, the states are in column 4.
- True/False. This argument is optional. True means that an approximate match is acceptable, and False means that only an exact match is acceptable.
We want to find sales amounts from the table in the illustration above, so we use these arguments:


Define a Range Name to Create an Absolute Reference
In Vlookup example.xlsx, look at the Sales Amounts worksheet. We’ll enter the formula in B5, then use the AutoFill feature to copy the formula down the sheet. That means the table range in the formula has to be an absolute reference. A good way to do that is to define a name for the table range.
Defining a Range Name in Excel
- Before entering the formula, go to the source data worksheet.
- Select all the cells from A4 (header for the Order # column) down through H203. A quick way of doing it is to click A4, then press Ctrl-Shift-End (Command-Shift-End on the Mac).
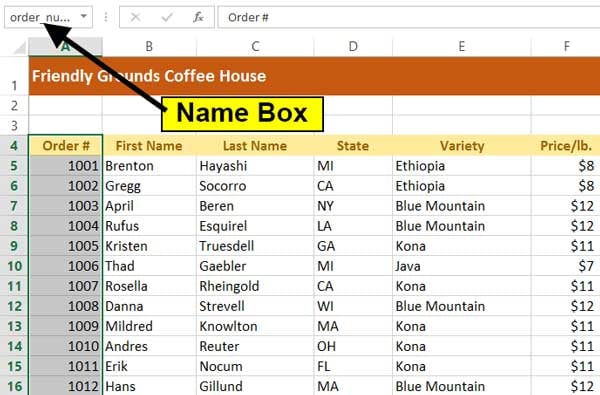
- Click inside the Name Box above column A (the Name Box now displays A4).
- Type data, then press Enter.
- You can now use the name data in the formula instead of $A$4:$H$203.


Defining a Range name in Google Sheets
In Google Sheets, defining a name is a little different.
- Click the first column header of your source data, then press Ctrl-Shift-Right Arrow (Command-Shift-Right Arrow on the Mac). That selects the row of column headers.
- Press Ctrl-Shift-Down Arrow (Command-Shift-Down Arrow on the Mac). That selects the actual data.
- Click the Data menu, then select Named and protected ranges.
- In the Name and protected ranges box on the right, type data, then click Done.


Entering the Formula
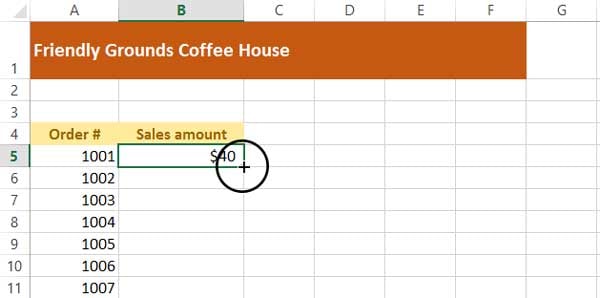
To enter the formula, go to the Sales Amounts worksheet and click in B5.
Enter the formula:
=VLOOKUP(A5,data,8,FALSE)
Press Enter.


The result should be 40. To fill in the values down the column, click back on B5, if necessary. Put the mouse pointer on the AutoFill dot in the cell’s lower-right corner, so the mouse pointer becomes a cross hair.

Double-click to fill the values down the column.


If you want, you can run the VLOOKUP function in the next few columns to extract other fields, like last name or state.
Using MATCH
The MATCH function is doesn’t return the value of data to you; you provide the value that you’re looking for, and the function returns the position of that value. It’s like asking where is #135 Main Street, and getting the answer that it’s the 4th building down the street.
Syntax
The syntax of the MATCH function is:
=MATCH(lookup value, table range, [match type])
The arguments are:
- Lookup value. The cell that has the unique identifier.
- Table range. The range of cells you’re searching.
- Match type. Optional. It’s how you specify how close of a match you want, as follows:
|
Next highest value |
-1 |
Values must be in descending order. |
|
Target value |
0 |
Values can be in any order. |
|
Next lowest value |
1 |
Default type. Values must be in ascending order. |
As with the VLOOKUP function, you’ll probably find the MATCH function easier to use if you apply a range name. Go to the Source Data sheet, select from B4 (column header for order #) to the bottom, click in the Name box above column A, and call it order_number. Note that the values are in ascending order.

Go to the Match tab of the worksheet. In B5, enter the MATCH function:
=MATCH(A5,order_number,1)


If you didn’t define a range name, you’d write the function as:
=MATCH(A5,'Source

Data'!A5:A203,0)
Either way, you can see that this is in the 14th position (making it the 13th order).


Using INDEX
The INDEX function is the opposite of the MATCH function and is similar to VLOOKUP. You tell the function what row and column of the data you want, and it tells you the value of what’s in the cell.
Syntax
The syntax of the INDEX function is:
=INDEX(data range, row number, [column number])
The arguments are:
- Data range. Just like the other two functions, this is the table of data.
- Row number. The row number of the data, which is not necessarily the row of the worksheet. If the table range starts on row 10 of the sheet, then that’s row #1.
- Column number. The column number of the data range. If the range starts on column E, that’s column #1.
Excel’s documentation will tell you that the column number argument is optional, but the row number is sort of optional, too. If the table range has only one row or one column, you don’t have to use the other argument.
Go to the Index sheet of the workbook and click in C6. We first want to find what’s contained in row 9, column 3 of the table. In the formula, we’ll use the range name that we created earlier.
Enter the formula:
=INDEX(data,A6,B6)


It returns a customer’s last name: Strevell. Change the values of A6 and B6, and the result in C6 will show different results (note that many rows have the same states and product names).
Conclusion
The ability of a worksheet to look at another worksheet and extract data is a great tool. This way, you can have one sheet that contains all the data you need for many purposes, then extract what you need for specific instances.
Excel spreadsheets can contain many types of data, including text, calculations and charts. If you need to use any of this information in your business’ Word documents, there are different methods you can use to extract it from an existing worksheet. You can copy and paste objects to link or embed data from a worksheet or you can merge data from an Excel table into a Word form. The method you choose depends on your desired outcome.
Link or Embed Data
-
Open the Excel worksheet from which you want to extract data as well as the Word document into which you want to insert or embed the data.
-
Select the chart, range or other data in Excel that you want to use in Word. Press «Ctrl-C» or click on «Copy» in the Clipboard group of the Home tab.
-
Go to the Word document. Click the «Paste» drop-down arrow in the Clipboard group of the Home tab and select «Paste Special.»
-
Choose «Paste» and select «Microsoft Office Excel Chart Object» to embed the data. Choose «Paste Link» and select «Microsoft Office Excel Chart Object» to link the data.
-
Click «OK» to insert the extracted data from Excel.
Merge Data
-
Open a blank document in Word. Go to the «Mailings» tab, click on «Start Mail Merge» and select «Step by Step Mail Merge Wizard.» Select «Letters» under Document Type and click «Next.»
-
Choose which document you want to use as the form into which you extract Excel data, such as the current blank document or a template. Click «Next.»
-
Select «Use an Existing List» under Select Recipients and click the «Browse» button. Navigate to the Excel file from which you want to extract data and click «Open.» Choose the specific table or sheet you want to use and click «OK.» Sort or filter the data if required and click «OK.»
-
Click «Next.» Choose the fields you want to merge into the document and click the «Match Fields» button to match the fields in the document with the columns in your spreadsheet.
-
Click «Next» to preview the merge. Edit the document if necessary and then click «Next» again to complete the merge.
You can use pyexcelerator in python.
This code (included in the examples folder of pyexcelerator as xls2csv.py) extracts all sheets from the spreadsheets and outputs them to stdout as CSV.
You can easily change the code to do what you want.
The cool thing about pyexcelerator is that you can also use it to write/create excel xls files, without having excel installed.
#!/usr/bin/env python
# -*- coding: windows-1251 -*-
# Copyright (C) 2005 Kiseliov Roman

__rev_id__ = """$Id: xls2csv.py,v 1.1 2005/05/19 09:27:42 rvk Exp $"""


from pyExcelerator import *
import sys

me, args = sys.argv[0], sys.argv[1:]


if args:
    for arg in args:
        print >>sys.stderr, 'extracting data from', arg
        for sheet_name, values in parse_xls(arg, 'cp1251'): # parse_xls(arg) -- default encoding
            matrix = [[]]
            print 'Sheet = "%s"' % sheet_name.encode('cp866', 'backslashreplace')
            print '----------------'
            for row_idx, col_idx in sorted(values.keys()):
                v = values[(row_idx, col_idx)]
                if isinstance(v, unicode):
                    v = v.encode('cp866', 'backslashreplace')
                else:
                    v = str(v)
                last_row, last_col = len(matrix), len(matrix[-1])
                while last_row < row_idx:
                    matrix.extend([[]])
                    last_row = len(matrix)

                while last_col < col_idx:
                    matrix[-1].extend([''])
                    last_col = len(matrix[-1])

                matrix[-1].extend([v])

            for row in matrix:
                csv_row = ','.join(row)
                print csv_row

else:
    print 'usage: %s (inputfile)+' % me