
![]()

ExcellentExport.js
-
❤️ Sponsor ExcellentExport.js project❤️
-
JavaScript export to Excel or CSV.
-
A quick JavaScript library to create export to Excel/CSV from HTML tables in the browser. No server required.
-
As part of the new version 3.0.0+, there is support for XLSX. The drawback is that the library is 200+ KB.
-
Check My Blog Page for Testing :
JavaScript export to ExcelExcellentExport.js update: JavaScript export to Excel and CSV
Revision history:
3.9.3
- Fix TypeScript exported types
3.9.0
- Cell types and formats!!! Now you can define the cell type and format. For example, you can define a cell as a date or a number. You can also define the format of the cell. For example, you can define a cell as a date with the format «dd/mm/yyyy» or a number with the format «#,##0.00».
3.8.1
- Activate XLSX compression by default. The example of index.bigtable.html went from 18Mb to 3Mb.
- Update npm dependencies to fix vulnerabilities
- Update to latest version of TypeScript
- Reduced size of the library from 912 KB to 277 KB!!!
3.8.0
- Allow RTL options on the whole file or sheet.
- Update npm dependencies to fix vulnerabilities
3.7.3
- Fix (#591) remove columns parameter. Now it is not affected by repeated column numbers nor its order.
3.7.2
- Update npm dependencies to fix vulnerabilities
3.7.1
- Update npm dependencies to fix vulnerabilities
- Start using Dependabot and get rid of Dependabot-preview
3.7.0
- Added option
openAsDownload: boolean. Use this option to download as a file without using an anchor tag. So download can be triggered from a button. - Update npm dependencies to fix vulnerabilities
3.6.0
- Added sponsor link to the project ❤️ Sponsor ExcellentExport.js project❤️
- Transform the project from JavaScript to TypeScript
- Configure Jest as test runner
- Update npm dependencies to fix vulnerabilities
3.5.0
- Add fixValue and fixArray functions to configuration: these configuration functions can be used to manipulate the values of the cells.
- Update npm dependencies to fix vulnerabilities
3.4.3
- Update npm dependencies to fix vulnerabilities
3.4.2
- Remove ES6 function syntax to support IE11
- Update npm dependencies to fix vulnerabilities
3.4.0
- Configure TravisCI on GitHub
- Update npm dependencies to fix vulnerabilities
3.3.0
- Remove columns by index
- Filter rows by value
- Updated build to Webpack 4.x.x
3.2.1
- Update npm dependencies to fix vulnerabilities
3.2.0
- Update npm dependencies to fix vulnerabilities
3.1.0
- Fix old API for base64 and escaping problem.
3.0.0
- XLSX support. This bumps the build size to 640 KB.
- New API : ExcellentExport.convert(…)
- Autogenerate download filename.
- Data input from arrays or HTML Tables.
- Multiple sheets for XLS or XLSX formats.
2.1.0
- Add Webpack build.
- Create UMD JavaScript module. Library can be loaded as a module (import, RequireJS, AMD, etc…) or standalone as window.ExcelentExport.
2.0.3
- Fix export as a module.
- Changed minifier to UglifyJS.
2.0.2
- Fix CSV Chinese characters and other special characters display error in Windows Excel.
- Fix URL.createObjectURL(…) on Firefox.
2.0.0
- Now it can export to big files +2MB.
- Minimum IE 11.
- Links open with URL.createObjectURL(…).
- NPM package available.
- Using Semantic versioning (2.0.0 instead of 2.0).
- Module can be loaded standalone or with RequireJS.
- Change license to MIT.
1.5
- Possibility to select a CSV delimiter.
- Bower package available.
- Compose package available.
1.4
- Add LICENSE.txt with GPL v3
- UTF-8 characters fixed.
1.3
- Added minified version
1.1
- Added CSV data export
1.0
- Added Excel data export
Compatibility
- Firefox
- Chrome
- Internet Explorer 11+
Install
npm
npm install excellentexport --save
yarn
bower
bower install excellentexport
Load
Include script in your HTML:
<script type="text/javascript" src="dist/excellentexport.js"></script>
Include script in your HTML using CDN:
<script type="text/javascript" src="https://cdn.jsdelivr.net/npm/excellentexport@3.4.3/dist/excellentexport.min.js"></script>
Require.js
<script src="http://requirejs.org/docs/release/2.3.6/minified/require.js"></script>
<script>
    require(['dist/excellentexport'], function(ee) {
        window.ExcellentExport = ee;
    });
</script>
ES6 import
import ExcellentExport from 'excellentexport';
Usage
<table id="datatable">
    <tr>
        <td>100</td> <td>200</td> <td>300</td>
    </tr>
    <tr>
        <td>400</td> <td>500</td> <td>600</td>
    </tr>
</table>

<a download="somedata.xls" href="#" onclick="return ExcellentExport.excel(this, 'datatable', 'Sheet Name Here');">Export to Excel</a>
<a download="somedata.csv" href="#" onclick="return ExcellentExport.csv(this, 'datatable');">Export to CSV</a>
<!-- new API, xlsx -->
<a download="somedata.xlsx" href="#" onclick="return ExcellentExport.convert({ anchor: this, filename: 'data_123.array', format: 'xlsx'},[{name: 'Sheet Name Here 1', from: {table: 'datatable'}}]);">Export to CSV</a>
API
 ExcellentExport.convert(options, sheets);

 Options:
 {
    anchor: String or HTML Element,
    format: 'xlsx' or 'xls' or 'csv',
    filename: String,
    rtl: Use Right-to-left characters, boolean (optional)
 }

 Sheets must be an array of sheet configuration objects. Sheet description:
 [
    {
        name: 'Sheet 1', // Sheet name
        from: {
            table: String/Element, // Table ID or table element
            array: [...] // Array with the data. Array where each element is a row. Every row is an array of the cells.
        },
        removeColumns: [...], // Array of column indexes (from 0)
        filterRowFn: function(row) {return true}, // Function to decide which rows are returned
        fixValue: function(value, row, column) {return fixedValue} // Function to fix values, receiving value, row num, column num
        fixArray: function(array) {return array} // Function to manipulate the whole data array
        rtl: Use Right-to-left characters, boolean (optional)
        formats: [...] // Array of formats for each column. See formats below.
        ...
    },
    {
        ...
    }, ...
]
fixValue example
This is an example for the fixValue function to handle HTML tags inside a table cell.
It transforms BR to line breaks and then strips all the HTML tags.
            fixValue: (value, row, col) => {
                let v = value.replace(/<br>/gi, "n");
                let strippedString = v.replace(/(<([^>]+)>)/gi, "");
                return strippedString;
            }
Formats
You can specify an array with the formats for a specific cell range (i.e. A1:A100, A1:D100, A1:H1, etc).
Each element in the format array consists on:
{
    "range": "A1:A100", // Range of cells to apply the format, mandatory
    "format": {
        "type": "<cell_type>", // Type of format, mandatory
        "pattern": "<pattern>" // Pattern, optional
    }
}
Example:
          formats: [
            {
              range: "C2:C20",
              format: {
                type: "n",
                pattern: "0.00",
              },
            },
            {
              range: "C2:C20",
              format: ExcellentExport.formats.NUMBER,
            }
          ],
format can be used from one of the predefined types if you use TypeScript
cell_type can be one of the followint:
's': String
'n': Number
'd': Date
'b': Boolean
pattern is a string with the format pattern used in Excel. For example:
'0' // Integer
'0.00' // 2 decimals
'dd/mm/yyyy' // Date
'dd/mm/yyyy hh:mm:ss' // Date and time
'0.00%' // Percentage
'0.00e+00' // Scientific notation
'@' // Text
Notes
- IE8 or lower do not support data: url schema.
- IE9 does not support data: url schema on links.
- IE10 and above and Edge are supported via the Microsoft-specific
msOpenOrSaveBlobmethod.
Test
python 2.x:
    python -m SimpleHTTPServer 8000

python 3.x:
    python -m http.server 8000
Build
Install dependencies:
Build development version dist/excellentexport.js
Build publish version of dist/excellentexport.js
Publish
If you can generate the Excel file on the server, that is probably the best way. With Excel you can add formatting and get the output to look better. Several Excel options have already been mentioned. If you have a PHP backend, you might consider phpExcel.
If you are trying to do everything on the client in javascript, I don’t think Excel is an option. You could create a CSV file and create a data URL to allow the user to download it.
I created a JSFiddle to demonstrate:
http://jsfiddle.net/5KRf6/3/
This javascript (assuming you are using jQuery) will take the values out of input boxes in a table and build a CSV formatted string:
var csv = "";
$("table").find("tr").each(function () {
    var sep = "";
    $(this).find("input").each(function () {
        csv += sep + $(this).val();
        sep = ",";
    });
    csv += "n";
});
If you wish, you can drop the data into a tag on the page (in my case a tag with an id of «csv»):
$("#csv").text(csv);
You can generate a URL to that text with this code:
window.URL = window.URL || window.webkiURL;
var blob = new Blob([csv]);
var blobURL = window.URL.createObjectURL(blob);
Finally, this will add a link to download that data:
$("#downloadLink").html("");
$("<a></a>").
attr("href", blobURL).
attr("download", "data.csv").
text("Download Data").
appendTo('#downloadLink');
JavaScript is a versatile platform that allows easy customization of client-side scripting tools. In some applications, it’s helpful to have some sort of spreadsheet interface that is easy to code and maintain. The SpreadJS client-side JavaScript spreadsheet component is perfect for this.
Add complete JavaScript spreadsheets into your enterprise web apps. Download SpreadJS Now!
In this blog, we will cover how to import/export to Excel in JavaScript following these steps:
- Set Up the JavaScript Spreadsheet Project
- Add Excel Import Code
- Add Data to the Imported Excel File
- Add a Sparkline
- Add Excel Export Code

Set Up the JavaScript Spreadsheet Project
To start, we can use the SpreadJS files hosted on NPM. To do this, we can install using a command line argument. Open a command prompt and navigate to the location of your application. There, you can install the required files with one command.
In this case, we need the base Spread-Sheets library, Spread-ExcelIO, and jQuery:
npm i @grapecity/spread-sheets @grapecity/spread-excelio jquery
SpreadJS isn’t dependent on jQuery, but in this case, we use it for the easy cross-origin-request support, which we will review later.
Once those are installed, we can add references to those script and CSS files in our code:
<!DOCTYPE html>
<html>
<head>
    <title>SpreadJS ExcelIO</title>
    <script src="./node_modules/jquery/dist/jquery.min.js" type="text/javascript"></script>
    <script src="https://cdnjs.cloudflare.com/ajax/libs/FileSaver.js/2014-11-29/FileSaver.min.js"></script>

    <link href="./node_modules/@grapecity/spread-sheets/styles/gc.spread.sheets.excel2013white.css" rel="stylesheet" type="text/css" />
    <script type="text/javascript" src="./node_modules/@grapecity/spread-sheets/dist/gc.spread.sheets.all.min.js"></script>
    <script type="text/javascript" src="./node_modules/@grapecity/spread-excelio/dist/gc.spread.excelio.min.js"></script>

</head>
<body>
    <div id="ss" style="height:600px; width :100%; "></div>
</body>
</html>
We will also need the FileSaver library, which we have imported in addition to the SpreadJS and jQuery files.
Then we can add a script to the page that initializes the Spread.Sheets component and a div element to contain it (since the SpreadJS spreadsheet component utilizes a canvas, this is necessary to initialize the component):
    <script type="text/javascript">
        $(document).ready(function () {
            var workbook = new GC.Spread.Sheets.Workbook(document.getElementById("ss"));
        });
    </script>
</head>
<body>
    <div id="ss" style="height:600px ; width :100%; "></div>
</body>
Add Excel Import Code
We need to create an instance of the client-side ExcelIO component that we can use to open the file:
var excelIO = new GC.Spread.Excel.IO(); Then we need to add a function to import a file. In this example, we import a local file, but you can do the same thing with a file on a server. You need to reference the location if importing a file from a server. The following is an example of an input element where the user can enter the location of the file:
<input type="text" id="importUrl" value="http://www.testwebsite.com/files/TestExcel.xlsx" style="width:300px" />Once you have that, you can directly access that value in script code:
var excelUrl = $("#importUrl").val(); The following code for the import function uses a local file for the «excelUrl» variable:
function ImportFile() {
    var excelUrl = "./test.xlsx";

    var oReq = new XMLHttpRequest();
    oReq.open('get', excelUrl, true);
    oReq.responseType = 'blob';
    oReq.onload = function () {
        var blob = oReq.response;
        excelIO.open(blob, LoadSpread, function (message) {
            console.log(message);
        });
    };
    oReq.send(null);
}
function LoadSpread(json) {
    jsonData = json;
    workbook.fromJSON(json);

    workbook.setActiveSheet("Revenues (Sales)");
}
Whether you’re referencing a file on a server or locally, you’ll need to add the following to your script inside the $(document).ready function:
$(document).ready(function () {
    $.support.cors = true;
    workbook = new GC.Spread.Sheets.Workbook(document.getElementById("ss"));
    //...
});
In this case, we need to enable Cross-Origin-Request-Support because we are potentially loading a file from a URL. Hence the $.support.cors = true; line, or else attempting to load it will result in a CORS error.
Add Data to the Imported Excel File
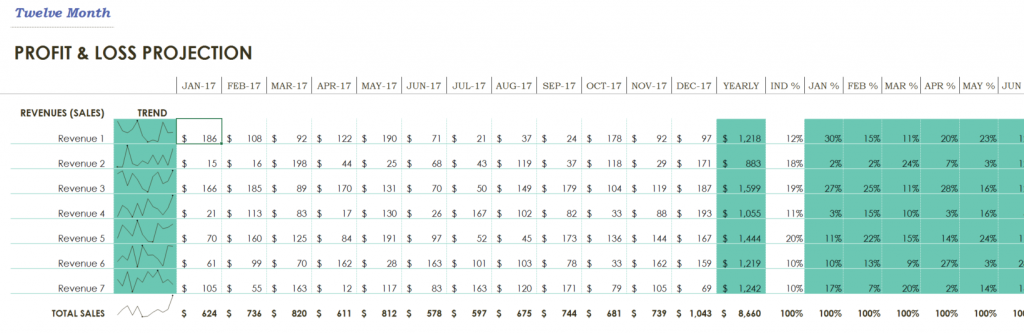
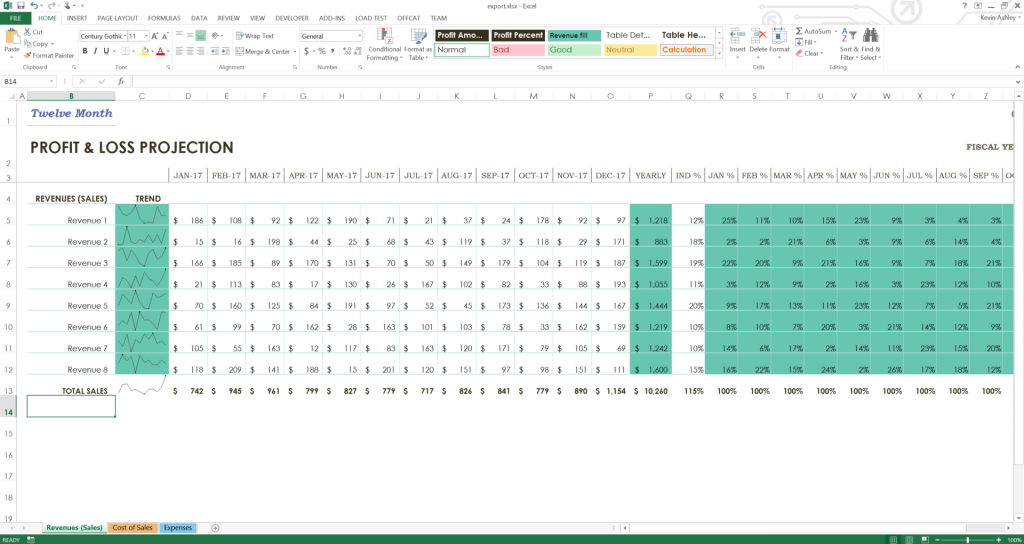
We import a local file using the “Profit loss statement” Excel template for this tutorial.
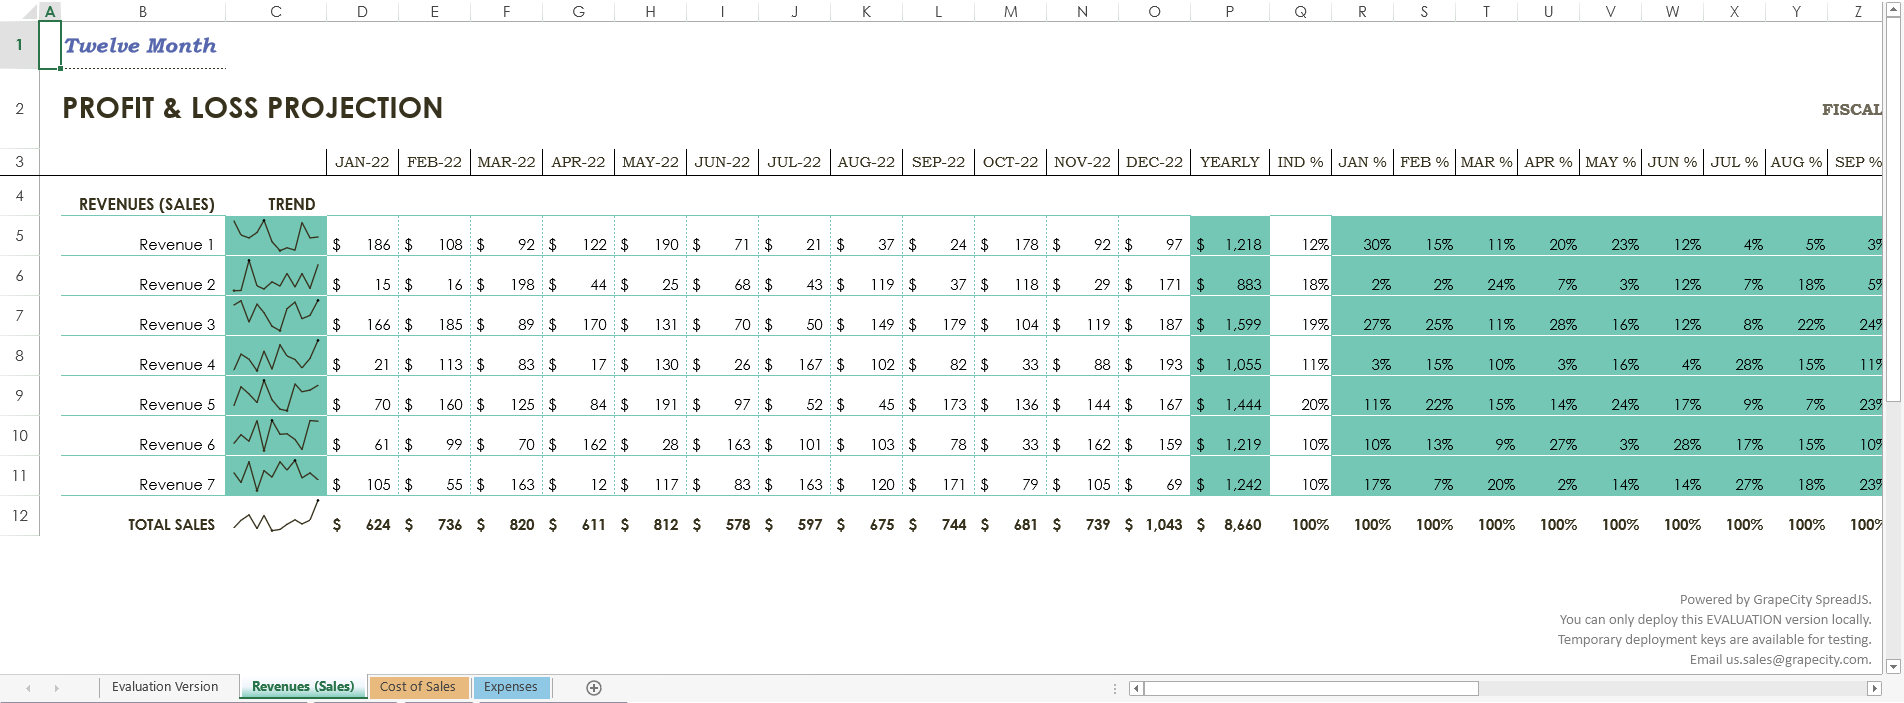
Now we can use Spread.Sheets script to add another revenue line into this file. Let’s add a button to the page that will do just that:
<button id="addRevenue">Add Revenue</button> We can write a function for the click event handler for that button to add a row and copy the style from the previous row in preparation for adding some data. To copy the style, we will need to use the copyTo function and pass in:
- the origin and destination row and column indices
- row and column count
- the CopyToOptions value for style
document.getElementById("addRevenue").onclick = function () {
var sheet = workbook.getActiveSheet();
sheet.addRows(newRowIndex, 1);
sheet.copyTo(10, 1, newRowIndex, 1, 1, 29, GC.Spread.Sheets.CopyToOptions.style);
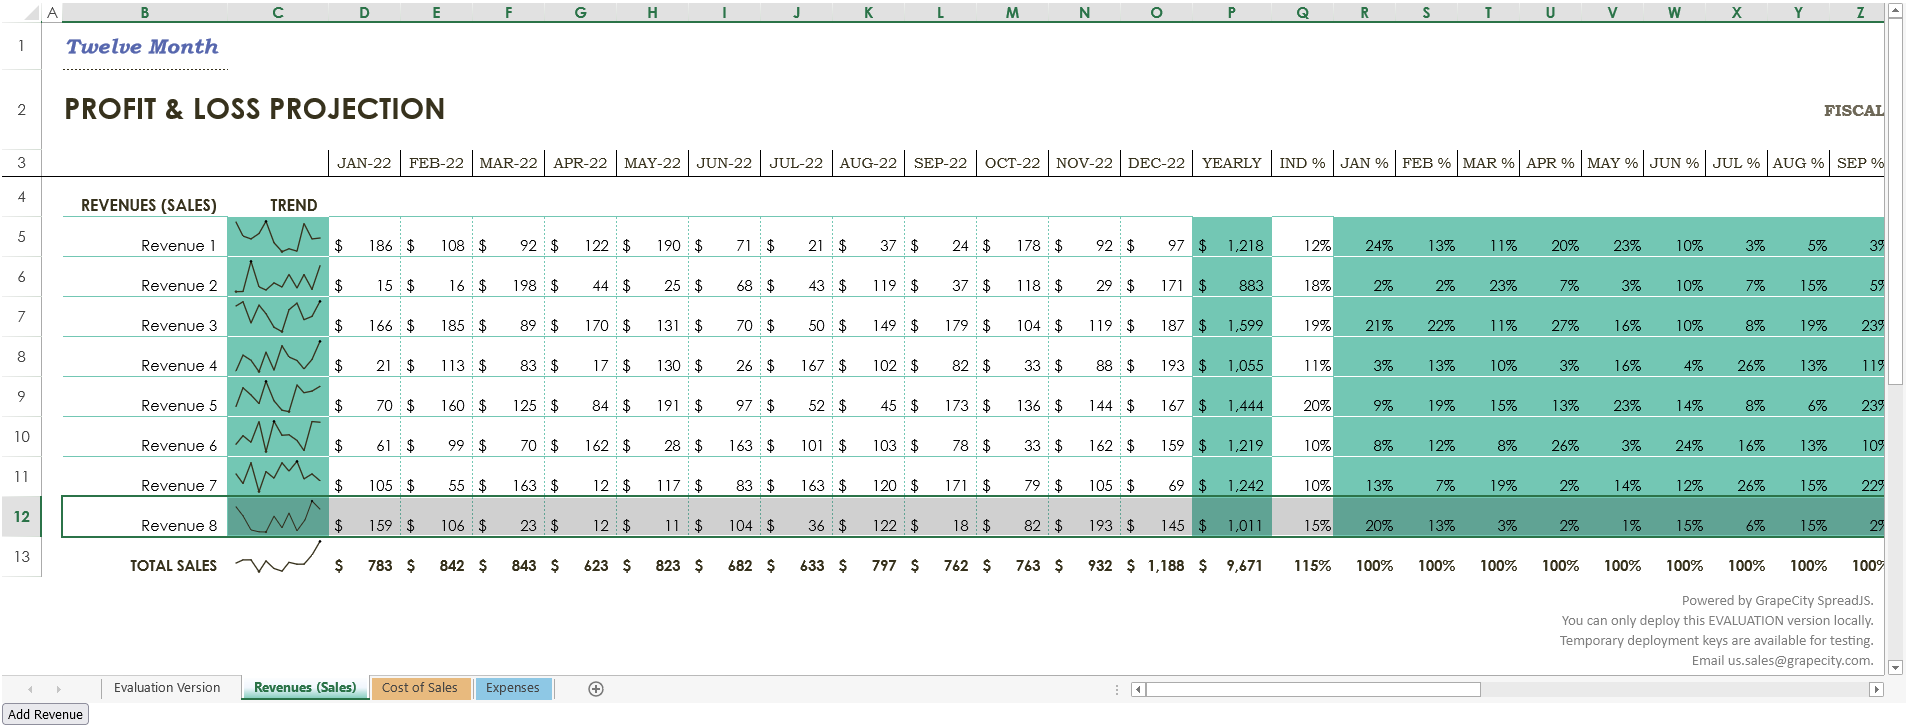
} The following script code for adding data and a Sparkline will be contained within this button click event handler. For most of the data, we can use the setValue function. This allows us to set a value in a sheet in Spread by passing in a row index, column index, and value:
sheet.setValue(newRowIndex, 1, "Revenue 8");

for (var c = 3; c < 15; c++) {
    sheet.setValue(newRowIndex, c, Math.floor(Math.random() * 200) + 10);
}
Set a SUM formula in column P to match the other rows and set a percentage for column Q:
sheet.setFormula(newRowIndex, 15, "=SUM([@[Jan]:[Dec]])")
sheet.setValue(newRowIndex, 16, 0.15);
Lastly, we can copy the formulas from the previous rows to the new row for columns R through AD using the copyTo function again, this time using CopyToOptions.formula:
sheet.copyTo(10, 17, newRowIndex, 17, 1, 13, GC.Spread.Sheets.CopyToOptions.formula); Add a Sparkline
Now we can add a sparkline to match the other rows of data. To do this, we need to provide a range of cells to get the data from and some settings for the sparkline. In this case, we can specify:
- the range of cells, we just added data to
- settings to make the sparkline look like the other sparklines in the same column
var data = new GC.Spread.Sheets.Range(11, 3, 1, 12);
var setting = new GC.Spread.Sheets.Sparklines.SparklineSetting();
setting.options.seriesColor = "Text 2";
setting.options.lineWeight = 1;
setting.options.showLow = true;
setting.options.showHigh = true;
setting.options.lowMarkerColor = "Text 2";
setting.options.highMarkerColor = "Text 1";
After that, we call the setSparkline method and specify:
- a location for the sparkline
- the location of the data
- the orientation of the sparkline
- the type of sparkline
- the settings we created
sheet.setSparkline(11, 2, data, GC.Spread.Sheets.Sparklines.DataOrientation.horizontal, GC.Spread.Sheets.Sparklines.SparklineType.line, setting); If you were to try running the code now, it might seem a little slow because the workbook is repainting every time data is changed and styles are added. To drastically speed it up and increase performance, Spread.Sheets provide the ability to suspend painting and the calculation service. Let’s add the code to suspend both before adding a row and its data and then resume both after:
workbook.suspendPaint();
workbook.suspendCalcService();
//...
workbook.resumeCalcService();
workbook.resumePaint();
Once we add that code, we can open the page in a web browser and see the Excel file load into Spread.Sheets with an added revenue row. Important: Keep in mind that Chrome doesn’t allow you to open local files for security purposes, so you need to use a web browser like Firefox to run this code successfully. Alternatively, loading a file from a website URL should open fine in any browser.
Add Excel Export Code
Finally, we can add a button to export the file with the added row. To do this, we can use the client-side ExcelIO code built into Spread.Sheets:
function ExportFile() {
var fileName = $("#exportFileName").val();
if (fileName.substr(-5, 5) !== '.xlsx') {
fileName += '.xlsx';
}
var json = JSON.stringify(workbook.toJSON());
excelIO.save(json, function (blob) {
saveAs(blob, fileName);
}, function (e) {
if (e.errorCode === 1) {
alert(e.errorMessage);
}
});
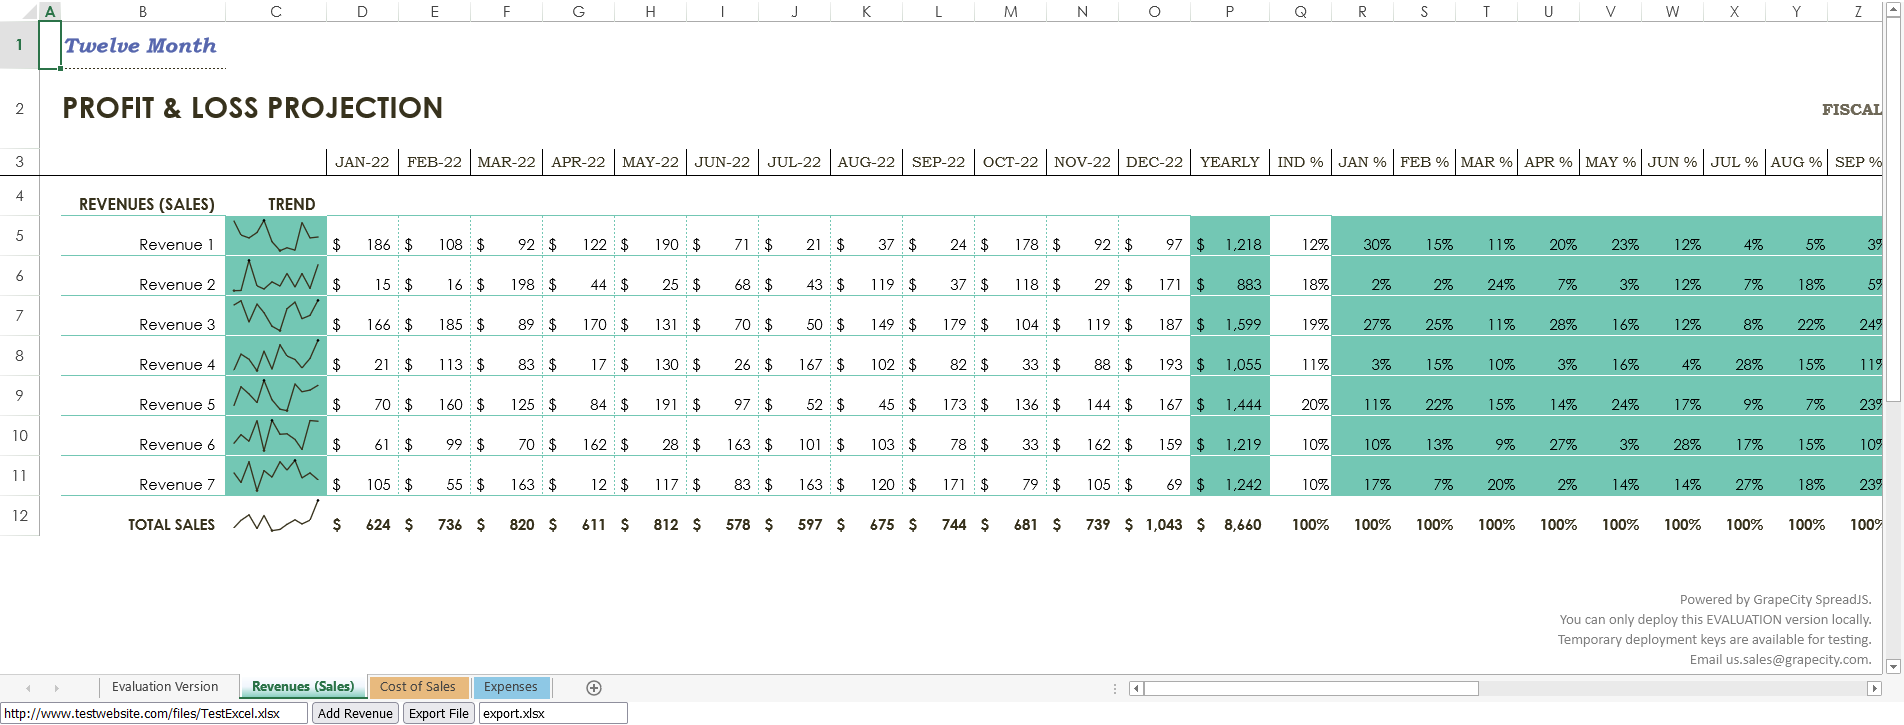
} That code gets the export file name from an exportFileName input element. We can define it and let users name the file like so:
<input type="text" id="exportFileName" placeholder="Export file name" value="export.xlsx" /> Then we can add a button that calls this function:
<button id="export">Export File</button> document.getElementById("export").onclick = function () {
ExportFile();
} 
Once you add a revenue row, you can export the file using the Export File button. Make sure to add the FileSaver external library to allow users to save the file where they want:
<script src="https://cdnjs.cloudflare.com/ajax/libs/FileSaver.js/2014-11-29/FileSaver.min.js"></script> When the file is successfully exported, you can open it in Excel and see that the file looks like it did when it was imported, except there is now an extra revenue line that we added.

This is just one example of how you can use SpreadJS JavaScript spreadsheets to add data to your Excel files and then export them back to Excel with simple JavaScript code.
Download the sample here.
In another article series, we demonstrate how to import/export Excel spreadsheets in other Javascript frameworks:
- React
- Vue
- Angular
Add complete JavaScript spreadsheets into your enterprise web apps. Download SpreadJS Now!
- Home
- JavaScript
- Export HTML Table Data to Excel using JavaScript
By: CodexWorld
|
In: JavaScript
|
Last Updated: Jun 7, 2021
Export data to Excel is very useful on the data list for nearly every web application. The export feature helps to download the data list as a file format for offline use. Excel format is ideal for exporting data in a file. Mostly the server-side method is used for export data to excel using PHP. But if you want a client-side solution to export table data to excel, it can be easily done using JavaScript.
The client-side export functionality makes the web application user-friendly. Using JavaScript, the HTML table data can be easily exported without page refresh. In this tutorial, we will show you how to export HTML table data to excel using JavaScript. The JavaScript export functionality can be used in the member list, product list, or other lists to download the data list in excel file format.
Export HTML Table Data to Excel
JavaScript Code:
The exportTableToExcel() function convert HTML table data to excel and download as XLS file (.xls).
tableID– Required. Specify the HTML table ID to export data from.filename– Optional. Specify the file name to download excel data.
function exportTableToExcel(tableID, filename = ''){
    var downloadLink;
    var dataType = 'application/vnd.ms-excel';
    var tableSelect = document.getElementById(tableID);
    var tableHTML = tableSelect.outerHTML.replace(/ /g, '%20');

    // Specify file name
    filename = filename?filename+'.xls':'excel_data.xls';

    // Create download link element
    downloadLink = document.createElement("a");

    document.body.appendChild(downloadLink);

    if(navigator.msSaveOrOpenBlob){
        var blob = new Blob(['ufeff', tableHTML], {
            type: dataType
        });
        navigator.msSaveOrOpenBlob( blob, filename);
    }else{
        // Create a link to the file
        downloadLink.href = 'data:' + dataType + ', ' + tableHTML;

        // Setting the file name
        downloadLink.download = filename;

        //triggering the function
        downloadLink.click();
    }
}
HTML Table Data:
The HTML table contains some users data with some basic fields like name, email, country.
<table id="tblData">
    <tr>
        <th>Name</th>
        <th>Email</th>
        <th>Country</th>
    </tr>
    <tr>
        <td>John Doe</td>
        <td>john@gmail.com</td>
        <td>USA</td>
    </tr>
    <tr>
        <td>Michael Addison</td>
        <td>michael@gmail.com</td>
        <td>UK</td>
    </tr>
    <tr>
        <td>Sam Farmer</td>
        <td>sam@gmail.com</td>
        <td>France</td>
    </tr>
</table>
The button triggers exportTableToExcel() function to export HTML table data using JavaScript.
<button onclick="exportTableToExcel('tblData')">Export Table Data To Excel File</button>
If you want to export data with the custom file name, pass your desired file name in the exportTableToExcel() function.
<button onclick="exportTableToExcel('tblData', 'members-data')">Export Table Data To Excel File</button>
Export Data to Excel in PHP
Conclusion
Our example code helps you to add export functionality in the HTML table without any third-party jQuery plugin or server-side script. You can easily export the table data using minimal JavaScript code. Also, the functionality of the example code can be enhanced or customized easily as per your needs.
- DataTables
- Excel
- Export
- JavaScript
Are you want to get implementation help, or modify or enhance the functionality of this script? Click Here to Submit Service Request
If you have any questions about this script, submit it to our QA community — Ask Question
RELATED TUTORIALS
Leave a reply
Preface
Recently, the company needs to export several statistical tables to excel. Because the company’s existing export excel function is front-end and back-end export, it is troublesome, so I want to find a pure front-end export tool, and finally found js-xlsx, which is highly rated, but the Chinese documents were not found, Baidu did not find a more comprehensive one.Tutorial, so I stepped on a lot of pits, I record them for future use.
Environmental Science
Since my business only uses exporting the contents of a table tag to excel, I only write how to export the contents of a table element to excel.It can also be exported through json, which seems simpler.
install
GitHub address
npm installation
npm install xlsx
After installation, there is a file named xlsx.full.min.js under the dist folder, which was introduced into the project
First example
Code first
<!DOCTYPE html>
<html lang="en">
<head>
    <meta charset="UTF-8">
    <meta name="viewport" content="width=device-width, initial-scale=1.0">
    <meta http-equiv="X-UA-Compatible" content="ie=edge">
    <title>Document</title>
</head>
<body>
    <table id="table1" border="1" cellspacing="0" cellpadding="0" >
        <thead>
            <tr>
                <td>Sequence Number</td>
                <td>Full name</td>
                <td>Age</td>
                <td>Interest</td>
            </tr>
        </thead>
        <tbody>
            <tr>
                <td>1</td>
                <td>Zhang San</td>
                <td>18</td>
                <td>Play games</td>
            </tr>
            <tr>
                <td>2</td>
                <td>Li Si</td>
                <td>88</td>
                <td>Watch movie</td>
            </tr>
            <tr>
                <td>3</td>
                <td>King Five</td>
                <td>81</td>
                <td>Sleep</td>
            </tr>
        </tbody>
    </table>

    <button id="btn" onclick="btn_export()">export</button>
</body>
<script src="js/xlsx.full.min.js"></script>
<script src="js/export.js"></script>
<script>
    function btn_export() {
        var table1 = document.querySelector("#table1");
        var sheet = XLSX.utils.table_to_sheet(table1);//Convert a table object to a sheet object
        openDownloadDialog(sheet2blob(sheet),'download.xlsx');
    }
</script>
</html>
Running effect
Export results:

As you may notice, I’ve introduced an export.js file here. There are only two methods in this export.js file: openDownload Dialog (sheet2blob,’download.xlsx’), which is used in the code above.
This is the code for export.js:
// Turn a sheet into a blob object for the final excel file and download it using the URL.createObjectURL
function sheet2blob(sheet, sheetName) {
    sheetName = sheetName || 'sheet1';
    var workbook = {
        SheetNames: [sheetName],
        Sheets: {}
    };
    workbook.Sheets[sheetName] = sheet; // Generate excel configuration items

    var wopts = {
        bookType: 'xlsx', // File type to generate
        bookSST: false, // Whether to generate Shared String Table or not, the official explanation is that the build speed will decrease if turned on, but there is better compatibility on lower version IOS devices
        type: 'binary'
    };
    var wbout = XLSX.write(workbook, wopts);
    var blob = new Blob([s2ab(wbout)], {
        type: "application/octet-stream"
    }); // String to ArrayBuffer
    function s2ab(s) {
        var buf = new ArrayBuffer(s.length);
        var view = new Uint8Array(buf);
        for (var i = 0; i != s.length; ++i) view[i] = s.charCodeAt(i) & 0xFF;
        return buf;
    }
    return blob;
}

function openDownloadDialog(url, saveName) {
    if (typeof url == 'object' && url instanceof Blob) {
        url = URL.createObjectURL(url); // Create a blob address
    }
    var aLink = document.createElement('a');
    aLink.href = url;
    aLink.download = saveName || ''; // HTML5 new property, specify save file name, may not suffix, note that file:///mode will not take effect
    var event;
    if (window.MouseEvent) event = new MouseEvent('click');
    else {
        event = document.createEvent('MouseEvents');
        event.initMouseEvent('click', true, false, window, 0, 0, 0, 0, 0, false, false, false, false, 0, null);
    }
    aLink.dispatchEvent(event);
}
PS: These two methods are online. Original Address .The author writes very well and finds clues here as well.
If your table tag contains operations to merge cells, XLSX.utils.table_to_sheet(*) can also be read, and the results you print can also be displayed, image:

As you can see, the tables in excel have also been merged.
But in reality, if the customer feels that the line is not centered, he will talk to you about not centering anything, so we’ll solve the problem of not centering the text now.
Set Style (Center, Text Size Color, Background Color…)
PS: This is the place where I walk the most holes…
There’s no looping around here. If you set the style, the xlsx.full.min.js above won’t work.
xlsx-style must be installed
Install xlsx-style
It looks like only npm is installed, github I can’t find an address
npm install xlsx-style
Similarly, there is an xlsx.full.min.js in the dist folder under the installation directory, huh?Same name?How to use it?Okay, I can’t get started, so I’ll just have to put my scalp on it. Note that I put the JS file for xlsx-style below:
There is also the btn_export() method to change, adding a style.
Specific cell style instructions can be found in this article xlsx-style cell style reference table
function btn_export() {
        var table1 = document.querySelector("#table1");
        var sheet = XLSX.utils.table_to_sheet(table1);
        //This is the code to modify the format
        sheet["A5"].s = {
            font: { sz: 13, bold: true, },
            alignment: {
                horizontal: "center", vertical: "center", wrap_text: true
            }
        };
        openDownloadDialog(sheet2blob(sheet),'download.xlsx');
    }
After changing, click Run, otherwise, the error is reported:
What’s the reason, because the variables exposed by both js files are called’XLSX’, but there is no XLSX.utils method in the xlsx-style js file, and the xlsx-style js file was introduced later, it overwrites the previous XLSX, so the error is reported.
There are many methods available in XLSX.utils, but they cannot be invoked in this way:
You might want to swap two js files, but the result is that xlsx exposed variables override xlsx-style exposed variables.You still can’t change your style.
Be careful
If your export function is to import json format or other formats without using XLSX.utils, you only need to use xlsx-style’s js. The following can be ignored. The following is how to make xlsx work with xlsx-style’s js.
Not using XLSX.utils
Since these two JS are encrypted content, it is impossible to interpret them and find anything useful on them.Fortunately, xlsx.extendscript.js was found in the xlsx dist folder. Look at this file as a tool class. Since I used the table_to_sheet method above, I searched over xlsx.extendscript and found this method. Next, delete the JS reference of xlsx and introduce xlsx.extendscript:
Function.As a result, you should have guessed that the style hasn’t changed.For what reason, the variables exposed by xlsx.extendscript.js are still’XLSX’, and the variables below cover the variables above.
Be careful!!!
If you use webpack, babel, etc. in your project, you can import directly without changing the variable name
Fortunately, this xlsx.extendscript.js is not a compressed version. You can modify the content by changing the exposed variable to’XLSX2′.This way we only use xlsx.extendscript.js when using the utils tool and xlsx-style as the JS for the rest, so that’s fine.
Don’t forget to change XSLX.utils.table_to_sheet() to XLSX2.utils.table_to_sheet() once you’ve modified it.
(It is not recommended to modify the source code, because the work requires that you do not modify the source code before it can be used)
function btn_export() {
        var table1 = document.querySelector("#table1");
        var sheet = XLSX2.utils.table_to_sheet(table1);
        sheet["A5"].s = {
            font: {
                sz: 13,
                bold: true,
                color: {
                    rgb: "FFFFAA00"
                }
            },
            alignment: {
                horizontal: "center",
                vertical: "center",
                wrap_text: true
            }
        };
        openDownloadDialog(sheet2blob(sheet), 'download.xlsx');
    }
Function:
You can see that the styling changes you made have taken effect.
Customer demand is increasing: I want the first few lines to be empty and print the company name on them.
Looking at the xlsx.extendscript.js source, it is found that table_to_sheet, or parse_dom_table, does not have a parameter set for the starting row. The code for parse_dom_table is given below:
function parse_dom_table(table, _opts) {
    var opts = _opts || {};
    if(DENSE != null) opts.dense = DENSE;
    var ws = opts.dense ? ([]) : ({});
    var rows = table.getElementsByTagName('tr');
    var sheetRows = opts.sheetRows || 10000000;
    var range = {s:{r:0,c:0},e:{r:0,c:0}};
    var merges = [], midx = 0;
    var rowinfo = [];
    var _R = 0, R = 0, _C, C, RS, CS;
    for(; _R < rows.length && R < sheetRows; ++_R) {
        var row = rows[_R];
        if (is_dom_element_hidden(row)) {
            if (opts.display) continue;
            rowinfo[R] = {hidden: true};
        }
        var elts = (row.children);
        for(_C = C = 0; _C < elts.length; ++_C) {
            var elt = elts[_C];
            if (opts.display && is_dom_element_hidden(elt)) continue;
            var v = htmldecode(elt.innerHTML);
            for(midx = 0; midx < merges.length; ++midx) {
                var m = merges[midx];
                if(m.s.c == C && m.s.r <= R && R <= m.e.r) { C = m.e.c+1; midx = -1; }
            }
            /* TODO: figure out how to extract nonstandard mso- style */
            CS = +elt.getAttribute("colspan") || 1;
            if((RS = +elt.getAttribute("rowspan"))>0 || CS>1) merges.push({s:{r:R,c:C},e:{r:R + (RS||1) - 1, c:C + CS - 1}});
            var o = {t:'s', v:v};
            var _t = elt.getAttribute("t") || "";
            if(v != null) {
                if(v.length == 0) o.t = _t || 'z';
                else if(opts.raw || v.trim().length == 0 || _t == "s"){}
                else if(v === 'TRUE') o = {t:'b', v:true};
                else if(v === 'FALSE') o = {t:'b', v:false};
                else if(!isNaN(fuzzynum(v))) o = {t:'n', v:fuzzynum(v)};
                else if(!isNaN(fuzzydate(v).getDate())) {
                    o = ({t:'d', v:parseDate(v)});
                    if(!opts.cellDates) o = ({t:'n', v:datenum(o.v)});
                    o.z = opts.dateNF || SSF._table[14];
                }
            }
            if(opts.dense) { if(!ws[R]) ws[R] = []; ws[R][C] = o; }
            else ws[encode_cell({c:C, r:R})] = o;
            if(range.e.c < C) range.e.c = C;
            C += CS;
        }
        ++R;
    }
    if(merges.length) ws['!merges'] = merges;
    if(rowinfo.length) ws['!rows'] = rowinfo;
    range.e.r = R - 1;
    ws['!ref'] = encode_range(range);
    if(R >= sheetRows) ws['!fullref'] = encode_range((range.e.r = rows.length-_R+R-1,range)); // We can count the real number of rows to parse but we don't to improve the performance
    return ws;
}
Add one yourself
As you can see, the R variable inside is the key to controlling the starting line. Okay, let’s make some changes:
var _R = 0, R = _opts.rowIndex || 0, _C, C, RS, CS;
Here we add an attribute, rowIndex, to _opts, which is passed in when the table_to_sheet method is called.Here is the changed code:
function btn_export() {
        var table1 = document.querySelector("#table1");
        var opt = {
            rowIndex: 4
        }; //Start empty 4 lines
        var sheet = XLSX2.utils.table_to_sheet(table1, opt);
        sheet["A1"] = {
            t: "s",
            v: 'Sanlu Group Ltd.'
        }; //Assign values to A1 cells
        sheet["A1"].s = {
            font: {
                name: 'Song Style',
                sz: 24,
                bold: true,
                underline: true,
                color: {
                    rgb: "FFFFAA00"
                }
            },
            alignment: { horizontal: "center", vertical: "center", wrap_text: true },
            fill: {
                bgColor: { rgb: 'ffff00' }
            }
        };
        //['!merges'] This property is designed for cell merging
        sheet["!merges"].push({//If not null push is null = assign
            //Merge cell index starts at 0
            s: { //s Start
                c: 0, //Beginning column
                r: 0 //Start Line
            },
            e: { //e End
                c: 3, //End Column
                r: 2 //End line
            }
        });
        sheet["A9"].s = { //style
            font: {
                sz: 13,
                bold: true,
                color: {
                    rgb: "FFFFAA00"
                }
            },
            alignment: {
                horizontal: "center",
                vertical: "center",
                wrap_text: true
            }
        };
        openDownloadDialog(sheet2blob(sheet), 'download.xlsx');
    }
Run result:
You can see that the changes you made have taken effect.
Customers have new requirements, to add 2 fields, ID number and mobile phone number.
Isn’t that easy? Add two fields.2 minutes, export:
???
How did the ID number become a scientific method of counting and what the ghost was (later it was found that the percentage would be converted directly to 0-1 decimals for you, but statistics can’t be done)
What’s going on? Or a masterpiece of parse_dom_table!
Note this line:
else if(!isNaN(fuzzynum(v))) o = {t:'n', v:fuzzynum(v)};
This means that as long as the value read from the text of td is followed by a number (regardless of your string type), a fuzzynum(v) will be given to you to convert to a numbertype.
Make the following changes, the result is:
function parse_dom_table(table, _opts) {
    var opts = _opts || {};
    if(DENSE != null) opts.dense = DENSE;
    var ws = opts.dense ? ([]) : ({});
    var rows = table.getElementsByTagName('tr');
    var sheetRows = opts.sheetRows || 10000000;
    var range = {s:{r:0,c:0},e:{r:0,c:0}};
    var merges = [], midx = 0;
    var rowinfo = [];
    var _R = 0, R = _opts.rowIndex || 0, _C, C, RS, CS;
    for(; _R < rows.length && R < sheetRows; ++_R) {
        var row = rows[_R];
        if (is_dom_element_hidden(row)) {
            if (opts.display) continue;
            rowinfo[R] = {hidden: true};
        }
        var elts = (row.children);
        for(_C = C = 0; _C < elts.length; ++_C) {
            var elt = elts[_C];
            if (opts.display && is_dom_element_hidden(elt)) continue;
            var v = htmldecode(elt.innerHTML);
            for(midx = 0; midx < merges.length; ++midx) {
                var m = merges[midx];
                if(m.s.c == C && m.s.r <= R && R <= m.e.r) { C = m.e.c+1; midx = -1; }
            }
            /* TODO: figure out how to extract nonstandard mso- style */
            CS = +elt.getAttribute("colspan") || 1;
            if((RS = +elt.getAttribute("rowspan"))>0 || CS>1) merges.push({s:{r:R,c:C},e:{r:R + (RS||1) - 1, c:C + CS - 1}});
            var o = {t:'s', v:v};
            var _t = elt.getAttribute("t") || "";
            if(v != null) {
                if(v.length == 0) o.t = _t || 'z';
                else if(opts.raw || v.trim().length == 0 || _t == "s"){}
                else if(v === 'TRUE') o = {t:'b', v:true};
                else if(v === 'FALSE') o = {t:'b', v:false};
        //else if(!isNaN(fuzzynum(v))) o = {t:'n', v:fuzzynum(v)};
        else if(!isNaN(fuzzynum(v))) o = {t:'s', v:v};//number type is not automatically formatted
                else if(!isNaN(fuzzydate(v).getDate())) {
                    o = ({t:'d', v:parseDate(v)});
                    if(!opts.cellDates) o = ({t:'n', v:datenum(o.v)});
                    o.z = opts.dateNF || SSF._table[14];
                }
            }
            if(opts.dense) { if(!ws[R]) ws[R] = []; ws[R][C] = o; }
            else ws[encode_cell({c:C, r:R})] = o;
            if(range.e.c < C) range.e.c = C;
            C += CS;
        }
        ++R;
    }
    if(merges.length) ws['!merges'] = merges;
    if(rowinfo.length) ws['!rows'] = rowinfo;
    range.e.r = R - 1;
    ws['!ref'] = encode_range(range);
    if(R >= sheetRows) ws['!fullref'] = encode_range((range.e.r = rows.length-_R+R-1,range)); // We can count the real number of rows to parse but we don't to improve the performance
    return ws;
}
Comment out the converted statement, rewrite the line of code, and if it is of type number, leave it unchanged as to what value it should be or what value it should be.
Now rerun, the result is: You can see that the numbers are displayed properly.But this cell doesn’t seem to expand automatically, it’s always so big, and xlsx-style also provides a way to control the width of the cell:
sheet["!cols"] = [{
            wpx: 70
        }, {
            wpx: 70
        }, {
            wpx: 70
        }, {
            wpx: 70
        }, {
            wpx: 150
        }, {
            wpx: 120
        }]; //Cell Column Width
Note that setting cell column widths starts with the first row
Result:
Full front-end code:
<!DOCTYPE html>
<html lang="en">

<head>
    <meta charset="UTF-8">
    <meta name="viewport" content="width=device-width, initial-scale=1.0">
    <meta http-equiv="X-UA-Compatible" content="ie=edge">
    <title>Document</title>
</head>

<body>
    <table id="table1" border="1" cellspacing="0" cellpadding="0">
        <thead>
            <tr>
                <td>Sequence Number</td>
                <td>Full name</td>
                <td>Age</td>
                <td>Interest</td>
                <td>ID number</td>
                <td>Cell-phone number</td>
            </tr>
        </thead>
        <tbody>
            <tr>
                <td>1</td>
                <td>Zhang San</td>
                <td>18</td>
                <td>Play games</td>
                <td>320322184087562589</td>
                <td>1374569821</td>
            </tr>
            <tr>
                <td>2</td>
                <td>Li Si</td>
                <td>88</td>
                <td>Watch movie</td>
                <td>420322184087562589</td>
                <td>2374569821</td>
            </tr>
            <tr>
                <td>3</td>
                <td>King Five</td>
                <td>81</td>
                <td>Sleep</td>
                <td>520322184087562589</td>
                <td>3374569821</td>
            </tr>
            <tr>
                <td colspan="4">This is a merged cell</td>
            </tr>
        </tbody>
    </table>

    <button id="btn" onclick="btn_export()">export</button>
</body>
<script src="js/xlsx.extendscript.js"></script>
<script src="js/xlsx-style/xlsx.full.min.js"></script>

<script src="js/export.js"></script>
<script>
    function btn_export() {
        var table1 = document.querySelector("#table1");
        var opt = {
            rowIndex: 4
        }; //Start empty 4 lines
        var sheet = XLSX2.utils.table_to_sheet(table1, opt);
        sheet["A1"] = {
            t: "s",
            v: 'Sanlu Group Ltd.'
        }; //Assign values to A1 cells
        sheet["A1"].s = {
            font: {
                name: 'Song Style',
                sz: 24,
                bold: true,
                underline: true,
                color: {
                    rgb: "FFFFAA00"
                }
            },
            alignment: {
                horizontal: "center",
                vertical: "center",
                wrap_text: true
            },
            fill: {
                bgColor: {
                    rgb: 'ffff00'
                }
            }
        };
        //['!merges'] This property is designed for cell merging
        sheet["!merges"].push({ //If not null push is null = assign
            //Merge cell index starts at 0
            s: { //s Start
                c: 0, //Beginning column
                r: 0 //Start Line
            },
            e: { //e End
                c: 3, //End Column
                r: 2 //End line
            }
        });
        sheet["A9"].s = { //style
            font: {
                sz: 13,
                bold: true,
                color: {
                    rgb: "FFFFAA00"
                }
            },
            alignment: {
                horizontal: "center",
                vertical: "center",
                wrap_text: true
            }
        };

        sheet["!cols"] = [{
            wpx: 70
        }, {
            wpx: 70
        }, {
            wpx: 70
        }, {
            wpx: 70
        }, {
            wpx: 150
        }, {
            wpx: 120
        }]; //Cell Column Width

        openDownloadDialog(sheet2blob(sheet), 'download.xlsx');
    }
</script>

</html>
demo source
github address Full Instance
summary
- Source modification is not recommended in exceptional circumstances
- Since the code was modified after all, this approach can only be targeted to a smaller audience
- I’ve heard that the toll version is full of features. I suggest you buy the toll version if you need it, but the address can’t be found.
- You can modify the xlsx source code to suit your own needs.However, this is more difficult to maintain, so it is up to you to choose between them.
- I have just listed the functions I need in my actual work. xlsx has so many functions that I can think over more when I have time.
Содержание
- Exporting data in excel file in Node.js
- Video:
- Repository:
- Closing Thoughts:
- How to Import and Export Excel XLSX Using JavaScript
- Set Up the JavaScript Spreadsheet Project
- Add Excel Import Code
- Add Data to the Imported Excel File
- Add a Sparkline
- Add Excel Export Code
- How to export html table to excel using javascript
- 12 Answers 12
- Export HTML Table Data to Excel using JavaScript
- Export HTML Table Data to Excel
- Conclusion
- SheetJS Tutorial – Create xlsx with Javascript
- Creating a Workbook
- Exporting Workbook for Download
Exporting data in excel file in Node.js
→ Many times when we have some reporting or an admin panel application we need to download data in an excel file.
→ This can be achieved in any JavaScript framework. For this article, we will use node with express.js.
→ We will use the exceljs package for the same.
→ We need to install the basic express setup using the below command
→ Open the application in your favourite code editor. The directory structure will look like below:
→ Let us start the node server using the below command
→ Open localhost:3000 in the browser. The default home route opens.
→ Once the project is set up, we will install exceljs package
→ STEP1: We will create a route for which download will happen. Open route/index.js file.
Here exportUser is a controller which we will create in STEP3
→ STEP2: We will create a model. This page will hold the data which we want to export. In real scenarios, we will connect with either relational or non-relational databases and get data.
→ Here, for simplicity, we have written just the output of data from any database.
→ STEP3: We will create a controller which will link to our route
In the route, we will import this controller and configure to our route
→ STEP5: Here, we will write the logic for downloading excel in the User controller:
→ Here we create a workbook. Inside the workbook, we create a worksheet.
→ Every sheet holds a different set of data. For this article, we have only one file to download i.e. user worksheet
→ In the next step, we define the columns to print. The key of every entry should match the User data that is there in the User model.
→ We download using the below command. This will download in xlsx format. exceljs also provide a facility to download in CSV format
→Keeping node server should be running. Let us run the route in browser
→ File is now downloaded in the path mentioned in response
Video:
Repository:
Closing Thoughts:
We have seen how simply we can export data in an excel file. Try reading exceljs documentation. There we can do many formatting and download options in excel files.
Thank you for being till the end 🙌 . If you enjoyed this article or learned something new, support me by clicking the share button below to reach more people and/or give me a follow on Twitter to see some other tips, articles, and things I learn and share there.
Источник
How to Import and Export Excel XLSX Using JavaScript
JavaScript is a versatile platform that allows easy customization of client-side scripting tools. In some applications, it’s helpful to have some sort of spreadsheet interface that is easy to code and maintain. The SpreadJS client-side JavaScript spreadsheet component is perfect for this.
Add complete JavaScript spreadsheets into your enterprise web apps. Download SpreadJS Now!
In this blog, we will cover how to import/export to Excel in JavaScript following these steps:
Set Up the JavaScript Spreadsheet Project
To start, we can use the SpreadJS files hosted on NPM. To do this, we can install using a command line argument. Open a command prompt and navigate to the location of your application. There, you can install the required files with one command.
In this case, we need the base Spread-Sheets library, Spread-ExcelIO, and jQuery:
npm i @grapecity/spread-sheets @grapecity/spread-excelio jquery
SpreadJS isn’t dependent on jQuery, but in this case, we use it for the easy cross-origin-request support, which we will review later.
Once those are installed, we can add references to those script and CSS files in our code:
We will also need the FileSaver library, which we have imported in addition to the SpreadJS and jQuery files.
Then we can add a script to the page that initializes the Spread.Sheets component and a div element to contain it (since the SpreadJS spreadsheet component utilizes a canvas, this is necessary to initialize the component):
Add Excel Import Code
We need to create an instance of the client-side ExcelIO component that we can use to open the file:
Then we need to add a function to import a file. In this example, we import a local file, but you can do the same thing with a file on a server. You need to reference the location if importing a file from a server. The following is an example of an input element where the user can enter the location of the file:
Once you have that, you can directly access that value in script code:
The following code for the import function uses a local file for the «excelUrl» variable:
Whether you’re referencing a file on a server or locally, you’ll need to add the following to your script inside the $(document).ready function:
In this case, we need to enable Cross-Origin-Request-Support because we are potentially loading a file from a URL. Hence the $.support.cors = true; line, or else attempting to load it will result in a CORS error.
Add Data to the Imported Excel File
We import a local file using the “Profit loss statement” Excel template for this tutorial.

Now we can use Spread.Sheets script to add another revenue line into this file. Let’s add a button to the page that will do just that:
We can write a function for the click event handler for that button to add a row and copy the style from the previous row in preparation for adding some data. To copy the style, we will need to use the copyTo function and pass in:
- the origin and destination row and column indices
- row and column count
- the CopyToOptions value for style
The following script code for adding data and a Sparkline will be contained within this button click event handler. For most of the data, we can use the setValue function. This allows us to set a value in a sheet in Spread by passing in a row index, column index, and value:
Set a SUM formula in column P to match the other rows and set a percentage for column Q:
Lastly, we can copy the formulas from the previous rows to the new row for columns R through AD using the copyTo function again, this time using CopyToOptions.formula:
Add a Sparkline
Now we can add a sparkline to match the other rows of data. To do this, we need to provide a range of cells to get the data from and some settings for the sparkline. In this case, we can specify:
- the range of cells, we just added data to
- settings to make the sparkline look like the other sparklines in the same column
After that, we call the setSparkline method and specify:
- a location for the sparkline
- the location of the data
- the orientation of the sparkline
- the type of sparkline
- the settings we created
If you were to try running the code now, it might seem a little slow because the workbook is repainting every time data is changed and styles are added. To drastically speed it up and increase performance, Spread.Sheets provide the ability to suspend painting and the calculation service. Let’s add the code to suspend both before adding a row and its data and then resume both after:
Once we add that code, we can open the page in a web browser and see the Excel file load into Spread.Sheets with an added revenue row. Important: Keep in mind that Chrome doesn’t allow you to open local files for security purposes, so you need to use a web browser like Firefox to run this code successfully. Alternatively, loading a file from a website URL should open fine in any browser.

Add Excel Export Code
Finally, we can add a button to export the file with the added row. To do this, we can use the client-side ExcelIO code built into Spread.Sheets:
That code gets the export file name from an exportFileName input element. We can define it and let users name the file like so:
Then we can add a button that calls this function:
Once you add a revenue row, you can export the file using the Export File button. Make sure to add the FileSaver external library to allow users to save the file where they want:
When the file is successfully exported, you can open it in Excel and see that the file looks like it did when it was imported, except there is now an extra revenue line that we added.
This is just one example of how you can use SpreadJS JavaScript spreadsheets to add data to your Excel files and then export them back to Excel with simple JavaScript code.
In another article series, we demonstrate how to import/export Excel spreadsheets in other Javascript frameworks:
Add complete JavaScript spreadsheets into your enterprise web apps. Download SpreadJS Now!
Источник
How to export html table to excel using javascript
My table is in format
I found the following code online. But it doesn’t work if i use «thead» and «tbody» tags

12 Answers 12
Check https://github.com/linways/table-to-excel. Its a wrapper for exceljs/exceljs to export html tables to xlsx.
This creates valid xlsx on the client side. Also supports some basic styling. Check https://codepen.io/rohithb/pen/YdjVbb for a working example.
Only works in Mozilla, Chrome and Safari..


The reason the solution you found on the internet is no working is because of the line that starts var colCount . The variable mytable only has two elements being
and . The var colCount line is looking for all the elements within mytable that are . The best thing you can do is give an id to your and and then grab all the values based on that. Say you had :
and then do the same thing for the
tag.
EDIT: I would also highly recommend using jQuery. It would shorten this up to:
Now, of course, this is going to give you some formatting issues but you can work out how you want it formatted in Excel.
EDIT: To answer your question about how to do this for n number of tables, the jQuery will do this already. To do it in raw Javascript, grab all the tables and then alter the function to be able to pass in the table as a parameter. For instance:
Источник
Export HTML Table Data to Excel using JavaScript
Export data to Excel is very useful on the data list for nearly every web application. The export feature helps to download the data list as a file format for offline use. Excel format is ideal for exporting data in a file. Mostly the server-side method is used for export data to excel using PHP. But if you want a client-side solution to export table data to excel, it can be easily done using JavaScript.
The client-side export functionality makes the web application user-friendly. Using JavaScript, the HTML table data can be easily exported without page refresh. In this tutorial, we will show you how to export HTML table data to excel using JavaScript. The JavaScript export functionality can be used in the member list, product list, or other lists to download the data list in excel file format.
Export HTML Table Data to Excel
JavaScript Code:
The exportTableToExcel() function convert HTML table data to excel and download as XLS file (.xls).
- tableID – Required. Specify the HTML table ID to export data from.
- filename – Optional. Specify the file name to download excel data.
HTML Table Data:
The HTML table contains some users data with some basic fields like name, email, country.
The button triggers exportTableToExcel() function to export HTML table data using JavaScript.
If you want to export data with the custom file name, pass your desired file name in the exportTableToExcel() function.
Conclusion
Our example code helps you to add export functionality in the HTML table without any third-party jQuery plugin or server-side script. You can easily export the table data using minimal JavaScript code. Also, the functionality of the example code can be enhanced or customized easily as per your needs.
Are you want to get implementation help, or modify or enhance the functionality of this script? Click Here to Submit Service Request
If you have any questions about this script, submit it to our QA community — Ask Question
Источник
SheetJS Tutorial – Create xlsx with Javascript
In this tutorial, we’re going to talk about SheetJs. An Excel JavaScript library that let you do so many things with Excel such as from creating exporting workbook from scratch, converting html table, array or JSON into downloadable xlsx file. And the best thing is that, everything will be done on browser-side only. No server-side script or AJAX involved at all!
There 2 versions of SheetJS, one is community version which is free, and Pro version which has extended feature. Obviously, we’re going to use community version for this tutorial. Just download from github and copy the xlsx.full.min.js to your web directory and include it to your script tag
Creating a Workbook
Now let’s start with creating a new workbook by calling book_new() utility function which will return an empty workbook object.
You can update the workbook properties such as title, subject, author with wb.Props.
Now we have the workbook, the next step is to create a worksheet and add it to the workbook. First, you’ll need to assign a new sheet name and push it to the SheetNames array.
Then, for the content inside the sheet, you have several options. You have create a sheet from array of array, JSON or html table. For this tutorial, I’m going to use array of array. The structure is quite straightforward. Each array represent the row data and the members are the cell content.
Now create the sheet from this array by using aoa_to_sheet()
And assign the sheet object to the workbook Sheets array.
Congratulation, now you have created a workbook and a worksheet with first row of data. The next step is to generate an xlsx file.
Exporting Workbook for Download
We need to export the workbook as xlsx binary. Use write function then pass the bookType as xlsx and output Type as binary
We now have our xlsx binary data on wbout var. However, the correct content type for excel file is octet stream so you’ll need to convert the binary data into octet. We can achieve that by using arrayBuffer, UInt8Array and bit operation like this.
We’re going to utilize Filesaver.js and Blob to handle the file saving for cross browser support. Use saveAs() function and create a new Blob object from octet array. Set the content type as octet-stream. follow by excel file naming that you would like.
We’re ready; Let’s test it!
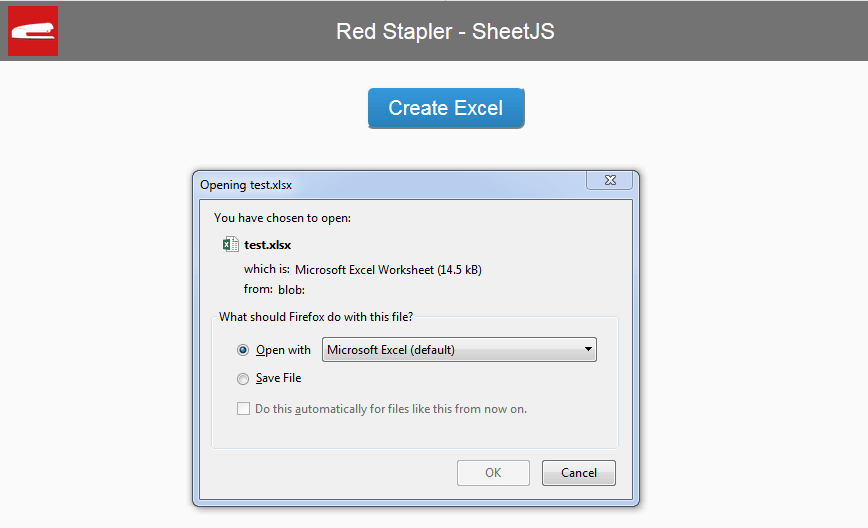

You can see it in action in video below.
So that’s the basic of how to create Excel file with pure javascript using SheetJS. In next tutorial, we’ll show you how to convert HTML table into excel file in just a few minutes with SheetJS.
Check our other interesting tutorial from our Youtube Channel – Don’t forget to like or subscribe to stay tune 🙂
Источник