
Dear Readers,
This is a small VBA tip to automate to expand or collapse groups created in Excel. Before I jump to VBA code about Expanding or collapsing the groups in excel, I would like to brief you about Grouping or Outlining Functionality in Excel.
It is always good to know “How to do it manually. before automating any step.
What is Grouping in Excel?
Most of you who use excel in their day-to-day work, know about grouping. I will explain you about grouping feature of Excel for those who does not know about this. As the name itself suggests, this is the inbuilt feature in Excel which allows users to group their Rows or Columns accordingly. Grouping can be done at Rows and Columns level both. This is called as Outlining as well.
Steps to do Grouping/Outlining in Excel?
Step 1.
Select your Rows or Columns where you want to apply the Grouping (Outlining).
Step 2.
Go to “Data” Tab in Excel Ribbon and Click on Group Button as shown in the below image:

When certain Rows or Columns are grouped then user will be able to see a + (Plus) sign to expand all the rows or columns grouped together. Once all the rows or columns are expanded then user will be able to see a – (Minus) sign to collapse them as shown in the below picture.

Is it possible to have nested Grouping?
Now what is nested grouping? As Nested means Nested grouping is Grouping within a Group. I will explain this by giving an example. Suppose you have grouped Rows 5 to 20. Within this group, create another sub-group of rows 8 to 12. Same case is with Column grouping as well. Each nesting is called as Level. Sub-grouping can be done up to 8 levels in Microsoft Excel. Refer the below picture. There are maximum of 8 Levels present. You will not be allowed to group any further level.

VBA Method used to Display Outline Levels
Outline.ShowLevels is a method which is used to show outlines of different levels. This method takes RowLevel and ColumnLevel as input.
.Outline.ShowLevels(RowLevels, ColumnLevels)
Where:
RowLevels:
This is the Row Level number UP TO which you want to show. It means if you pass this number as 7 then this method will show all the levels till 7. It will not expand the 8th Level but all the levels before 7.
ColumnLevels
This is the Column Level number UP TO which you want to show. It means if you pass this number as 7 then this method will show all the Column levels till 7. It will not expand the 8th Level but all the levels before 7.
VBA Code to Expand all Outline Levels
As mentioned earlier there can be a maximum of 8th Level in Row and Column grouping. Therefore to expand all the levels available in a sheet you can pass the maximum possible level number i.e. 8 for both Row and Column Level numbers.
Sub Expand_All()
    ActiveSheet.Outline.ShowLevels RowLevels:=8, ColumnLevels:=8
End Sub
VBA Code to Collapse all Outline Levels
There is only one method .ShowLevels is available. There is no method for hiding all the levels. But if you understand clearly the meaning of parameters passed as RowLevels and ColumnLevels then you will be able to achieve this as well using the same method.
As mentioned earlier LevelNumber are the level number to display all the levels UP TO that level ONLY. It means all the levels beyond that will not be shown. Hence if I pass Row and Column Parameter as 1 then only first Level will be displayed and all other levels will be hidden and that is how we achieved both the goals (Expand All & Collapse All) with the same method.
Sub Collapse_All()
    ActiveSheet.Outline.ShowLevels RowLevels:=1, ColumnLevels:=1
End Sub
If you want any specific level to be shown in Row or Column levels, you can achieve it by changing the parameters value.
-
#2
The Outline.ShowLevels method allows you to show a specified number of
RowLevels and Column Levels.
To Collapse all Rows and Columns…
Code:
Sub Collapse_All()
    ActiveSheet.Outline.ShowLevels RowLevels:=1, ColumnLevels:=1
End Sub
To Expand all Rows and Columns…
Code:
Sub Expand_All()
    ActiveSheet.Outline.ShowLevels RowLevels:=8, ColumnLevels:=8
End Sub
And anything in between….
Code:
Sub Collapse_Rows_to_Level2_Expand_All_Columns()
    ActiveSheet.Outline.ShowLevels RowLevels:=2, ColumnLevels:=8
End Sub
-
#3
I just noticed you want to apply this to all on selected worksheets.
I’d like to be able to run a macro which would collapse or expand all grouped rows and columns for all selected worksheets.
You can merge the code I posted with the method of iterating through
selected worksheets that Domenic provided you in your recent post.
The result for Expand_All would look like this.
Code:
Sub Expand_All()
    Dim sh As Object
    For Each sh In ActiveWindow.SelectedSheets
        If TypeName(sh) = "Worksheet" Then
            sh.Outline.ShowLevels RowLevels:=8, ColumnLevels:=8
        End If
    Next sh
    Set sh = Nothing
End Sub
You can adapt the other variations the same way.
-
#5
Glad to hear that helped.
-
#8
Hi and Welcome to the Board,
You could use either of these…
Code:
Columns("C").ShowDetail = True

Columns(3).ShowDetail = True
-
#10
Ah. Rookie mistake. Thank you!
You’re welcome.
Bottom line: Learn how to add buttons to your pivot tables and pivot charts to quickly expand/collapse entire fields using a VBA macro.
Skill level: Intermediate
Expanding & Collapsing Fields is Time Consuming
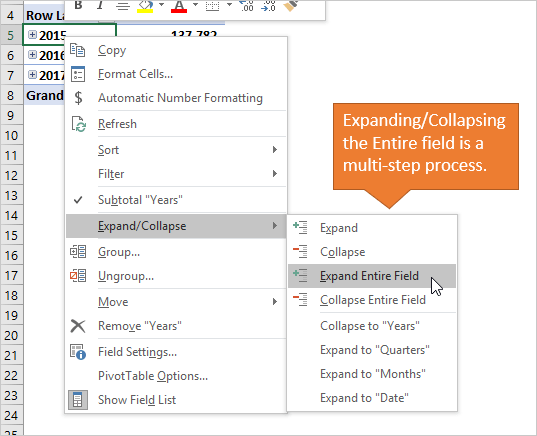
Expanding and collapsing entire fields in a pivot table can be a multi-step process that is a bit time consuming. This is especially true for the users/consumers of your Excel report files that are not familiar with the process.
To expand or collapse the ENTIRE field, we tend to press the little expand (+) and collapse (-) field buttons for each item in the field.
There are shortcuts for this on the right-click menu and the Options/Analyze tab in the ribbon.
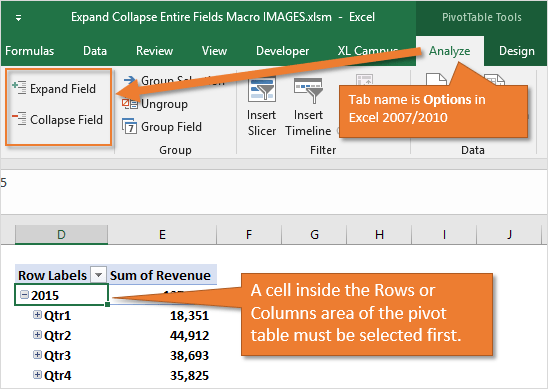
We can also press the Expand Field and Collapse Field buttons on the Analyze/Options tab of the ribbon. A cell inside the Rows or Columns area of the pivot table must be selected for these buttons to work (be enabled).
Keyboard shortcuts to Expand/Collapse fields:
Expand Entire Field: Alt, A, J Or Menu Key, E, E
Collapse Entire Field: Alt, A, H Or Menu Key, E, C
Note: A cell in the Rows or Columns area must be selected for the keyboard shortcuts to work.
However, there are no dedicated buttons on the pivot table to expand/collapse the entire field.
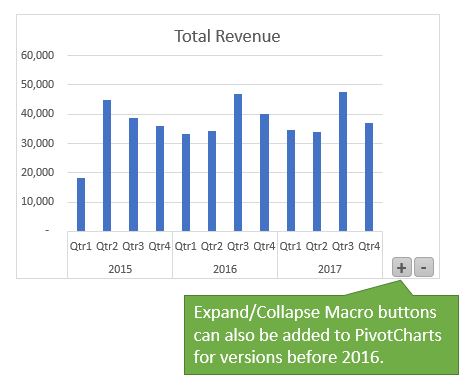
New Expand Collapse Buttons in Excel 2016 Pivot Charts
In Excel 2016 a new feature was added to pivot charts that allows us to expand or collapse the fields in the Rows area. You will see little plus and minus button in the bottom right corner of your pivot chart.
However, this feature is ONLY available in Excel 2016 (Office 365). So, I created a few macros that will work on any version of Excel, in both the Rows and Columns area of a pivot table or pivot chart.
We can also modify the pivot chart to just display the expand/collapse buttons, and add them above the pivot table. Here is an animation that shows how to do that.
The steps to modify the pivot chart are:
- Delete the Values and Axis field buttons on the chart.
- Delete the axis labels, title, and legend.
- Resize the chart to only display the Expand/Collapse buttons.
The chart will be hidden behind the buttons. So we are just using the pivot chart for the expand/collapse buttons. It’s important to note that this will only work for fields in the Rows area of the pivot table, and only in Excel 2016 (Office 365).
This set of macros will expand or collapse the NEXT field in the rows or columns area. This allows us to drill down to show the details of the fields in the Rows or Columns Area.
A good example is when the pivot table has fields in the rows area for Year, Quarter, Month, Day. We might want to compare year totals, then drill down to see totals by quarter or month.
If the pivot table is currently collapsed to years, the “Expand_Entire_RowField” macro will expand ALL of the Year items to display the Quarters for each year.
Running the “Collapse_Entire_RowField” macro will collapse the Year items back.
You can download the file that contains the macros below.
Assign the Macros to Shapes or Buttons
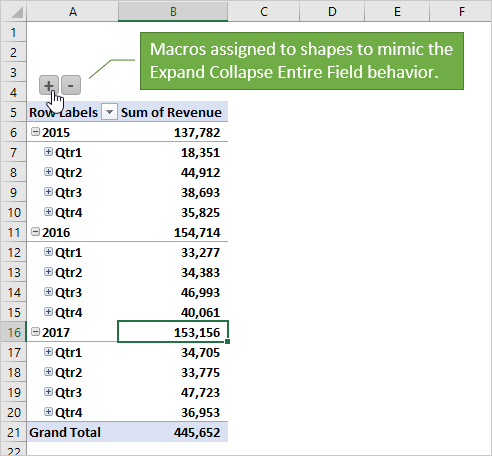
We can assign these macros to shapes or buttons on the sheet.
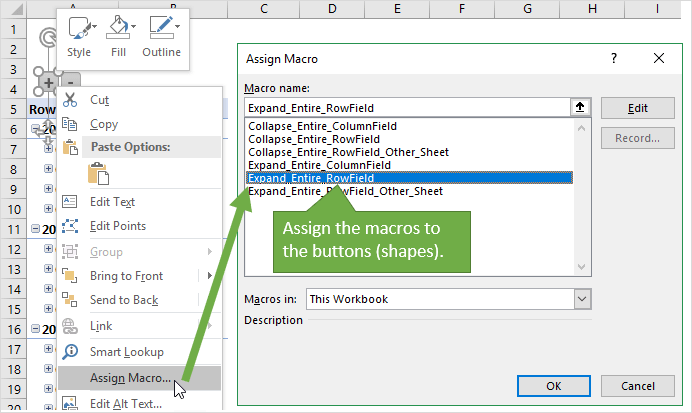
The buttons can be continually pressed to drill up or down through the fields. This makes it easy for users of your reports to quickly expand or collapse entire fields.
The shapes can be pasted inside a pivot chart to mimic the functionality of the expand/collapse buttons in Excel 2016.
The VBA Macro Code
There are four different macros for the expand/collapse on the Rows and Columns areas. The macros use For Next Loops to do some pretty aggressive looping through the pivot fields and items.
The Expand macro finds the field in the highest position that is collapsed by checking the ShowDetail property of each PivotItem. If it does NOT find an expanded item, then it expands the entire field. If all items are expanded, then it proceeds to the field in the next position down.
Sub Expand_Entire_RowField()
'Expand the lowest position field in the Rows area
'that is currently expanded (showing details)

Dim pt As PivotTable
Dim pf As PivotField
Dim pi As PivotItem
Dim iFieldCount As Long
Dim iPosition As Long

  'Create reference to 1st pivot table on sheet
  'Can be changed to reference a specific sheet or pivot table.
  Set pt = ActiveSheet.PivotTables(1)

  'Count fields in Rows area minus 1 (last field can't be expanded)
  iFieldCount = pt.RowFields.Count - 1

  'Loop by position of field
  For iPosition = 1 To iFieldCount
    'Loop fields in Rows area
    For Each pf In pt.RowFields
      'If position matches first loop variable then
      If pf.Position = iPosition Then
        'Loop each pivot item
        For Each pi In pf.PivotItems
          'If pivot item is collapsed then
          If pi.ShowDetail = False Then
            'Expand entire field
            pf.ShowDetail = True
            'Exit the macro
            Exit Sub
          End If
        Next pi
      End If
    Next pf
  'If the Exit Sub line is not hit then the
  'loop will continue to the next field position
  Next iPosition

End Sub
The Collapse macro does the opposite. It starts at the lowest field position and works backwards until it finds a pivot item that is NOT collapsed. If it finds an expanded item then it collapses the entire field. Otherwise it moves up to the field in the next position in the Rows area, and repeats the process.
Sub Collapse_Entire_RowField()
'Collapse the lowest position field in the Rows area
'that is currently expanded (showing details)

Dim pt As PivotTable
Dim pf As PivotField
Dim pi As PivotItem
Dim iFieldCount As Long
Dim iPosition As Long

  'Create reference to 1st pivot table on sheet
  'Can be changed to reference a specific sheet or pivot table.
  Set pt = ActiveSheet.PivotTables(1)

  'Count fields in Rows area minus 1 (last field can't be expanded)
  iFieldCount = pt.RowFields.Count - 1

  'Loop backwards by position of field (step -1)
  For iPosition = iFieldCount To 1 Step -1
    'Loop fields in Rows area
    For Each pf In pt.RowFields
      'If position matches first loop variable then
      If pf.Position = iPosition Then
        'Loop each pivot item
        For Each pi In pf.PivotItems
          'If pivot item is expanded then
          If pi.ShowDetail = True Then
            'Collapse entire field
            pf.ShowDetail = False
            'Exit the macro
            Exit Sub
          End If
        Next pi
      End If
    Next pf
  'If the Exit Sub line is not hit then the
  'loop will continue to the next field position
  Next iPosition

End Sub
Download the File
You can download the file that contains the macros for the Rows and Columns areas.
How Can We Improve It?
The Expand/Collapse Macro buttons should make a nice addition to any report file you send to users that aren’t Excel ninjas. I’ve seen many users click the small expand/collapse buttons repeatedly for each pivot item, simply because they didn’t know there was a better way. This macro should help give them a faster and easier way to drill down through your pivot tables or charts.
Please leave a comment below with questions or suggestions on how we can improve this. Thanks so much! 🙂
You have an Excel table with some unimportant rows, but you don’t want to delete them. In such case, you might want to “hide” them. There are two options of hiding rows (and columns): Either right-click on the row (or column) number and click on “Hide” or use the grouping function in order to create a group.
The Hide function (not recommended)
Many people love the “Hide” function for hiding rows or columns, because it is very easy to use: (the numbers are corresponding with the image)
- Mark the row(s) or column(s) that you want to hide.
- Right-click on the row number or column letter and click on “Hide”.
Unhide (all) hidden rows and columns
Unfortunately, hiding rows and columns has one big disadvantage: Hidden rows or columns are very hard to be seen. It’s only symbolized by a thin double line between the row or column number (3). A better way for hiding rows or columns is the Group function (4).
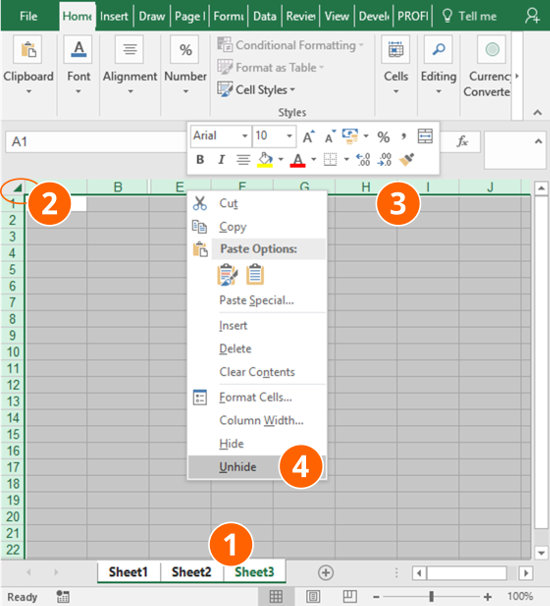
So, how to unhide all hidden rows?
Select the whole area in which you suspect hidden rows. Alternatively, select the whole worksheet in the top left corner. Now right-click on left-hand side with the row numbers (5) and click on “Unhide”.
Unhide all hidden rows and columns on all sheets at once
Do you want to show all hidden rows (and columns) on all the worksheets in your Excel file at the same time? It works almost the same way like for one worksheet except that you select all worksheets before.
- Select all worksheets with hidden rows or columns.
- Select all columns, either by clicking on the top-left corner or by pressing Ctrl + A on the keyboard.
- Right-click on any column header (the letters A, B, C on top of each column) if you want to unhide columns. Right-click on any row number on the left-hand side if you want to unhide rows.
- Click on “Unhide”.
The Grouping function (recommended)
Grouping rows (or columns) has a big advantage: A little plus sign is shown, when you group rows. Because of that you can immediately see which rows are hidden. The hide function on the other hand only shows a “double” line which is not obvious and you could miss it easily.
Follow these steps for applying grouping:
- Select the row or column you want to group.
- Click on “Group” on the Data ribbon. Alternatively, use the keyboard shortcut Alt + Shift + Arrow right for setting a Grouping or Alt + Shift + Arrow left for removing a Grouping
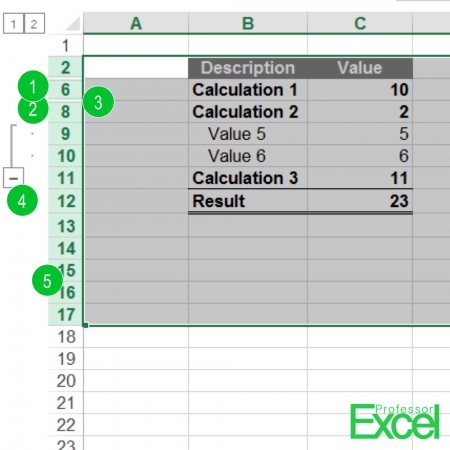
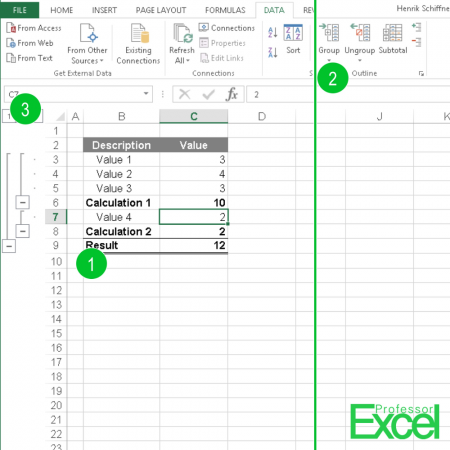
Grouping has one more feature: It allows you to set up Grouping levels. Let’s say, rows 3 to 5 and 7 are on level 2 and rows 6 and 8 (saying Calculation 1 and 2 in above picture) are level 2. If you press the small 1 in the top left corner, all groups on level 1 will be shown (see number 3 on the above picture).
Please note: If you run into some problems applying, opening, closing or removing grouping, please refer to these articles:
- Why I can’t add groupings to rows or columns in Excel?
- You can further define the direction of groupings: Do you want to set the grouping direction above or left of data in Excel?
Do you want to boost your productivity in Excel?
Get the Professor Excel ribbon!
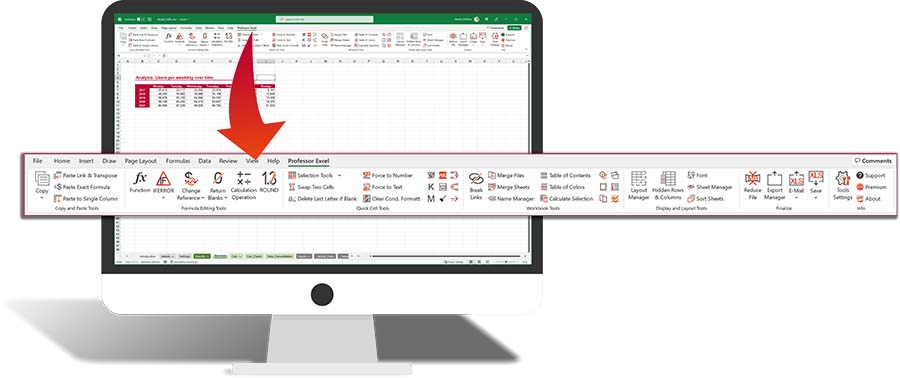
Add more than 120 great features to Excel!
Expand or close all grouping on all worksheets simultaneously
In many cases you want to collapse all groupings or expand them. For example, before sending out a workbook, you might want to close all groups so that the workbook looks more “tidy” on the first impression. There are two methods for achieving this.
Method 1: Use a VBA macro for collapsing or expanding grouping
The following two VBA macros can either collapse all groupings or expand them.
Use these lines of code for collapsing everything to grouping level 1 (minimum).
Sub CollapsToMinimum()
    Dim ws As Worksheet
    For Each ws In Worksheets
        ws.Outline.ShowLevels RowLevels:=1, ColumnLevels:=1
    Next ws
End Sub
If you want to expand to show all groupings, expand the row and column levels to number 8 like in the following VBA code.
Sub ExpandToMaximum()
    Dim ws As Worksheet
    For Each ws In Worksheets
        ws.Outline.ShowLevels RowLevels:=8, ColumnLevels:=8
    Next ws
End Sub
Copy and paste this VBA code into a new module and press play. If you need assistance, please refer to this article.
Method 2: Use “Professor Excel Tools” for grouping, ungrouping, hiding and unhiding
If you got a large Excel file, you might want to expand or close all groups to the same level at the same time on more than on worksheet. Or expand them the maximum level or collapse them to the minimum level. For such task we created a function in our Excel add-in ‘Professor Excel Tools‘.
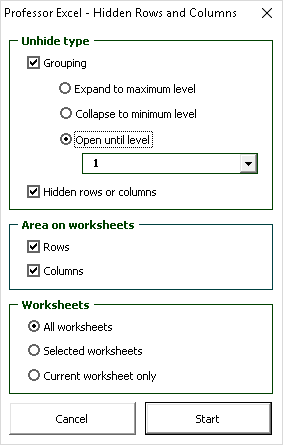
The function doesn’t only work on groupings, but also on hidden rows and columns:
- Define the grouping level: Minimum, maximum or the number of the level.
- Unhide all hidden rows or columns.
- Choose if you want to apply this action on rows, columns or both.
- Choose and which worksheets you want to use the hiding or unhiding action on: All worksheets, selected worksheets or the current worksheet only.
‘Professor Excel Tools’ is free to try. There are more than 120 other great functions included. You can download without any sign-up.

This function is included in our Excel Add-In ‘Professor Excel Tools’
(No sign-up, download starts directly)
In Microsoft Excel it is possible to group rows and columns. To expand or collapse a group you can use the VBA method called ShowLevels. In the example below we are expanding a row group. We have also disabled automatic recalculation to improve the performance.
' Show Level
Public Sub ShowGroupLevel(ByVal intRowLevel As Integer)
    Dim intCalculation As XlCalculation

    ' Get the old calculation state
    intCalculation = Application.Calculation

    ' Disable re-calculation
    Application.Calculation = xlCalculationManual

    ' Show the specified level (expanded)
    On Error Resume Next
    Call ActiveWorkSheet.Outline.ShowLevels(RowLevels:=intRowLevel)
    On Error GoTo 0

    ' Restore automatic calculation
    Application.Calculation = intCalculation
End Sub
Please notice that expand and collapse work in the same way. Collapsing a group is the same as only displaying the first level. Expand is the same as showing level 2 or more.
Related
- Get all the selected rows using Excel VBA
- Get Microsoft Excel

Ulf Emsoy
Ulf Emsoy has long working experience in project management, software development and supply chain management.
Back To Top
We use cookies on our website to give you the most relevant experience by remembering your preferences and repeat visits. By clicking “Accept All”, you consent to the use of ALL the cookies. However, you may visit «Cookie Settings» to provide a controlled consent.