Phil and I have teamed up on this workbench, which demonstrates how to create, read, update and delete information in Excel using T-SQL, from SQL Server. As always, the workbench is structured so that it can be pasted into Query Analyser and SSMS, and the individual examples executed – you can download the .sql from the “Code Download” link at the bottom of the article, load it up and start experimenting!
We start by showing you how to create an Excel Spreadsheet from SQL Server in TSQL(Transact SQL), create a worksheet, attach to it as a linked server, write to it, read from it, update it as if it was an ordinary SQL Server Database table, and then synchronise the data in the worksheet with SQL Server. We also illustrate the use of OPENQUERY, OPENDATASOURCE and OPENROWSET.
To create the Excel spreadsheet, we show how to attach to an ADODB source from SQL Server and execute SQL against that source. We then show you an alternative ‘quick cheat’ way (using sp_makewebtask) to create and populate an Excel spreadsheet from Transact SQL.
If you need more control over the Excel Spreadsheet that you are creating, we then show you how to do it via OLE automation. This will enable you to do anything you can do via keystrokes, and allow you to generate full Excel reports with pivot tables and Graphs.
Using this technique, you should be able to populate the data, or place data in particular calls or ranges. You can even do ‘macro substitutions’.
A word of caution before you start. If you have your security wide open, it is not just you who would be able to write out data as a spreadsheet. An intruder would be able to do it with that list of passwords or credit-card numbers. In a production system, this sort of operation needs to be properly ring-fenced. We tend to create a job queue and have a special user, with the appropriate permissions, on the Task Scheduler, to do anything that involves OLE automation or xp_CMDShell. Security precautions can get quite complex, but they are outside the scope of the article.
Some of what we illustrate can be done using DTS or SSIS. Unfortunately, these are outside the scope of this article. In fact, transferring data between Excel and SQL Server can be done in a surprising variety of ways and it would be fun one day to try to list them all.
|
1 2 3 4 5 6 7 8 9 10 11 12 13 14 15 16 17 18 19 20 21 22 23 24 25 26 27 28 29 30 31 32 33 34 35 36 37 38 39 |
CREATE TABLE ##CambridgePubs (Pubname VARCHAR(40), Address VARCHAR(80), Postcode VARCHAR(8)) INSERT INTO ##CambridgePubs (PubName, Address, Postcode) SELECT ‘Bees In The Wall’,’36 North Road, Whittlesford, Cambridge’,‘CB2 4NZ’ INSERT INTO ##CambridgePubs (PubName, Address, Postcode) SELECT ‘Blackamoors Head’,‘205 Victoria Road, Cambridge’,‘CB4 3LF’ INSERT INTO ##CambridgePubs (PubName, Address, Postcode) SELECT ‘Blue Lion’,‘2 Horningsea Road, Fen Ditton, Cambridge’,‘CB5 8SZ’ INSERT INTO ##CambridgePubs (PubName, Address, Postcode) SELECT ‘Cambridge Blue’,’85-87 Gwydir Street, Cambridge’,‘CB1 2LG’ INSERT INTO ##CambridgePubs (PubName, Address, Postcode) SELECT ‘Champion Of The Thames’,’68 King Street, Cambridge’,‘CB1 1LN’ INSERT INTO ##CambridgePubs (PubName, Address, Postcode) SELECT ‘Cross Keys’,’77 Ermine Street, Caxton, Cambridge’,‘CB3 8PQ’ INSERT INTO ##CambridgePubs (PubName, Address, Postcode) SELECT ‘Crown Inn’,’11 High Street, Linton, Cambridge’,‘CB1 6HS’ INSERT INTO ##CambridgePubs (PubName, Address, Postcode) SELECT ‘Devonshire Arms’,‘1 Devonshire Road, Cambridge’,‘CB1 2BH’ INSERT INTO ##CambridgePubs (PubName, Address, Postcode) SELECT ‘Duke Of Argyle’,’90 Argyle Street, Cambridge’,‘CB1 3LS’ INSERT INTO ##CambridgePubs (PubName, Address, Postcode) SELECT ‘Duke Of Wellington’,’49 Alms Hill, Bourn, Cambridge’,‘CB3 7SH’ INSERT INTO ##CambridgePubs (PubName, Address, Postcode) SELECT ‘Eagle Public House’,‘Benet Street, Cambridge’,‘CB2 3QN’ |
And so on. (The full import file is in the ZIP, as is the Excel file!).
Create the table and then execute the contents of CambridgePubs.SQL.
First, we need to create the spreadsheet with the correct headings (PubName, Address, PostCode).
There are two possible ways one might do this. The most obvious way is using the CREATE statement to create the worksheet and define the columns, but there seems to be no way of doing this by linking the Excel file, unless the Excel file already exists. We need a utility stored procedure to get at ADODB in order to create databases and execute DDL and SQL against it.
|
1 2 3 4 5 6 7 8 9 10 11 12 13 14 15 16 17 18 19 20 21 22 23 24 25 26 27 28 29 30 31 32 33 34 35 36 37 38 39 40 41 42 43 44 45 46 47 48 49 50 51 52 53 54 55 56 57 58 |
CREATE PROCEDURE spExecute_ADODB_SQL @DDL VARCHAR(2000), @DataSource VARCHAR(100), @Worksheet VARCHAR(100)=NULL, @ConnectionString VARCHAR(255) = ‘Provider=Microsoft.Jet.OLEDB.4.0; Data Source=%DataSource; Extended Properties=Excel 8.0′ AS DECLARE @objExcel INT, @hr INT, @command VARCHAR(255), @strErrorMessage VARCHAR(255), @objErrorObject INT, @objConnection INT, @bucket INT SELECT @ConnectionString =REPLACE (@ConnectionString, ‘%DataSource’, @DataSource) IF @Worksheet IS NOT NULL SELECT @DDL=REPLACE(@DDL,‘%worksheet’,@Worksheet) SELECT @strErrorMessage=‘Making ADODB connection ‘, @objErrorObject=NULL EXEC @hr=sp_OACreate ‘ADODB.Connection’, @objconnection OUT IF @hr=0 SELECT @strErrorMessage=‘Assigning ConnectionString property «‘ + @ConnectionString + ‘»‘, @objErrorObject=@objconnection IF @hr=0 EXEC @hr=sp_OASetProperty @objconnection, ‘ConnectionString’, @ConnectionString IF @hr=0 SELECT @strErrorMessage =‘Opening Connection to XLS, for file Create or Append’ IF @hr=0 EXEC @hr=sp_OAMethod @objconnection, ‘Open’ IF @hr=0 SELECT @strErrorMessage =‘Executing DDL «‘+@DDL+‘»‘ IF @hr=0 EXEC @hr=sp_OAMethod @objconnection, ‘Execute’, @Bucket out , @DDL IF @hr<>0 BEGIN DECLARE @Source VARCHAR(255), @Description VARCHAR(255), @Helpfile VARCHAR(255), @HelpID INT EXECUTE sp_OAGetErrorInfo @objErrorObject, @source output, @Description output,@Helpfile output,@HelpID output SELECT @strErrorMessage=‘Error whilst ‘ +COALESCE(@strErrorMessage,‘doing something’)+‘, ‘ +COALESCE(@Description,») RAISERROR (@strErrorMessage,16,1) END EXEC @hr=sp_OADestroy @objconnection GO |
Now we have it, it is easy.
The Excel file will have been created on the Database server of the database you currently have a connection to.
We can now link to the created Excel file as follows.
As we are directly manipulating the Excel data in the worksheet as if it was a table we can do JOINs.
To try this out, you’ll need to DELETE, ALTER and INSERT a few rows from the Excel spreadsheet, remembering to close it after you’ve done it.
Firstly, we’ll delete any rows from ##CambridgePubs that do not exist in the Excel spreadsheet.
Then we insert into ##CambridgePubs any rows in the spreadsheet that don’t exist in ##CambridgePubs.
All done (reverse syncronisation would be similar).
You can read and write to the Excel sheet using OpenRowSet, if the mood takes you.
Instead of creating the Excel spreadsheet with OLEDB One can use the sp_makewebtask.
Users must have SELECT permissions to run a specified query and CREATE PROCEDURE permissions in the database in which the query will run. The SQL Server account must have permissions to write the generated HTML document to the specified location. Only members of the sysadmin server role can impersonate other users.
This is fine for distributing information from databases but no good if you subsequently want to open it via ODBC.
So far, so good. However, we really want rather more than this. When we create an Excel file for a business report, we want the data and we also want nice formatting, defined ranges, sums, calculated fields and pretty graphs. If we do financial reporting, we want a pivot table and so on in order to allow a degree of data mining by the recipient. A different approach is required.
We can, of course, use Excel to extract the data from the database. However, in this example, we’ll create a spreadsheet, write the data into it, fit the columns nicely and define a range around the data.
|
1 2 3 4 5 6 7 8 9 10 11 12 13 14 15 16 17 18 19 20 21 22 23 24 25 26 27 28 29 30 31 32 33 34 35 36 37 38 39 40 41 42 43 44 45 46 47 48 49 50 51 52 53 54 55 56 57 58 59 60 61 62 63 64 65 66 67 68 69 70 71 72 73 74 75 76 77 78 79 80 81 82 83 84 85 86 87 88 89 90 91 92 93 94 95 96 97 98 99 100 101 102 103 104 105 106 107 108 109 110 111 112 113 114 115 116 117 118 119 120 121 122 123 124 125 126 127 128 129 130 131 132 133 134 135 136 137 138 139 140 141 142 143 144 145 146 147 148 149 150 151 152 153 154 155 156 157 158 159 160 161 162 163 164 165 166 167 168 169 170 171 172 173 174 175 176 177 178 179 180 181 182 183 184 185 186 187 188 189 190 191 192 193 194 195 196 197 198 199 200 201 202 203 204 205 206 207 208 209 210 211 212 213 214 215 216 217 218 219 220 221 222 223 224 225 226 227 228 229 230 231 232 233 234 235 236 237 238 239 240 241 242 243 244 245 246 247 248 249 250 251 252 253 254 255 256 257 258 259 260 261 262 263 264 265 266 267 268 269 270 271 272 273 274 275 276 277 278 |
*/ ALTER PROCEDURE [dbo].[spDMOExportToExcel] ( @SourceServer VARCHAR(30), @SourceUID VARCHAR(30)=NULL, @SourcePWD VARCHAR(30)=NULL, @QueryText VARCHAR(200), @filename VARCHAR(100), @WorksheetName VARCHAR(100)=‘Worksheet’, @RangeName VARCHAR(80)=‘MyRangeName’ ) AS DECLARE @objServer INT, @objQueryResults INT, @objCurrentResultSet INT, @objExcel INT, @objWorkBooks INT, @objWorkBook INT, @objWorkSheet INT, @objRange INT, @hr INT, @Columns INT, @Rows INT, @Output INT, @currentColumn INT, @currentRow INT, @ResultSetRow INT, @off_Column INT, @off_Row INT, @command VARCHAR(255), @ColumnName VARCHAR(255), @value VARCHAR(255), @strErrorMessage VARCHAR(255), @objErrorObject INT, @Alphabet VARCHAR(27) SELECT @Alphabet=‘ABCDEFGHIJKLMNOPQRSTUVWXYZ’ IF @QueryText IS NULL BEGIN RAISERROR (‘A query string is required for spDMOExportToExcel’,16,1) RETURN 1 END — Sets the server to the local server IF @SourceServer IS NULL SELECT @SourceServer = @@servername SET NOCOUNT ON SELECT @strErrorMessage = ‘instantiating the DMO’, @objErrorObject=@objServer EXEC @hr= sp_OACreate ‘SQLDMO.SQLServer’, @objServer OUT IF @SourcePWD IS NULL OR @SourceUID IS NULL BEGIN —use a trusted connection IF @hr=0 SELECT @strErrorMessage= ‘Setting login to windows authentication on ‘ +@SourceServer, @objErrorObject=@objServer IF @hr=0 EXEC @hr=sp_OASetProperty @objServer, ‘LoginSecure’, 1 IF @hr=0 SELECT @strErrorMessage= ‘logging in to the requested server using windows authentication on ‘ +@SourceServer IF @SourceUID IS NULL AND @hr=0 EXEC @hr=sp_OAMethod @objServer, ‘Connect’, NULL, @SourceServer IF @SourceUID IS NOT NULL AND @hr=0 EXEC @hr=sp_OAMethod @objServer, ‘Connect’, NULL, @SourceServer ,@SourceUID END ELSE BEGIN IF @hr=0 SELECT @strErrorMessage = ‘Connecting to ‘»+@SourceServer+ »‘ with user ID ‘»+@SourceUID+»», @objErrorObject=@objServer IF @hr=0 EXEC @hr=sp_OAMethod @objServer, ‘Connect’, NULL, @SourceServer, @SourceUID, @SourcePWD END —now we execute the query IF @hr=0 SELECT @strErrorMessage=‘executing the query «‘ +@querytext+‘», on ‘+@SourceServer, @objErrorObject=@objServer, @command = ‘ExecuteWithResults(«‘ + @QueryText + ‘»)’ IF @hr=0 EXEC @hr=sp_OAMethod @objServer, @command, @objQueryResults OUT IF @hr=0 SELECT @strErrorMessage=‘getting the first result set for «‘ +@querytext+‘», on ‘+@SourceServer, @objErrorObject=@objQueryResults IF @hr=0 EXEC @hr=sp_OAMethod @objQueryResults, ‘CurrentResultSet’, @objCurrentResultSet OUT IF @hr=0 SELECT @strErrorMessage=‘getting the rows and columns «‘ +@querytext+‘», on ‘+@SourceServer IF @hr=0 EXEC @hr=sp_OAMethod @objQueryResults, ‘Columns’, @Columns OUT IF @hr=0 EXEC @hr=sp_OAMethod @objQueryResults, ‘Rows’, @Rows OUT —so now we have the queryresults. We start up Excel IF @hr=0 SELECT @strErrorMessage=‘Creating the Excel Application, on ‘ +@SourceServer, @objErrorObject=@objExcel IF @hr=0 EXEC @hr=sp_OACreate ‘Excel.Application’, @objExcel OUT IF @hr=0 SELECT @strErrorMessage=‘Getting the WorkBooks object ‘ IF @hr=0 EXEC @hr=sp_OAGetProperty @objExcel, ‘WorkBooks’, @objWorkBooks OUT —create a workbook IF @hr=0 SELECT @strErrorMessage=‘Adding a workbook ‘, @objErrorObject=@objWorkBooks IF @hr=0 EXEC @hr=sp_OAGetProperty @objWorkBooks, ‘Add’, @objWorkBook OUT —and a worksheet IF @hr=0 SELECT @strErrorMessage=‘Adding a worksheet ‘, @objErrorObject=@objWorkBook IF @hr=0 EXEC @hr=sp_OAGetProperty @objWorkBook, ‘worksheets.Add’, @objWorkSheet OUT IF @hr=0 SELECT @strErrorMessage=‘Naming a worksheet as «‘ +@WorksheetName+‘»‘, @objErrorObject=@objWorkBook IF @hr=0 EXEC @hr=sp_OASetProperty @objWorkSheet, ‘name’, @WorksheetName SELECT @currentRow = 1 —so let’s write out the column headings SELECT @currentColumn = 1 WHILE (@currentColumn <= @Columns AND @hr=0) BEGIN IF @hr=0 SELECT @strErrorMessage=‘getting column heading ‘ +LTRIM(STR(@currentcolumn)) , @objErrorObject=@objQueryResults, @Command=‘ColumnName(‘ +CONVERT(VARCHAR(3),@currentColumn)+‘)’ IF @hr=0 EXEC @hr=sp_OAGetProperty @objQueryResults, @command, @ColumnName OUT IF @hr=0 SELECT @strErrorMessage=‘assigning the column heading ‘+ + LTRIM(STR(@currentColumn)) + ‘ from the query string’, @objErrorObject=@objExcel, @command=‘Cells(‘+LTRIM(STR(@currentRow)) +‘, ‘ + LTRIM(STR(@CurrentColumn))+‘).value’ IF @hr=0 EXEC @hr=sp_OASetProperty @objExcel, @command, @ColumnName SELECT @currentColumn = @currentColumn + 1 END —format the headings in Bold nicely IF @hr=0 SELECT @strErrorMessage=‘formatting the column headings in bold ‘, @objErrorObject=@objWorkSheet, @command=‘Range(«A1:’ +SUBSTRING(@alphabet,@currentColumn/26,1) +SUBSTRING(@alphabet,@currentColumn % 26,1) +‘1’+‘»).font.bold’ IF @hr=0 EXEC @hr=sp_OASetProperty @objWorkSheet, @command, 1 —now we write out the data SELECT @currentRow = 2 WHILE (@currentRow <= @Rows+1 AND @hr=0) BEGIN SELECT @currentColumn = 1 WHILE (@currentColumn <= @Columns AND @hr=0) BEGIN IF @hr=0 SELECT @strErrorMessage= ‘getting the value from the query string’ + LTRIM(STR(@currentRow)) +‘,’ + LTRIM(STR(@currentRow))+‘)’, @objErrorObject=@objQueryResults, @ResultSetRow=@CurrentRow—1 IF @hr=0 EXEC @hr=sp_OAMethod @objQueryResults, ‘GetColumnString’, @value OUT, @ResultSetRow, @currentColumn IF @hr=0 SELECT @strErrorMessage= ‘assigning the value from the query string’ + LTRIM(STR(@CurrentRow—1)) +‘, ‘ + LTRIM(STR(@currentcolumn))+‘)’ , @objErrorObject=@objExcel, @command=‘Cells(‘+STR(@currentRow) +‘, ‘ + STR(@CurrentColumn)+‘).value’ IF @hr=0 EXEC @hr=sp_OASetProperty @objExcel, @command, @value SELECT @currentColumn = @currentColumn + 1 END SELECT @currentRow = @currentRow + 1 END —define the name range —Cells(1, 1).Resize(10, 5).Name = «TheData» IF @hr=0 SELECT @strErrorMessage=‘assigning a name to a range ‘ + LTRIM(STR(@CurrentRow—1)) +‘, ‘ + LTRIM(STR(@currentcolumn—1))+‘)’ , @objErrorObject=@objExcel, @command=‘Cells(1, 1).Resize(‘+STR(@currentRow—1) +‘, ‘ + STR(@CurrentColumn—1)+‘).Name’ IF @hr=0 EXEC @hr=sp_OASetProperty @objExcel, @command, @RangeName —Now autofilt the columns we’ve written to IF @hr=0 SELECT @strErrorMessage=‘Auto-fit the columns ‘, @objErrorObject=@objWorkSheet, @command=‘Columns(«A:’ +SUBSTRING(@alphabet,(@Columns / 26),1) +SUBSTRING(@alphabet,(@Columns % 26),1)+ ‘»).autofit’ IF @hr=0 —insert into @bucket(bucket) EXEC @hr=sp_OAMethod @objWorkSheet, @command, @output out IF @hr=0 SELECT @command =‘del «‘ + @filename + ‘»‘ IF @hr=0 EXECUTE master..xp_cmdshell @Command, no_output IF @hr=0 SELECT @strErrorMessage=‘Saving the workbook as «‘+@filename+‘»‘, @objErrorObject=@objRange, @command = ‘SaveAs(«‘ + @filename + ‘»)’ IF @hr=0 EXEC @hr=sp_OAMethod @objWorkBook, @command IF @hr=0 SELECT @strErrorMessage=‘closing Excel ‘, @objErrorObject=@objExcel EXEC @hr=sp_OAMethod @objWorkBook, ‘Close’ EXEC sp_OAMethod @objExcel, ‘Close’ IF @hr<>0 BEGIN DECLARE @Source VARCHAR(255), @Description VARCHAR(255), @Helpfile VARCHAR(255), @HelpID INT EXECUTE sp_OAGetErrorInfo @objErrorObject, @source output,@Description output, @Helpfile output,@HelpID output SELECT @hr, @source, @Description,@Helpfile,@HelpID output SELECT @strErrorMessage=‘Error whilst ‘ +COALESCE(@strErrorMessage,‘doing something’) +‘, ‘+COALESCE(@Description,») RAISERROR (@strErrorMessage,16,1) END EXEC sp_OADestroy @objServer EXEC sp_OADestroy @objQueryResults EXEC sp_OADestroy @objCurrentResultSet EXEC sp_OADestroy @objExcel EXEC sp_OADestroy @objWorkBookks EXEC sp_OADestroy @objWorkBook EXEC sp_OADestroy @objRange RETURN @hr |
Now we can create our pubs spreadsheet, and can do it from any of our servers.
Although this is a very handy stored procedure, you’ll probably need to modify and add to it for particular purposes.
We use the DMO method because we like to dump build data into Excel spreadsheets e.g. users, logins, Job Histories. However, an ADODB version is very simple to do and can be made much faster for reads and writes.
We have just inserted values, but you can insert formulae and formatting numberformat) and create or change borders. You can, in fact, manipulate the spreadsheet in any way you like. When we do this, we record macros in Excel and then convert these macros to TSQL! Using the above example, it should be simple.
Introduction
A few weeks back I had been working on an interesting proof of concept for a client within the food / grocery industry. The objectives were to be able to provide the client with information on sales patterns, seasonal trends and location profitability. The client was an accountant and was therefore comfortable utilizing spreadsheets. This said, I felt that this was a super opportunity to build our proof of concept utilizing a SQL Server Tabular Solution and by exploiting the capabilities of Excel and Power Reporting for the front end.
In today’s “fire side chat” we shall be examining how this proof of concept was created and we shall get a flavour of the report types that may be generated, simply by utilizing Excel.
In the second and final part of this article, we shall be examining the power of utilizing SQL Server Reporting Services 2016 to generate user reports.
However, before getting carried away with Reporting Services, let us look at the task at hand, that being to work with the tabular model and Excel Power Reporting.
Thus, let’s get started.
Getting Started
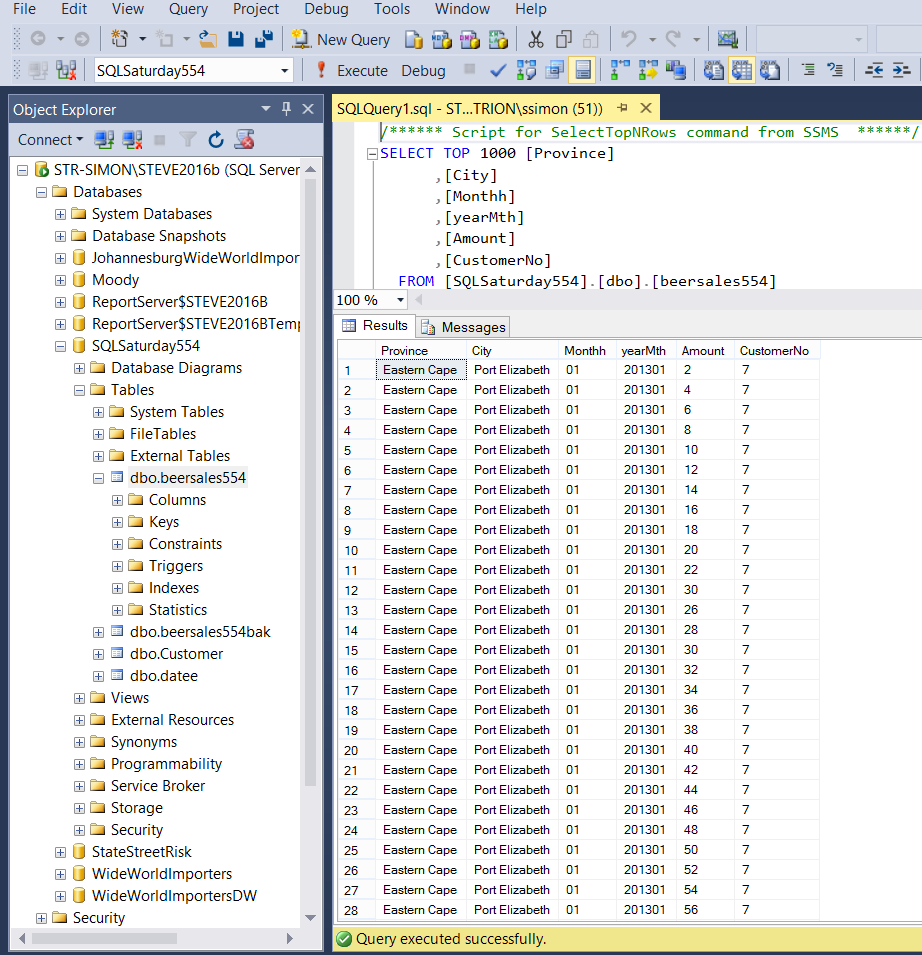
Our journey begins with the raw data. Opening SQL Server Management Studio 2016, we locate a database which I have called SQLSaturday554. In the screenshot below, the reader will note that we have the beer sales from major South Africa cities for several years.
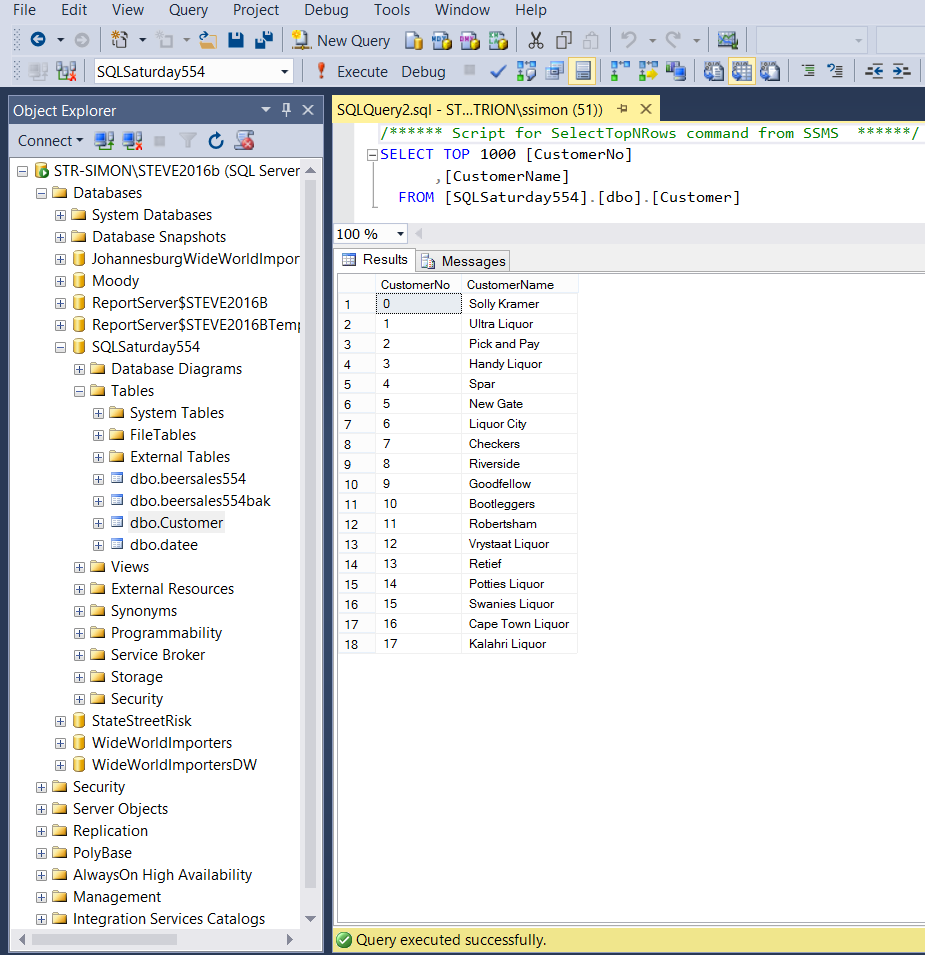
We also have customer data within our “Customer” table (see below).
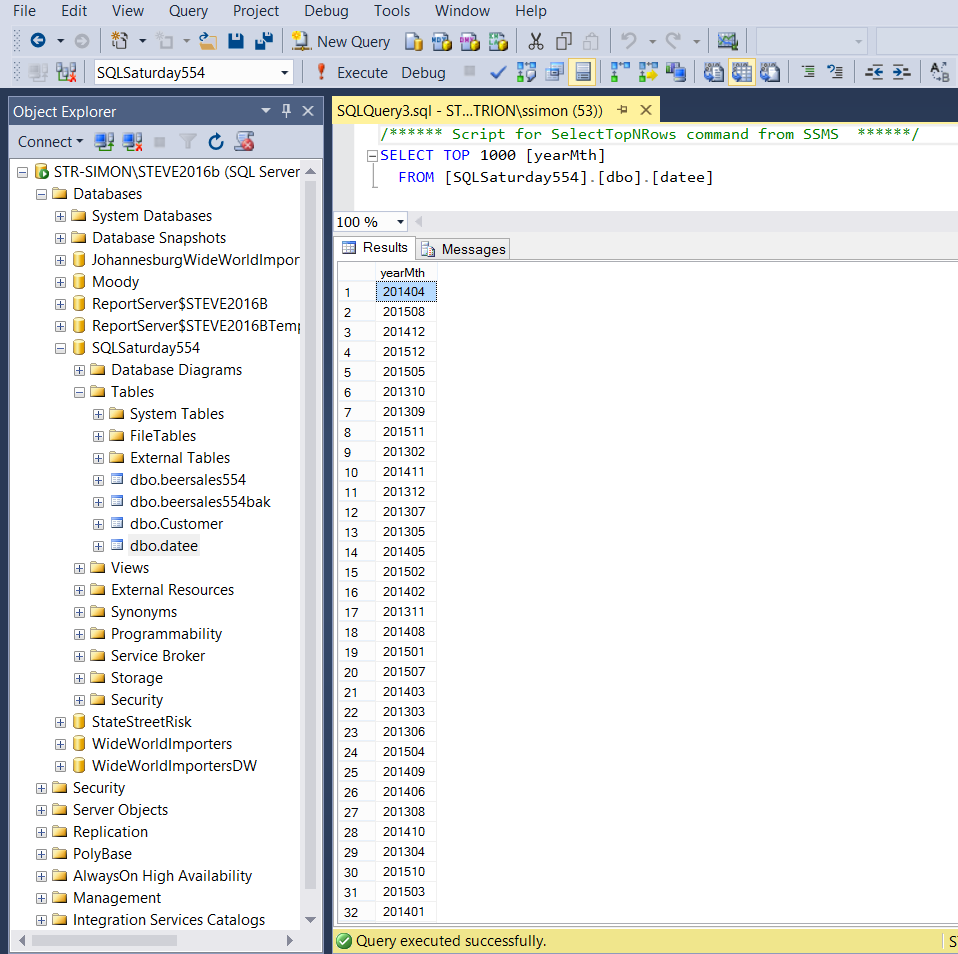
Last but not least, we have a “year month calendar table” (to add a time dimension) to our exercise (see below).
For our exercise, we shall be working with these three tables.
Creating our tabular model
Should you not have a tabular instance installed upon your work server, you may want to install one from the media supplied from Microsoft. One merely adds another instance and select ONLY the Analysis Services option and then the “Tabular” option. The install is fairly quick.
Should you be unfamiliar with the Tabular Model itself, fear not as we shall be working our way through the whole process, step by step.
From this point on I shall assume that we all have a tabular instance installed upon our work servers.
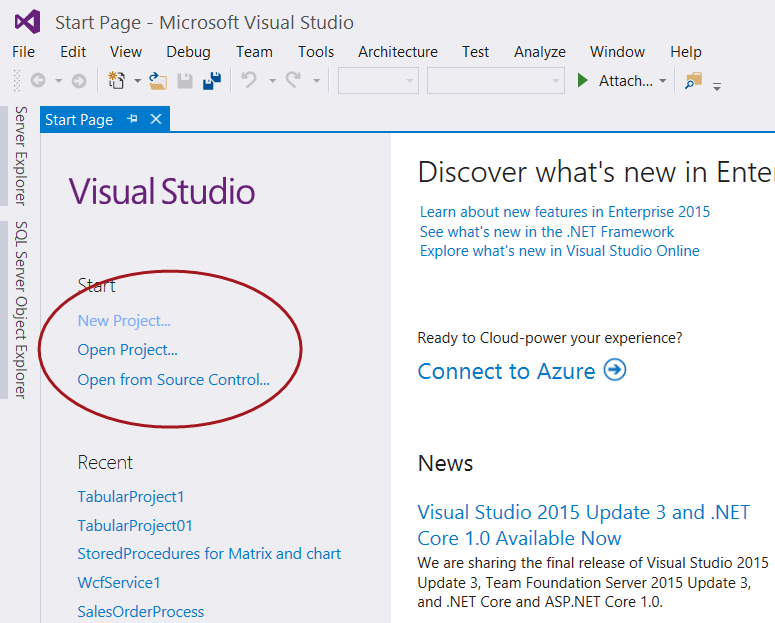
Opening Visual Studio 2015 or SQL Server Data Tools (2010 and above) we create a new project by selecting “New Project” under the Start banner as shown below.
The “Project Type” menu is brought up (see below).
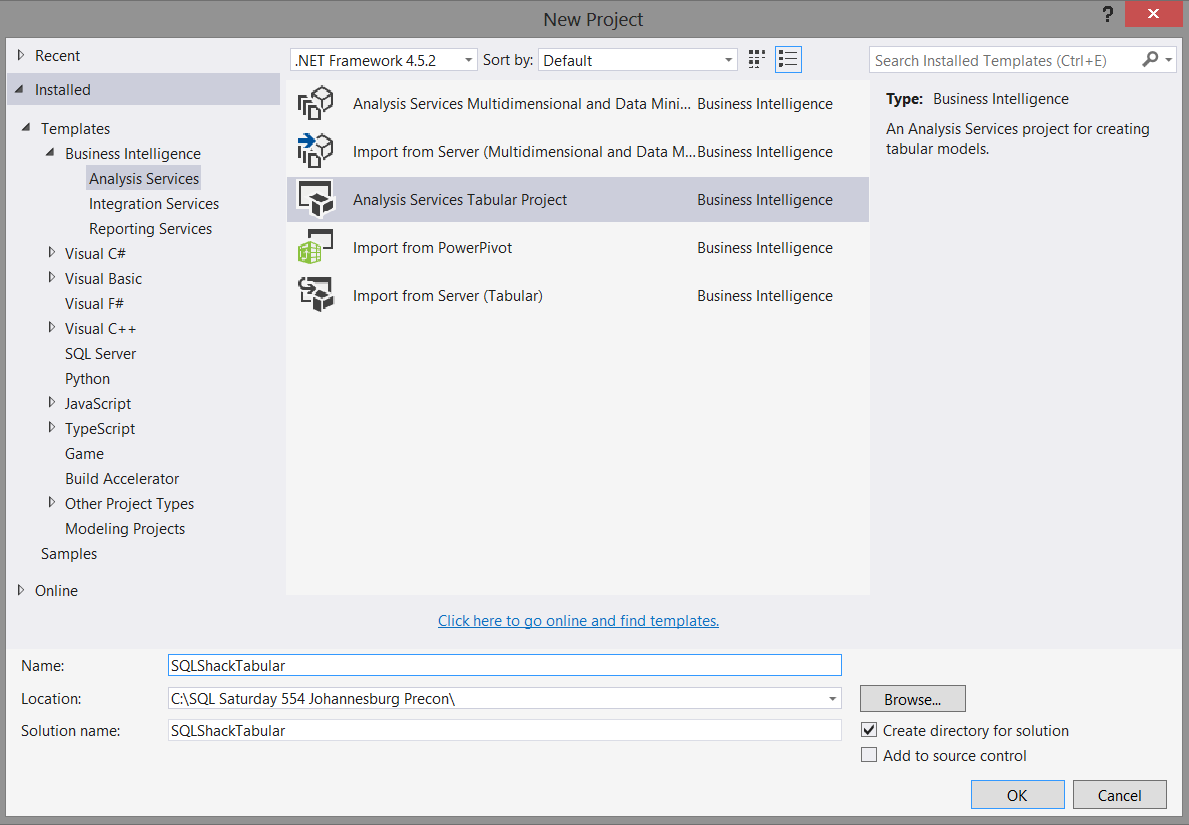
We select an “Analysis Services Tabular Project” project (as shown above) and give our project an appropriate name. We click “OK” to create our project.
The “Tabular Model Designer” now appears (see below).
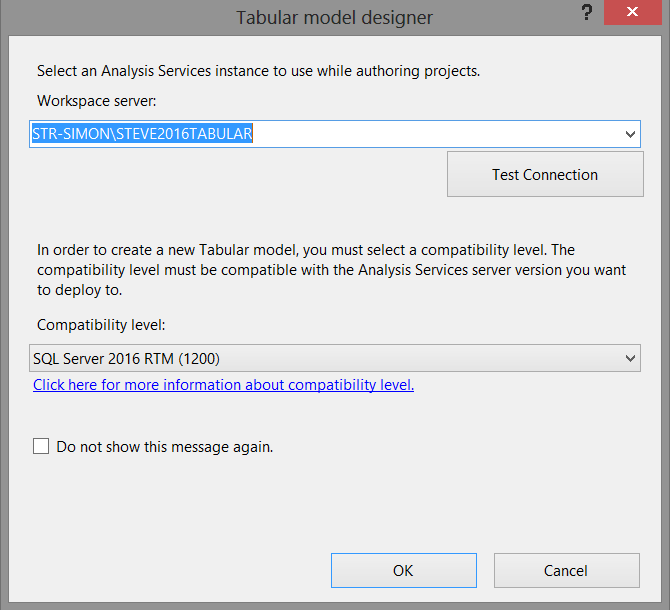
What the project wishes to know is to which TABULAR server and workspace we wish to deploy our model. We must remember that whilst our source data originates from standard relational database tables (for our current exercise), the project itself and the reporting will be based off data within Analysis Services.
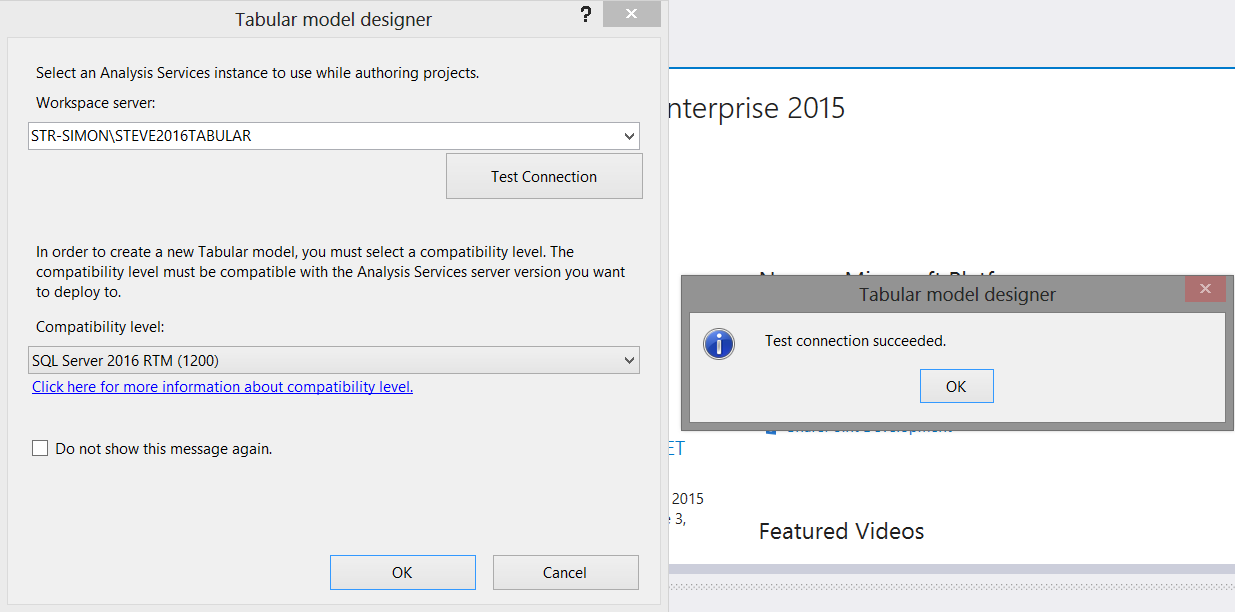
We set the “Workspace Server” and test the connection as shown above. We click OK to create the model and we are then brought to our design and work surface (see below).
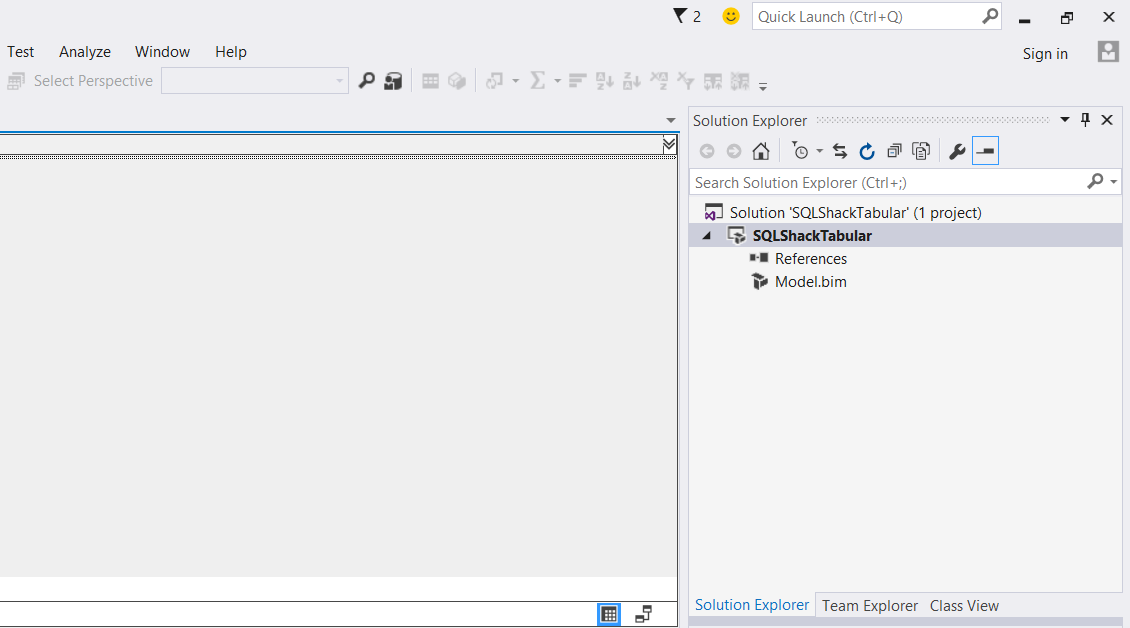
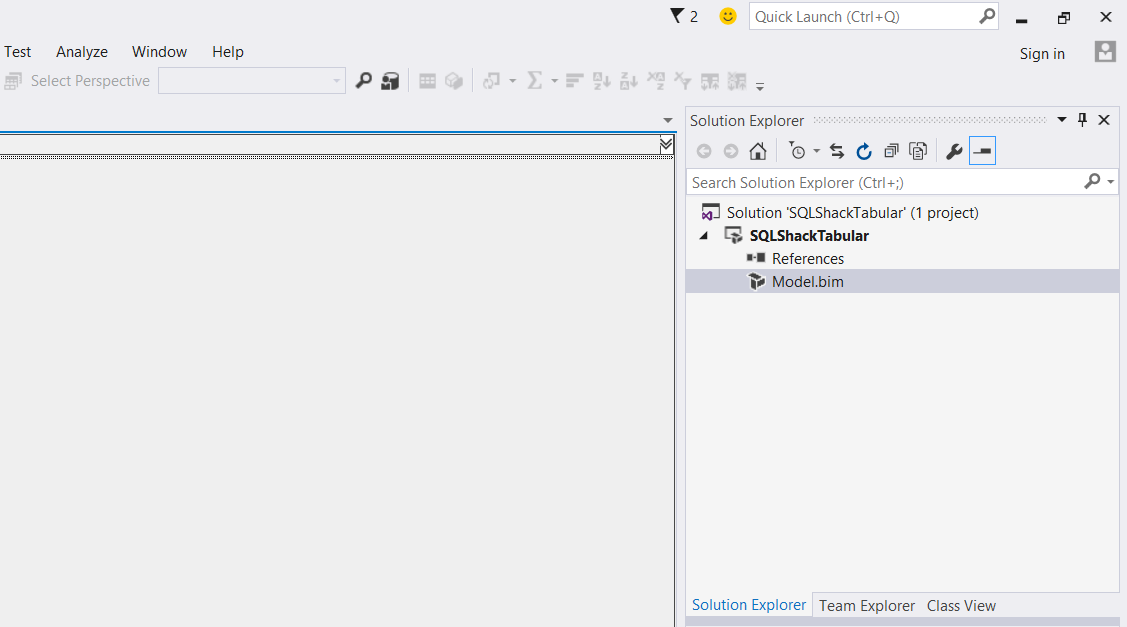
We now double click on the “Model.bim” icon, shown in the screen shot below.
The model designer opens (see below).
Adding data to our model
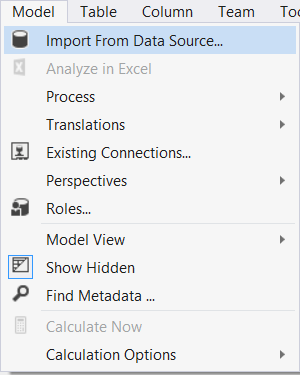
Clicking upon the “Model” tab on the menu ribbon (see below) we select “Import from Data Source”.
The “Table Import Wizard” appears (see below).
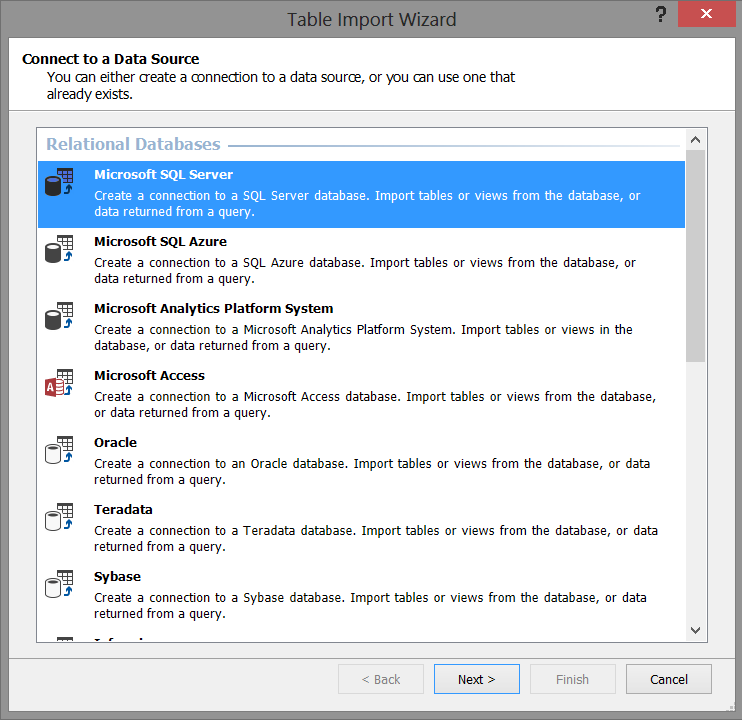
We select “Microsoft SQL Server” as shown above because our source data is from the relational database tables that we saw above. We then click “Next”.
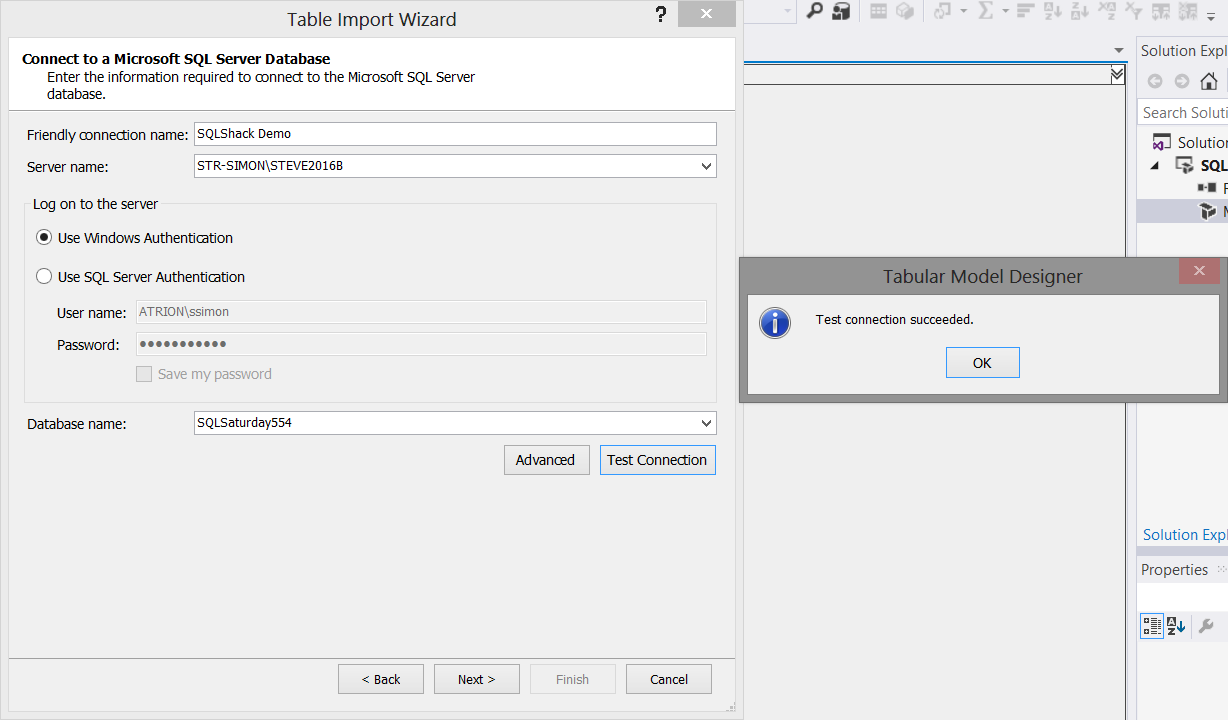
We now select our “source” database server, our database and test our connection (see above). Once again, we click “Next”.
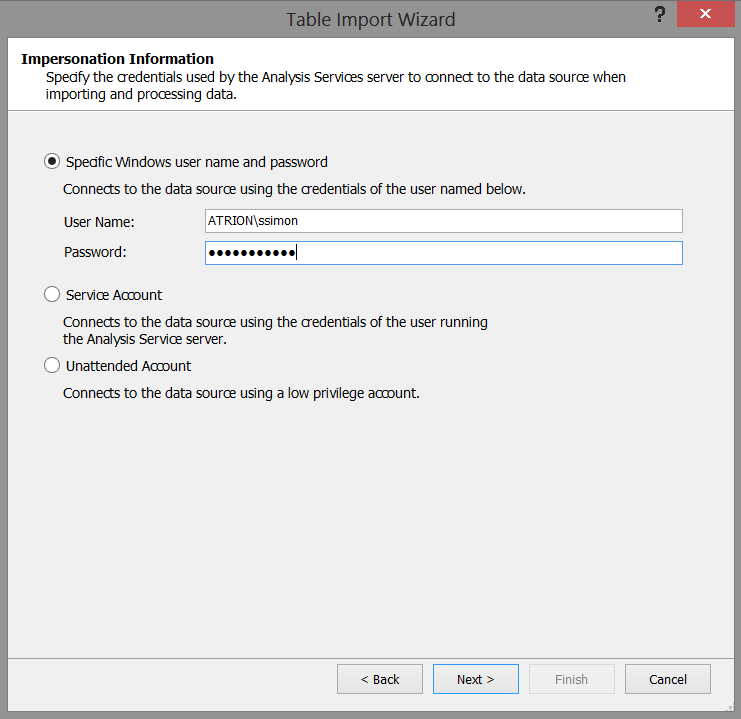
We must now set out “Impersonation Information” (see the screenshot above). In our case I have chosen to utilize a specific Windows user name and password. Once set, we click “Next”.
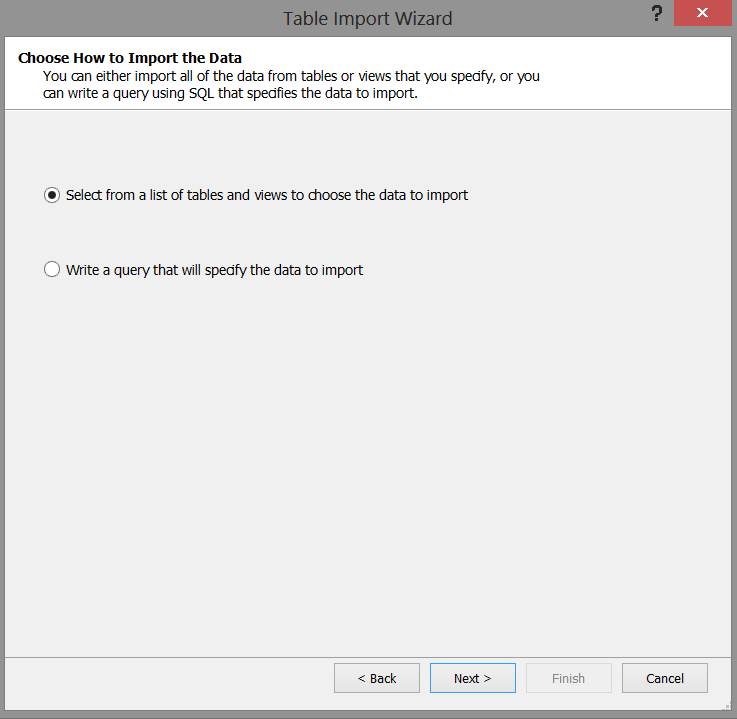
The system now wants us to select the relational tables that we wish to import into our model. We select the “Select from a list of tables and views to choose the data to import” option (see above). We then click “Next”.
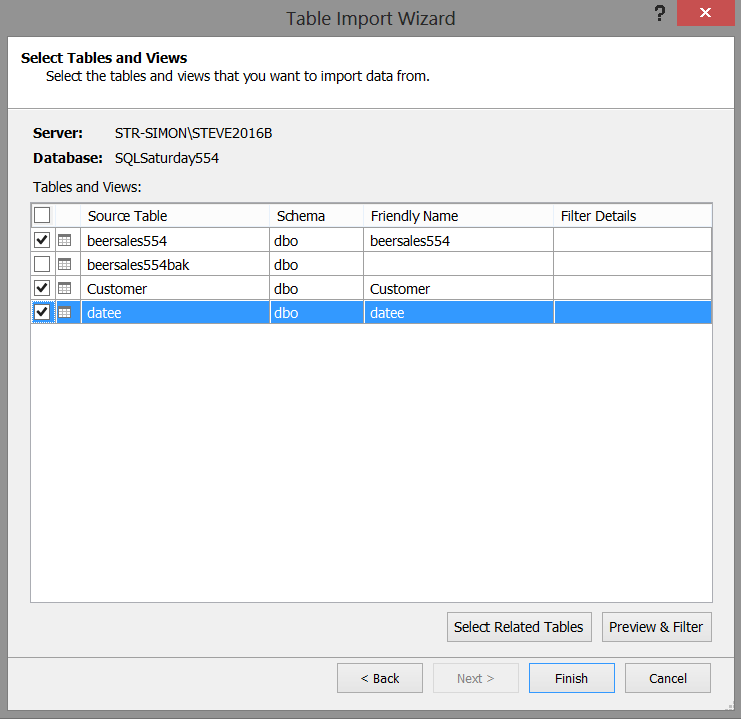
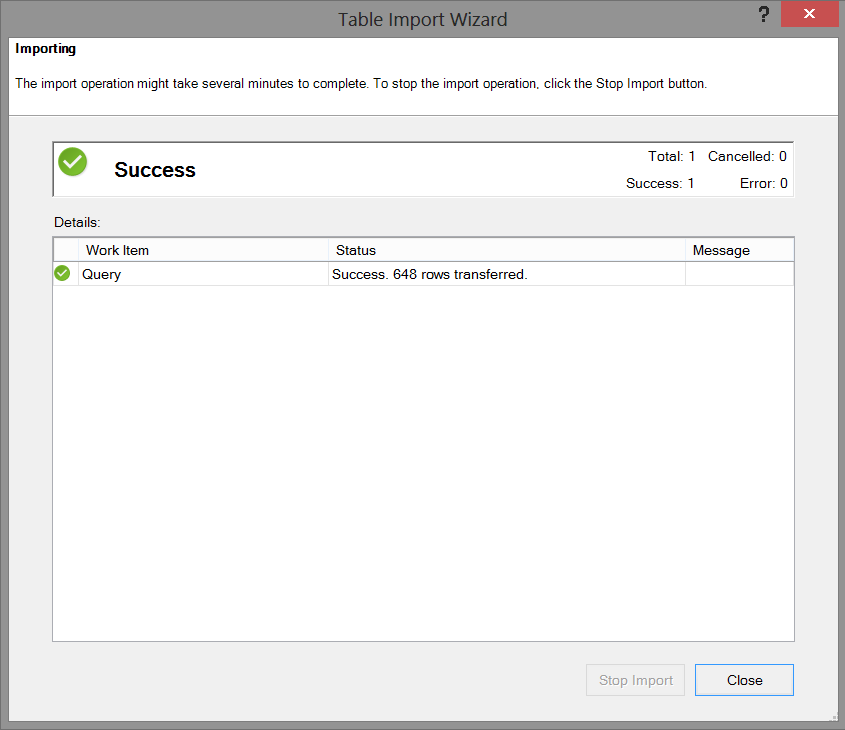
We select the “beersales554” (Our sales figures), “Customer” (our list of clients), and “datee” (our time dimension) tables (see above) and then click “Finish”. The project will then begin the import into our model (see below).
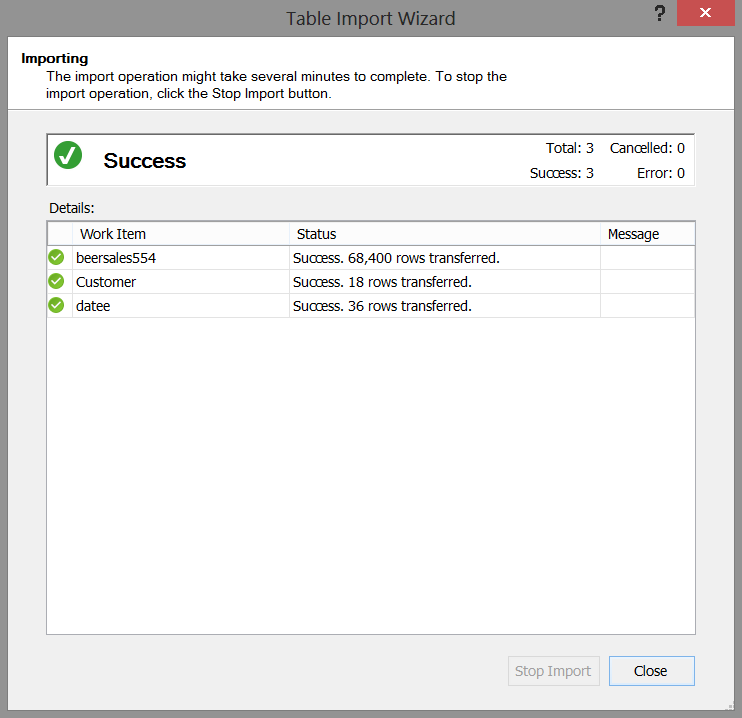
Should our load was successful, then we receive the message shown above. We now click “Close”.
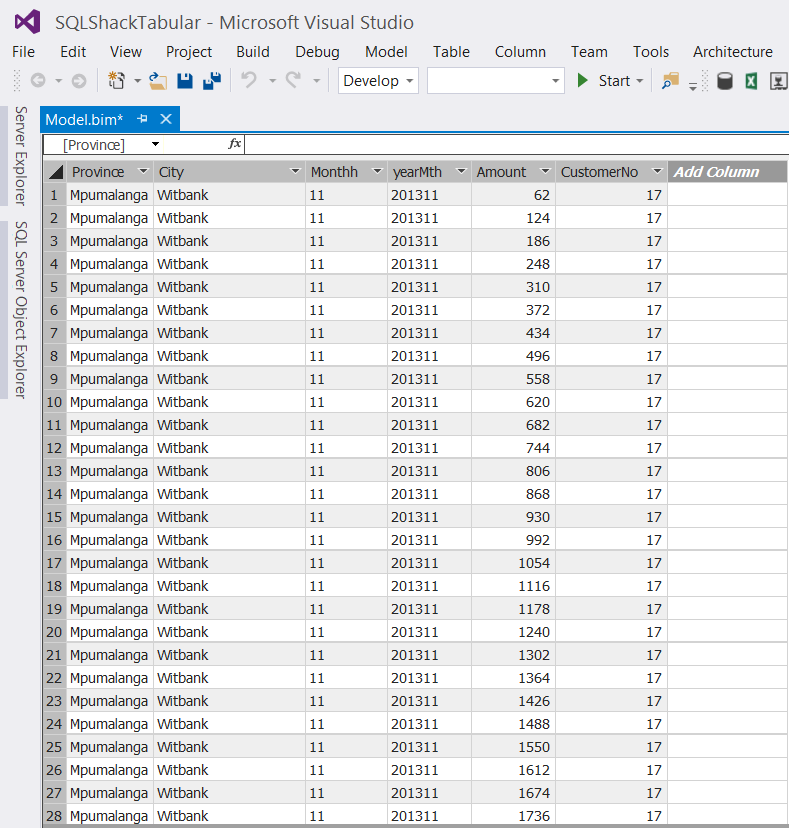
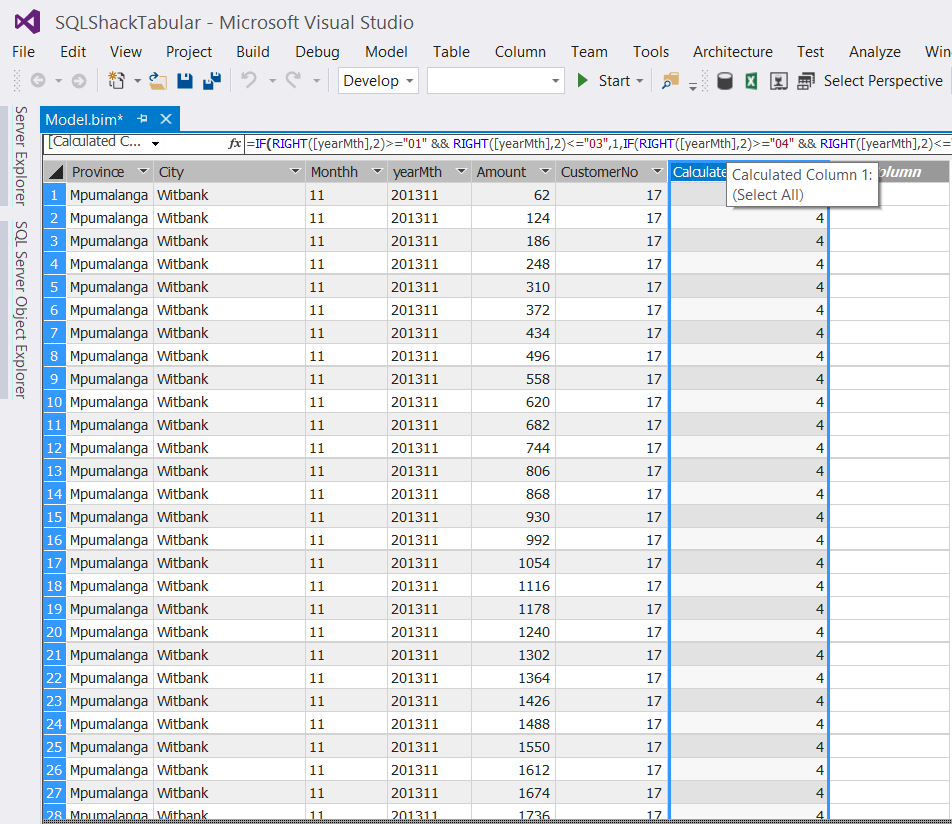
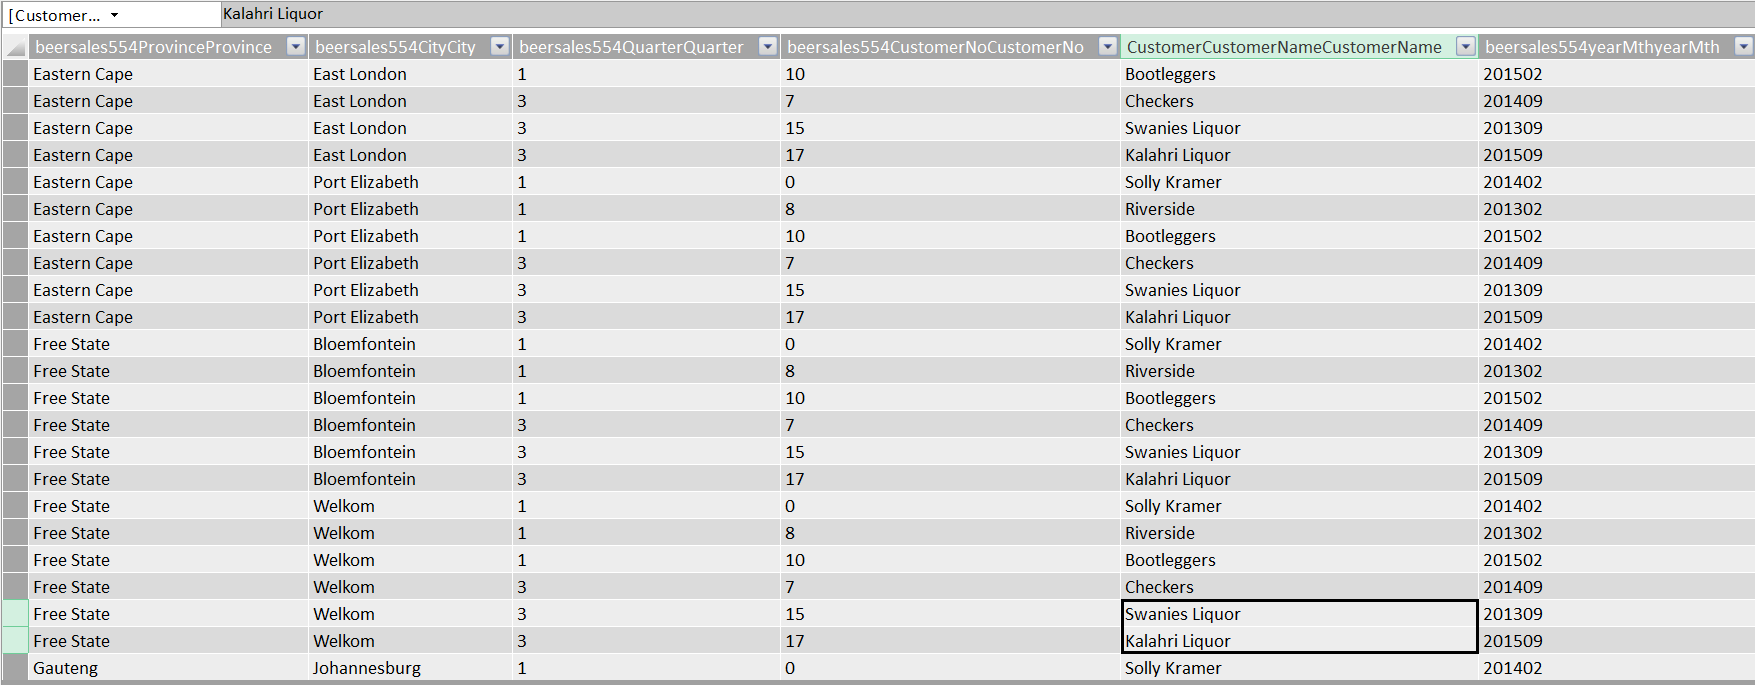
Our data will now appear within our design window (see the screenshot above). WOW, it looks like a spreadsheet. Those finance folks are going to love this!
Let the fun begin!!
The astute reader will note that in addition to the “Province”, “City” and “CustomerNo”, we also have a “yearmth” field and a field containing the Rand value of beer sales.
This breakdown is on a monthly basis and oft times folks wish to see results by quarter. GOTCHA!!!!
The one thing that we must remember is that now that we are working with the tabular model, calculations or defined fields cannot be created utilizing standard T-SQL. We must utilize DAX (data analysis expressions).
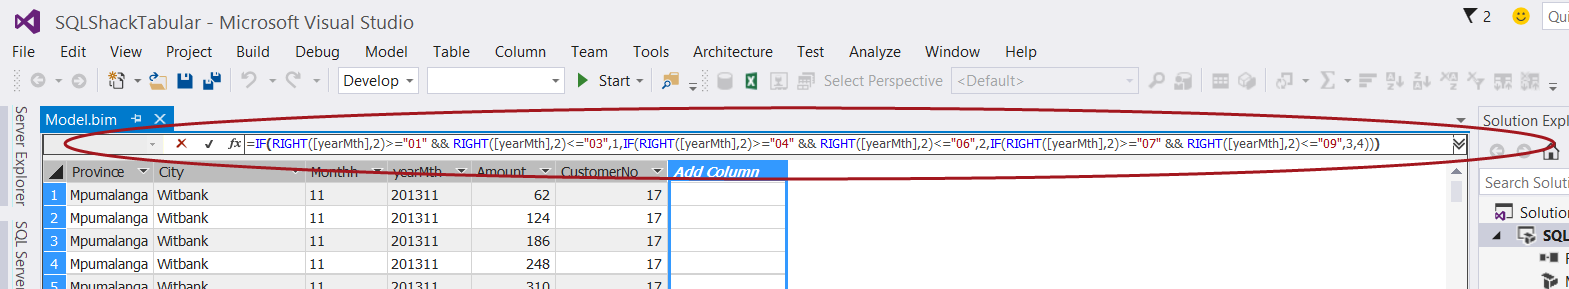
We select “Add Columns” (as shown above) and add our DAX expression
|
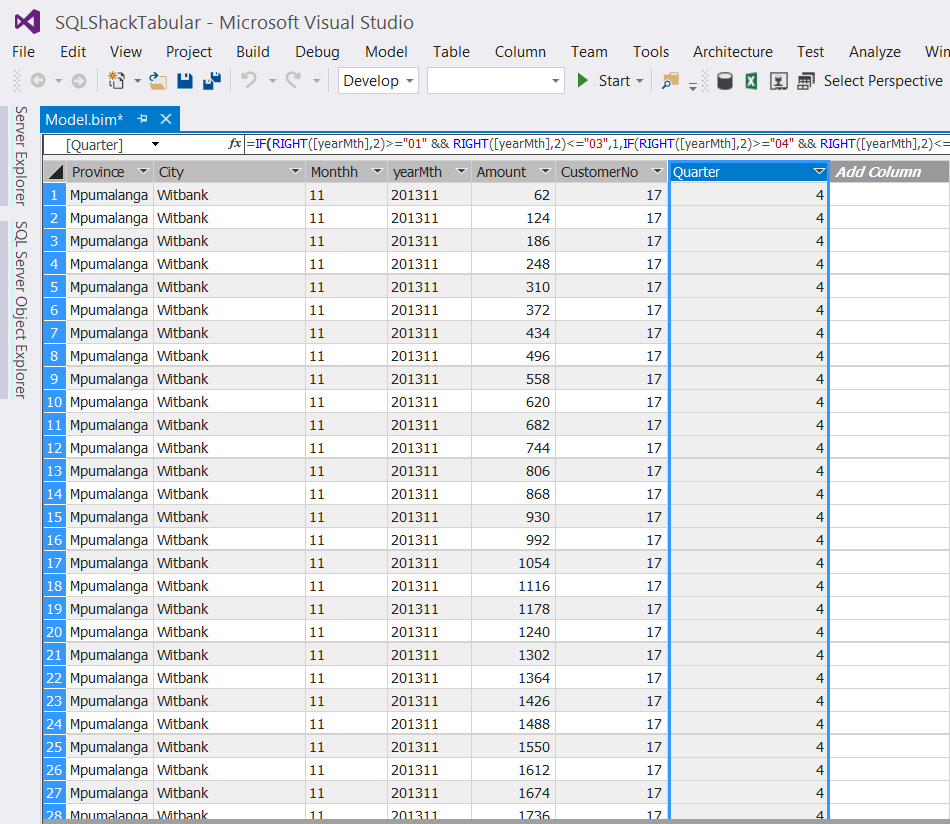
=IF(RIGHT([yearMth],2)>=«01» && RIGHT([yearMth],2)<=«03»,1,IF(RIGHT([yearMth],2)>=«04» && RIGHT([yearMth],2)<=«06»,2,IF(RIGHT([yearMth],2)>=«07» && RIGHT([yearMth],2)<=«09»,3,4))) |
to the “function box” below the menu ribbon (see above).
The “Quarter” has now been created (see below).
Once again, the eagle – eyed reader will question the financial year calendar. Fear not, the same DAX expression may be used for a fiscal year starting July 1 and ending June 30th. Such is the beauty of the DAX language.
We now rename the column to “Quarter” (See below).
Aggregating our “Amounts”
As “champions of reporting”, we all know that the decision makers will want to view reports which have aggregated results, by region and by time. This said we now aggregate our “Amount” field so that when we report from our tabular “cube”, the results will be aggregated at the appropriate level.
We place our cursor in any cell below our data display (see the blue highlighted cell in screen shot below). It should be understood that “any cell below the data is adequate”.
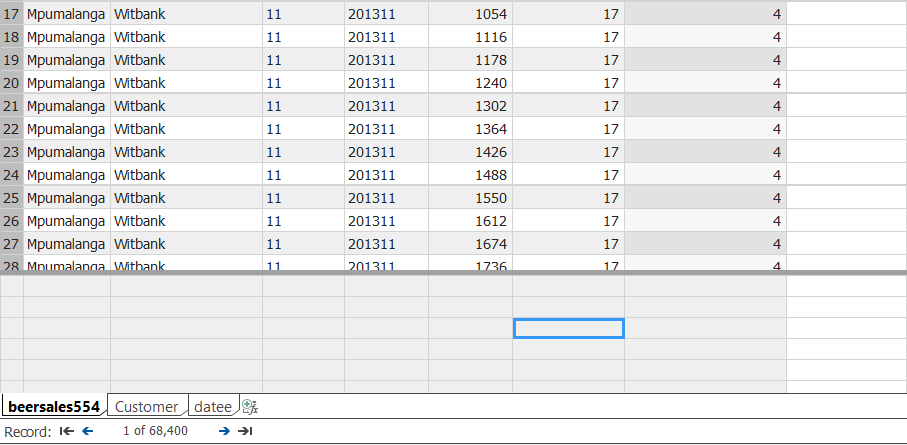
We now create the DAX formula to aggregate the data.
|
GrandTotal := Sum([Amount]) |
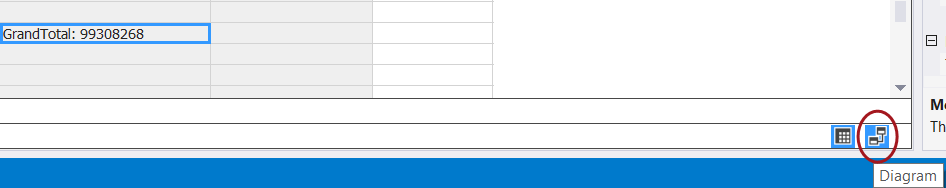
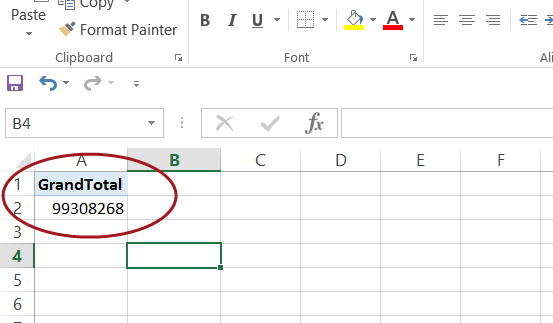
The DAX formula is created in the same function box that we utilized for the “Quarter”, and a grand total will display in the blue cell (shown below).
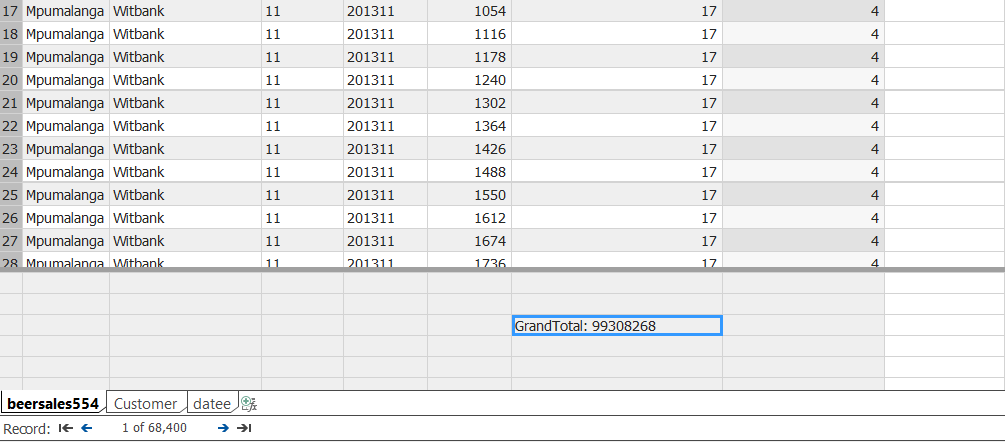
It should be remembered that at this point in time that the result is meaningless as we have not linked “Amount” to our date and customer dimensions 🙂
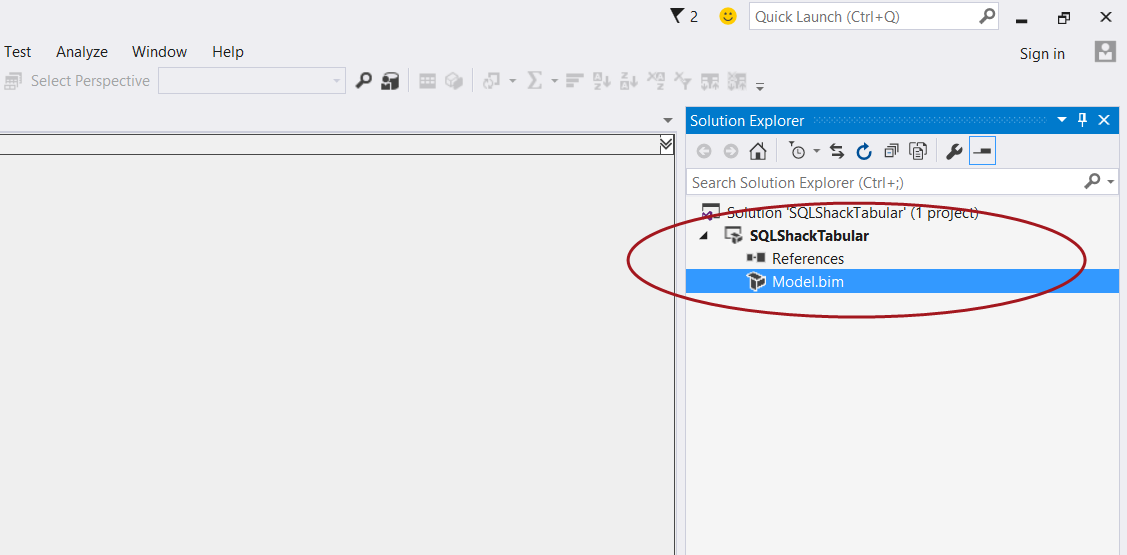
We shall now create these linkages by clicking on the “Diagram” box located at the bottom right of the screen shot below (see the red circle).
Having clicked upon the “Diagram /Relationship” icon (discussed imediately above), we are brought to the “Relationship” work surface.
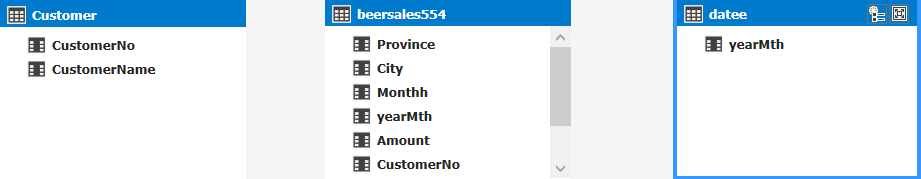
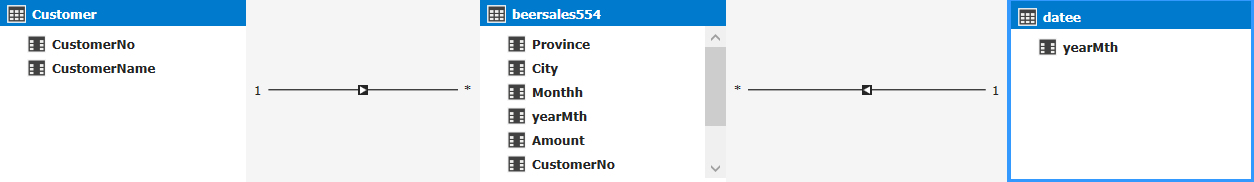
We note that our three tables /entities are displayed (see above). We now create the necessary relationship links by dragging the corresponding fields within the Customer entity to the customer number within the BeerSales entity. We do the same for the “Datee” entity (see below).
This completes the development portion of our exercise. The only thing remaining is to deploy our model.
Deploying our model
To begin the deployment process we must set a few properties.
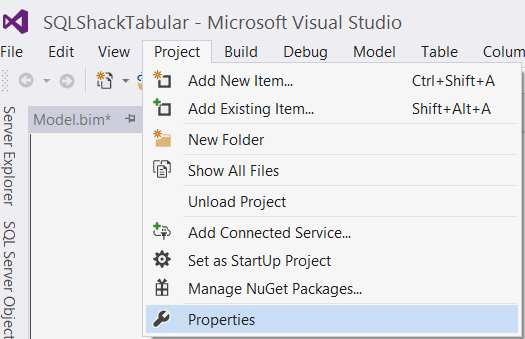
We click on the “Project” tab on the menu ribbon and select “Properties” (see above).
The “Properties” dialog box is now displayed (see below).

We set the TABULAR Analysis Server name and set a name for the target database that will reside on the Tabular Analysis Services server. In our case the server is “STR-SIMONSTEVE2016TABULAR” and the database name will be “SQLShackTabularBeer” (see above). We then click “OK”.
Our next step is to “Build” our solution prior to deploying it. This step will help detect any errors or other issues. We simply right click the project name and select “Build” (see below).
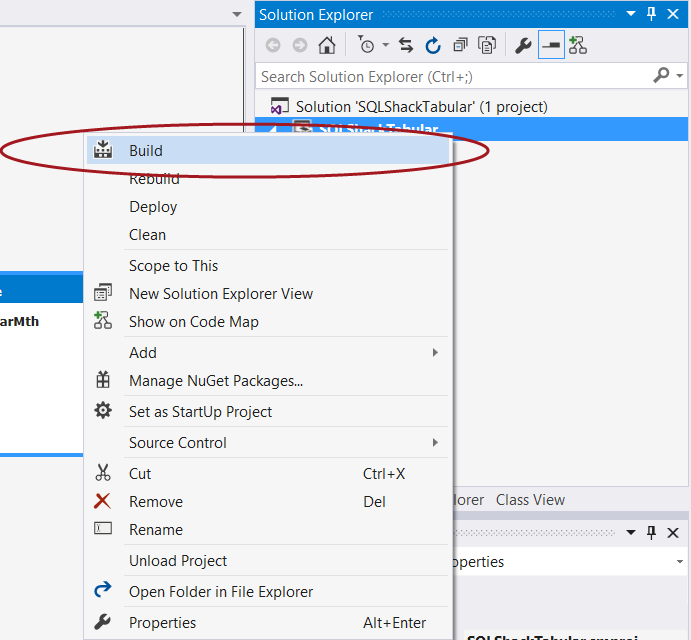
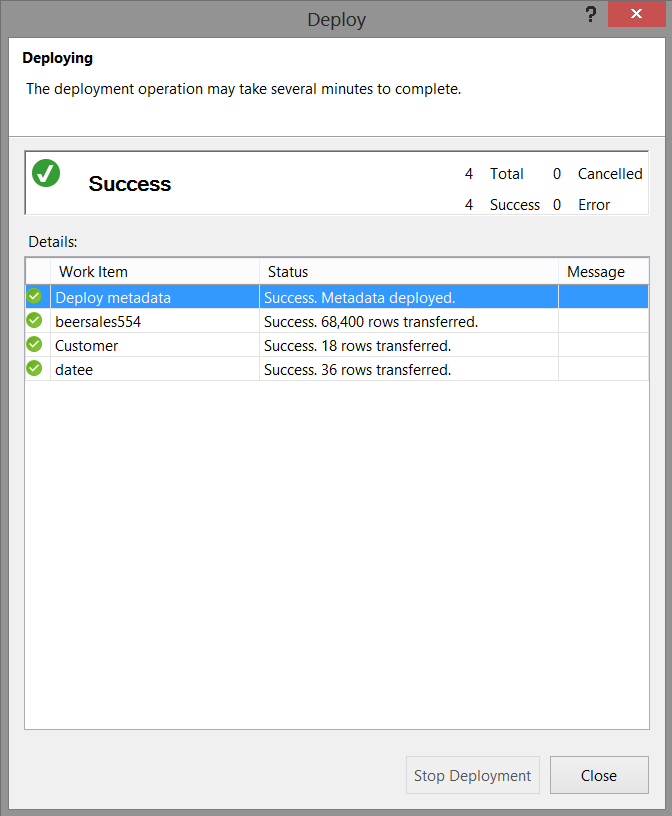
We are notified our the status of our “build” as may be seen in the screen shot below:
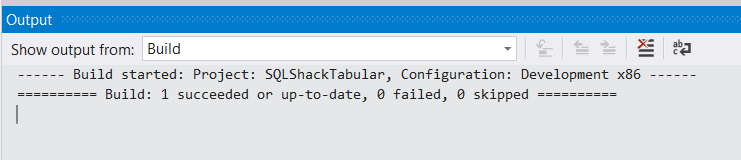
Having “Built” the solution, we are now in a position to deploy our solution and create our Analysis Services tabular database.
Once again we “right click” on the project name and select “Deploy” (see below).
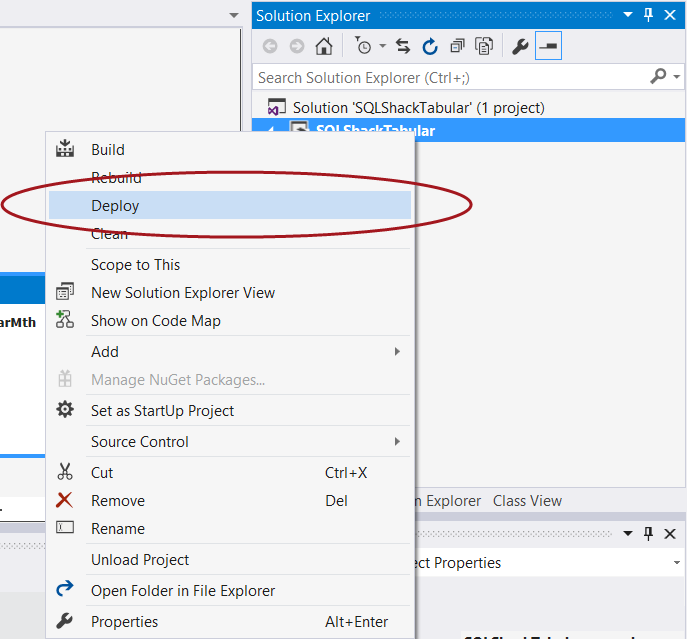
The “Impersonation” dialog box is displayed as may be seen below:
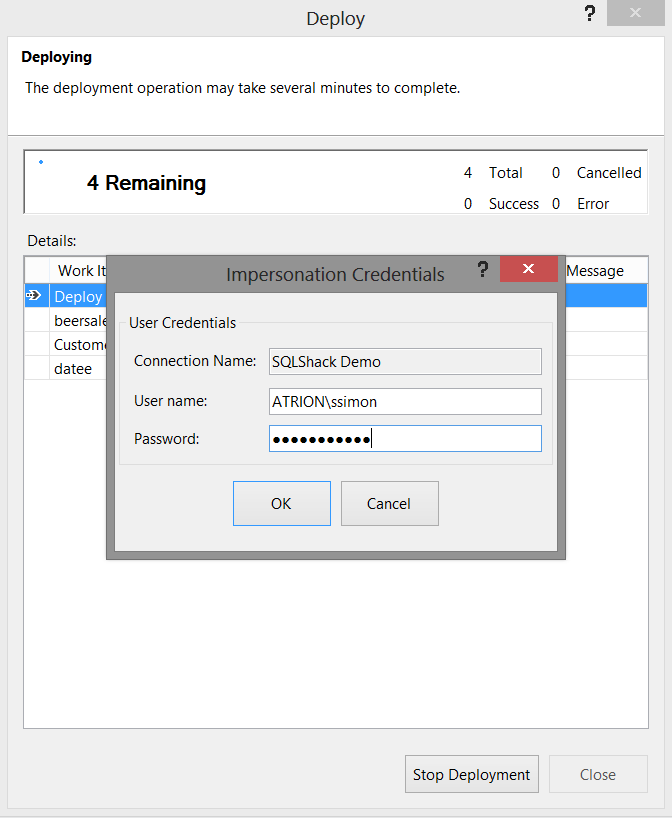
We pass the necessary credentials to the system (as we have done above) and deployment commences.
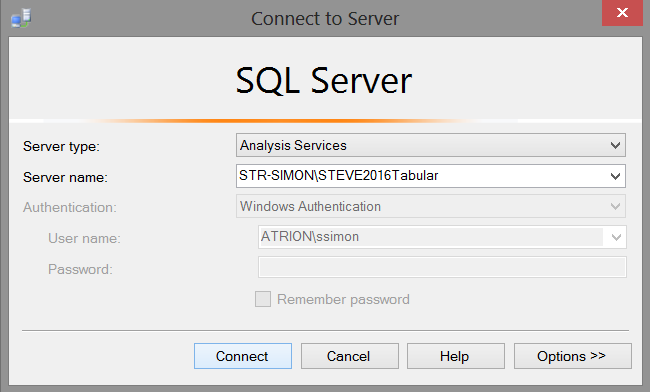
With deployment successful, we now closed Visual Studio or SQL Server Data Tools 2010 and we shall go back into SQL Server Management Studio, however this time into our Analysis Services tabular instance.
Verifying that our database has been created
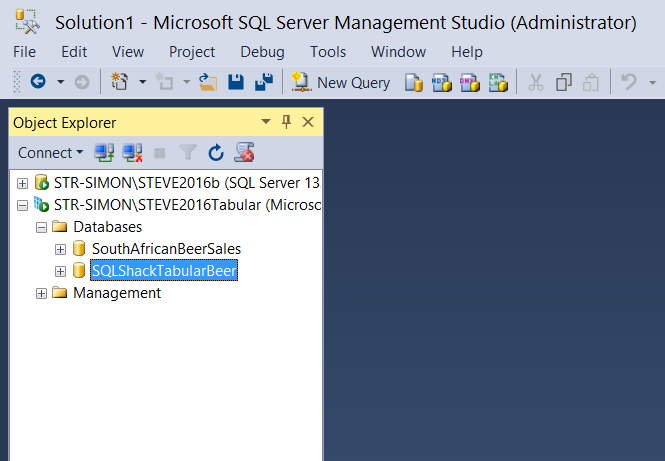
Opening SQL Server Management Studio we select our Analysis Services tabular instance.
Expanding the database tab, we note that our database has been created (see below).
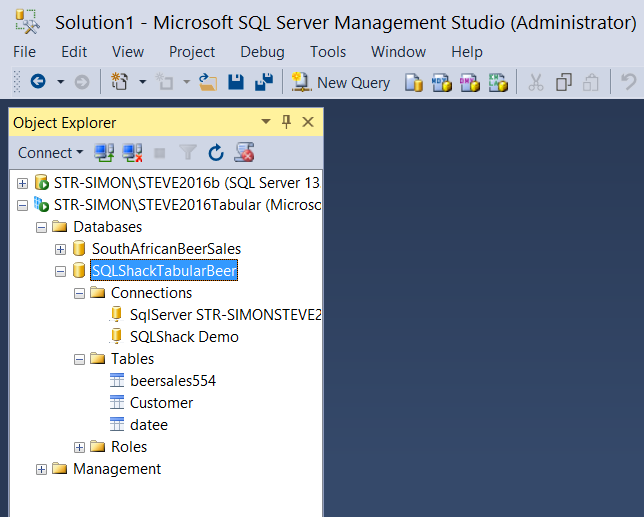
Expanding the SQLShackTabular database tab we find our three tables.
We can now run a few simple DAX queries to ascertain if our results look reasonable. DAX is an amazingly powerful “beast”. It is complex to learn and understand, and this is beyond the scope of this article. Enough said, let us get busy with those small test queries!
We simply open a new query by selecting the “New Query” button on the banner. The query editor now opens (see below).
Using a very elementary DAX statement, we shall calculate the total beer sales by our client base,
The DAX statement is
|
DEFINE //We define a TOTAL FIELD MEASURE beersales554[Total] = CALCULATE( SUM( Beersales554[Amount] ), ALL( Beersales554[CustomerNo] ) ) EVALUATE ADDCOLUMNS( ALL( Beersales554[CustomerNO] ), «Total for Customer»,sum(Beersales554[Amount]) ) Order by BeerSales554[CustomerNo] |
When we execute this query we obtain the following results (see below).
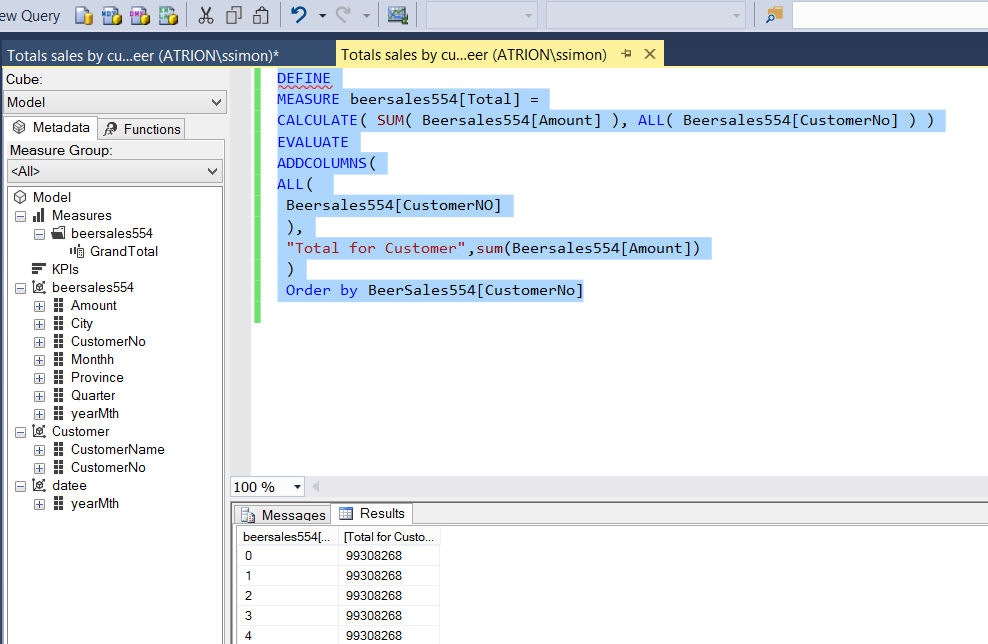
The eagle – eyed reader will have noted that the values for all customers appear the same and that is because we requested the “GrandTotal” be displayed with each customer (which is really not that informative, to say the least!).
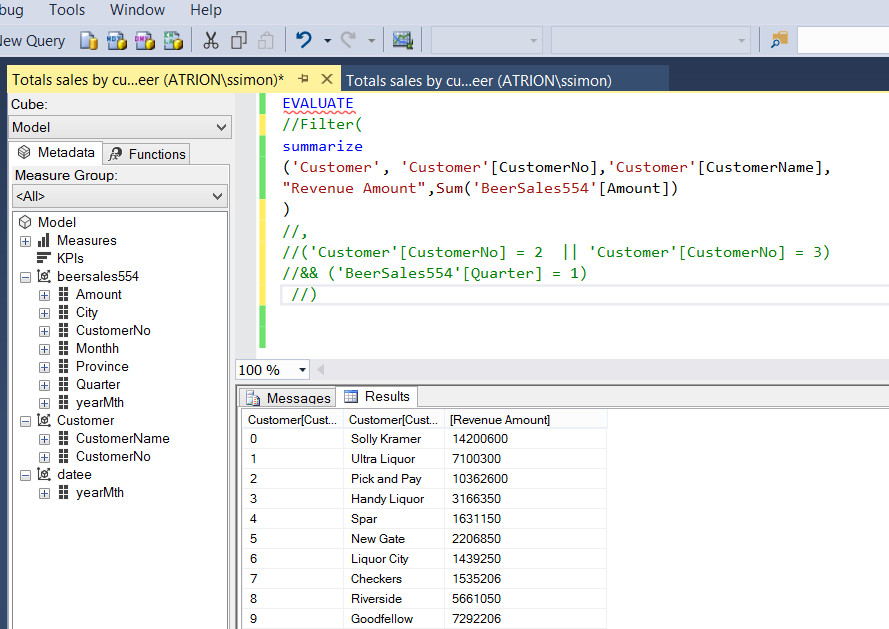
Changing the query slightly by adding the Customer Name and utilizing the “Amount” field instead of the “GrandTotal”, we can now see the total sales for the whole period for all customers (customer by customer).
The code to achieve this is below as is the result set.
|
EVALUATE //Filter( summarize (‘Customer’, ‘Customer’[CustomerNo],‘Customer’[CustomerName], «Revenue Amount»,Sum(‘BeerSales554’[Amount]) //) //, //(‘Customer'[CustomerNo] = 2 || ‘Customer'[CustomerNo] = 3) ) |
In short, working with DAX is similar to working with MDX. It has its rules and ways of traversing the data tree and is frankly not for the faint of heart.
This said, let us have a look at reporting based upon our tabular model.
Reporting
For today’s reporting exercise, we shall be utilizing Excel. In part two of this article, we shall be utilizing SQL Server Reporting Services.
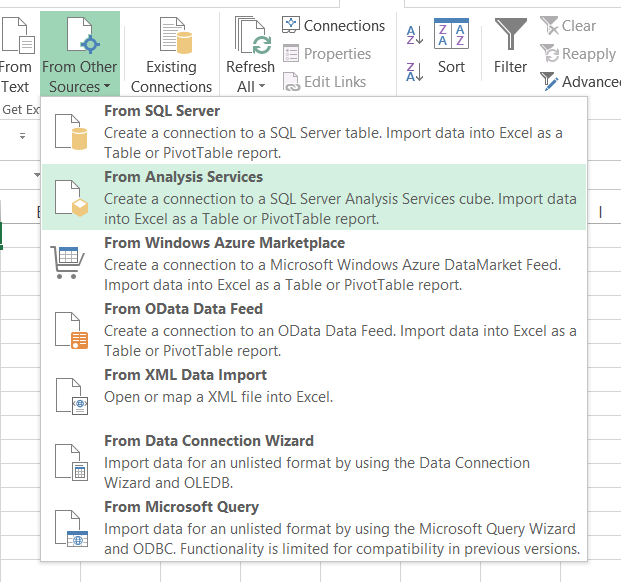
Opening a new workbook, we click upon the “Data” tab and select “From Other Sources” (see below).
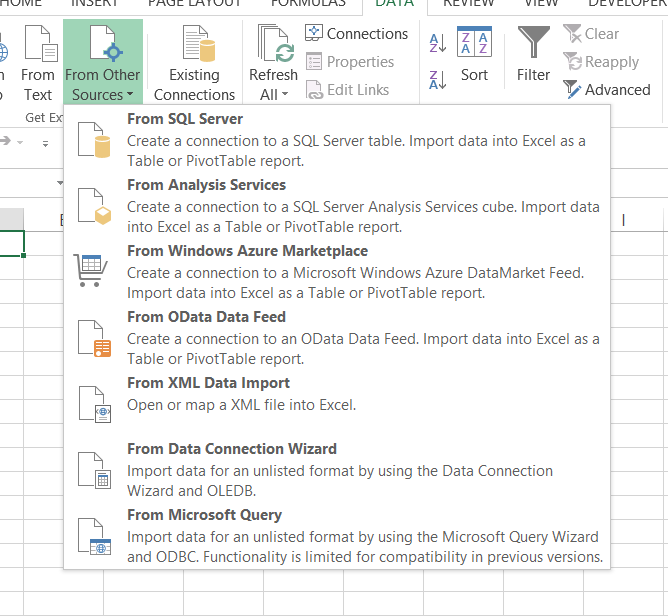
We select “From Analysis Services” (see below)
The “Data Connection Wizard” now appears. We configure this to point to our Tabular Analysis Database (see below).
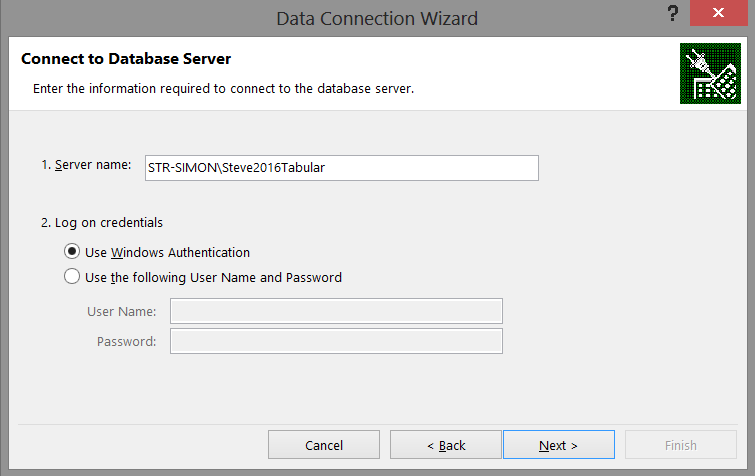
We click “Next”.
The next screen shows our Model that we created in Visual Studio or SQL Server Data Tools (see below).
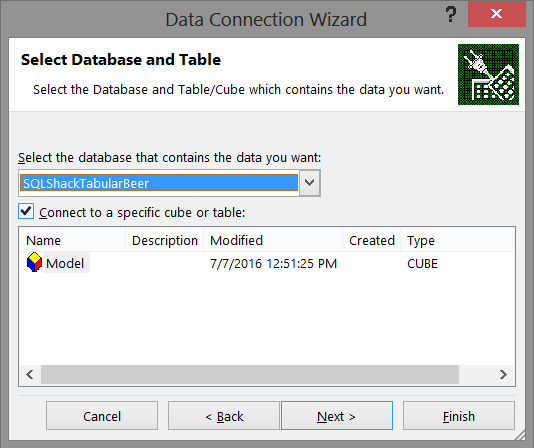
Having selected our database, we click “Next”.
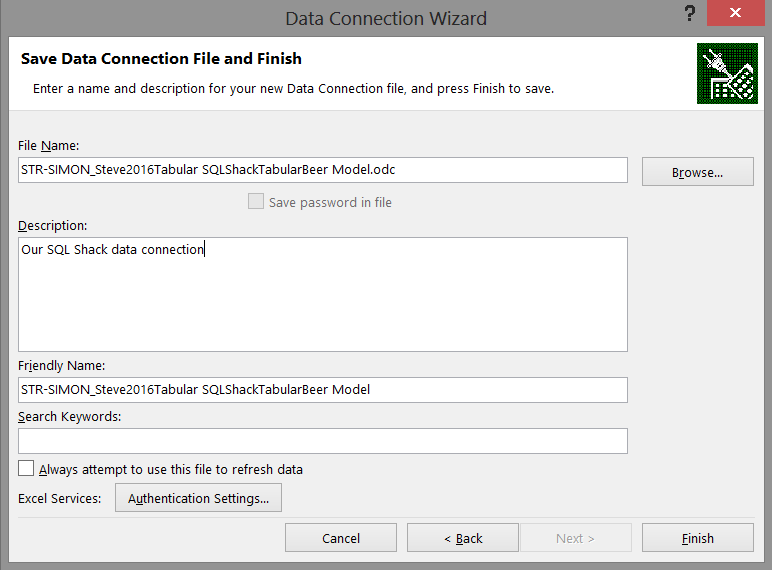
We now save our data connection and click “Finish” to complete the connection process (see below).
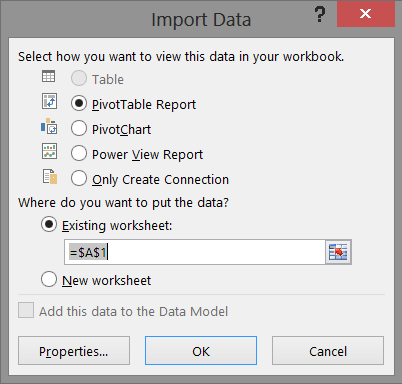
Having achieved all of this, we are now at the stage where we can import all the data that we have assembled (see below). We shall accept to create a “PowerTable” report for this exercise and click “OK” (see below).
Having completed this we find our work area looks similar to my view shown below:

This is where we are going to work our magic!!
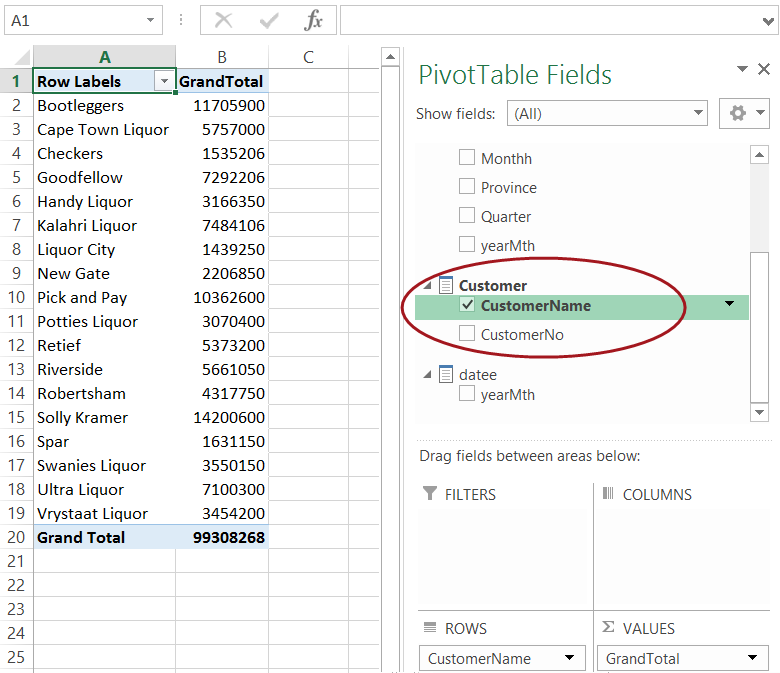
We shall drag the measure “GrandTotal” (see above) which now appears among the Pivot Table Fields and which originates from our Visual Studio / SQL Server Data Tools project; onto the Pivot Table (occupies cells A1 to C18) (see below).
To this we now add our “CustomerName” from the customer table. Our canvas appears as follows:
Now let us look at the financial year 2013 solely to see the results for those clients listed above. To achieve this, we add a filter to the “Filters” box seen above and enclosed within the circle.
The change in the values may be seen in the following two screen shots.
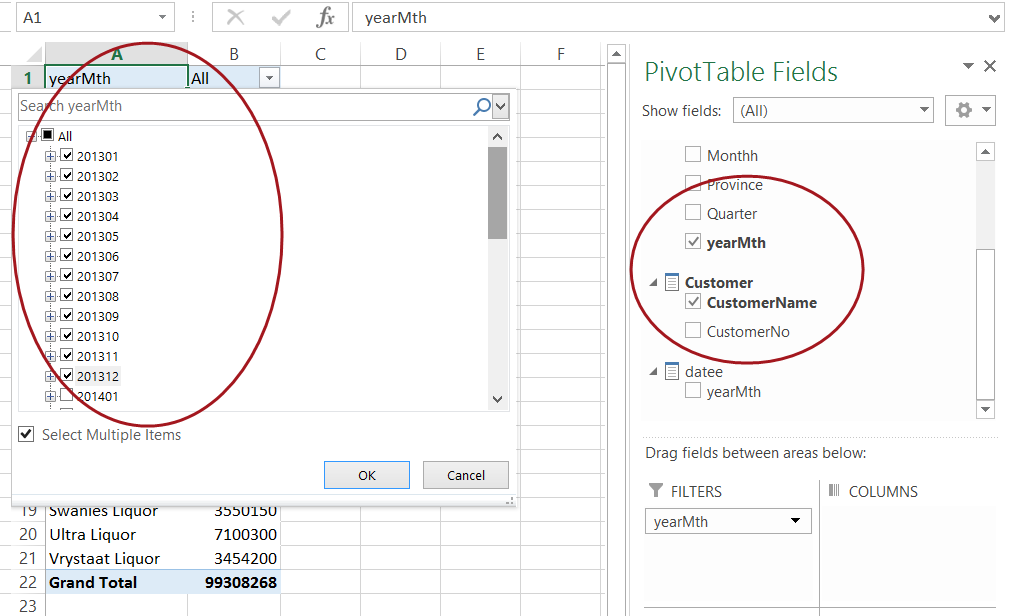
and
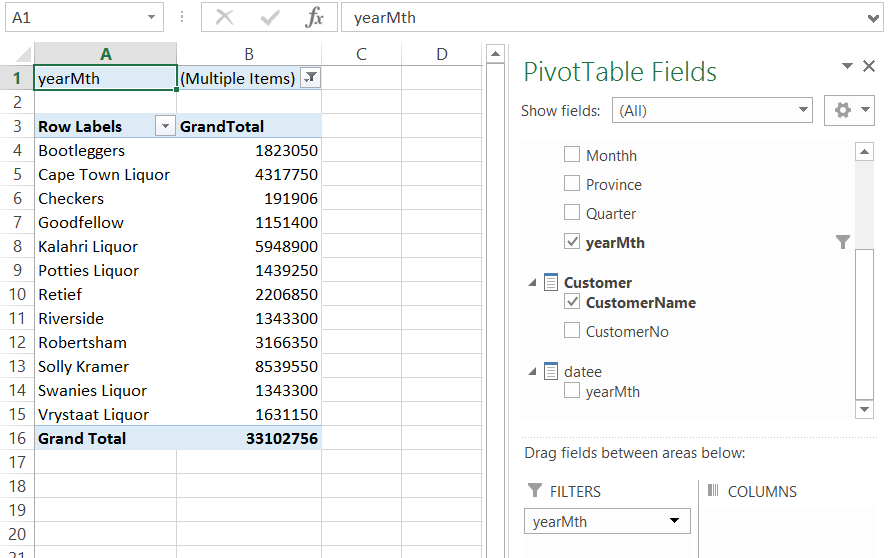
Now naturally we could have chosen any year, the point being do note that because the values are aggregated by a “date time”, changing the “what if” scenario is fairly easy and rapid.
We take our exercise one step further by inserting a Pivot Chart. This is achieved by selecting “Insert“ from the main menu ribbon. We select a “Pivot Chart” (see below).
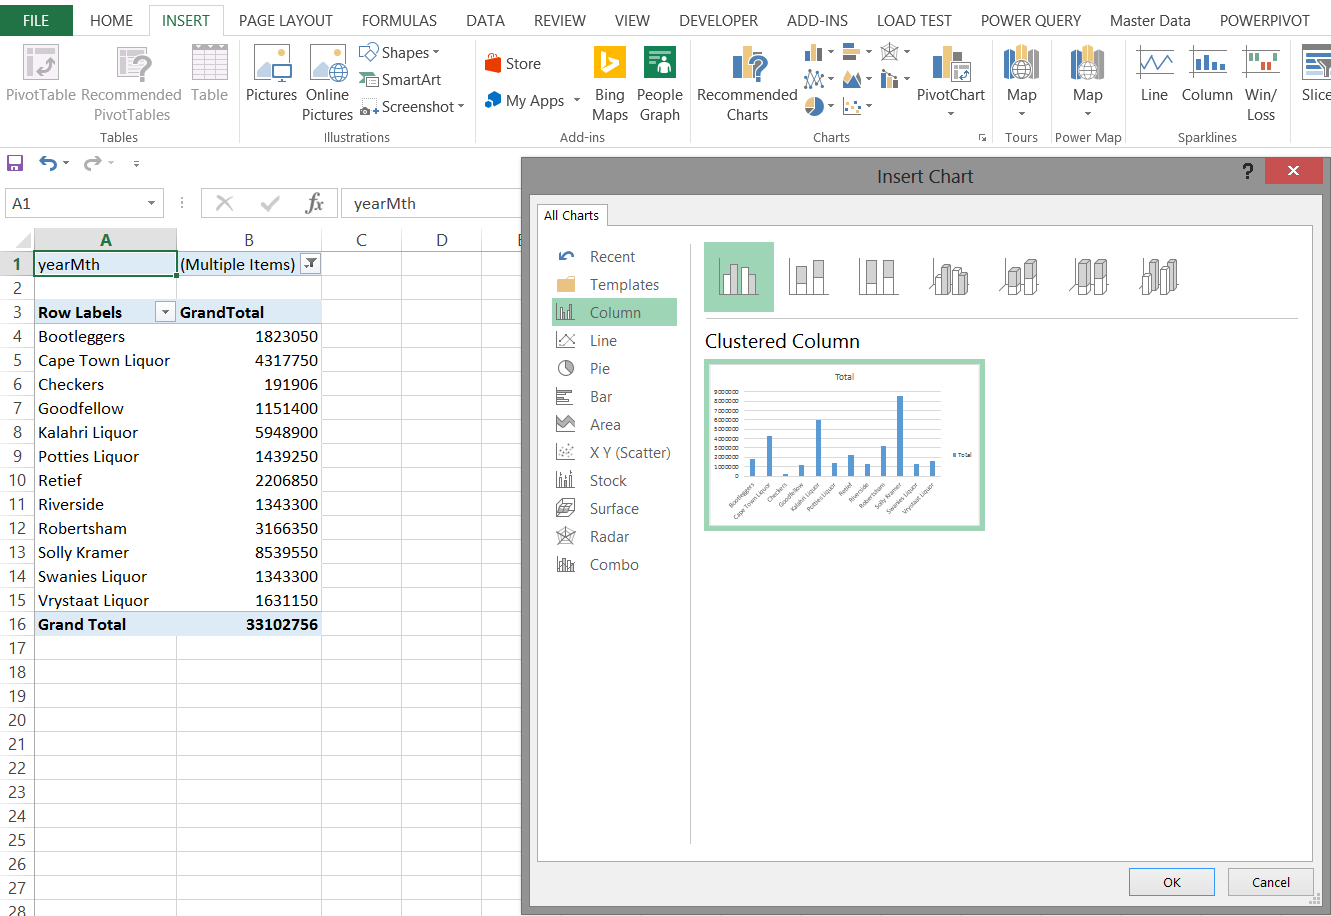
The results may be seen in the following screen shot.
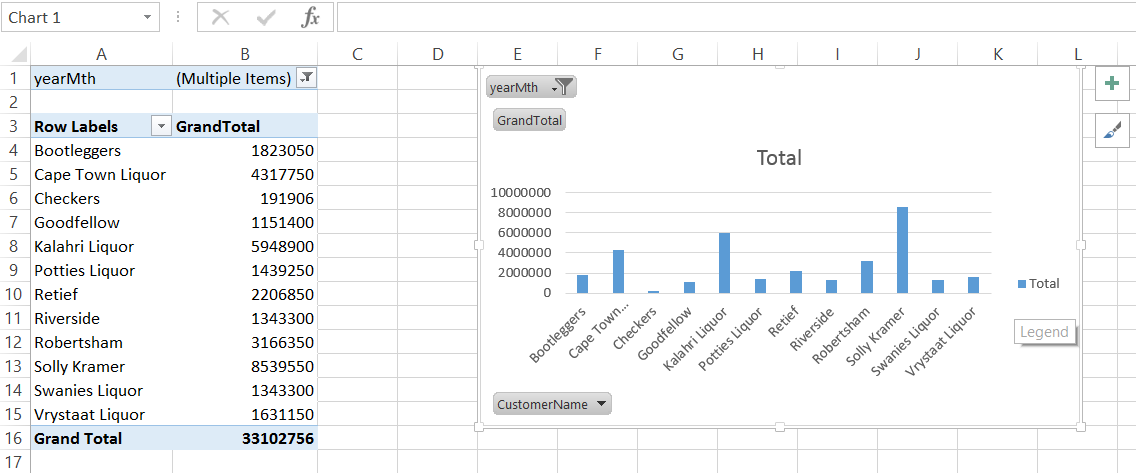
The screenshot above shows a bar chart and the following screenshot as simple line graph
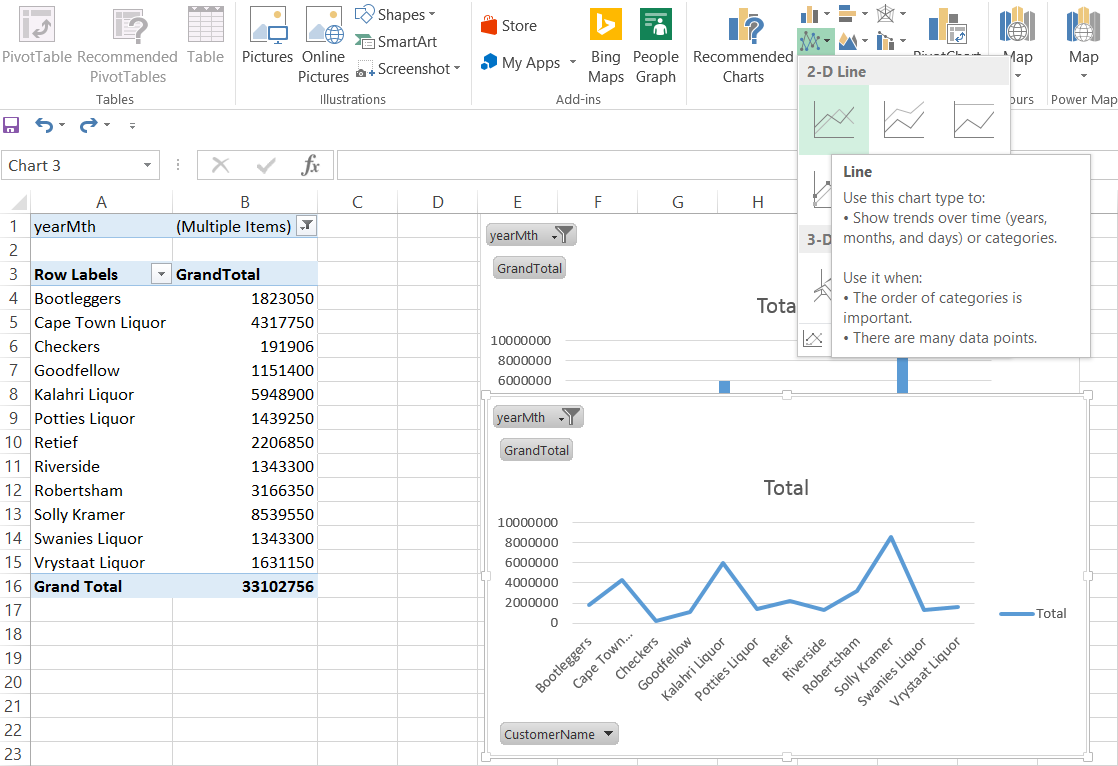
Our final report appear below and is quite comprehensive.
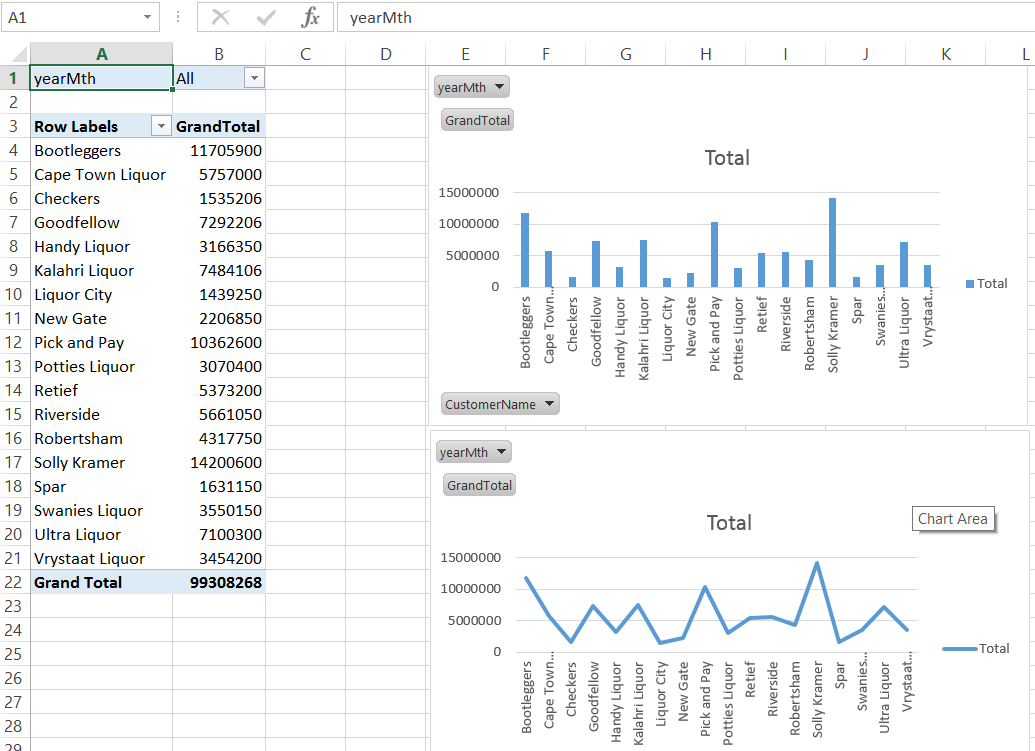
It should be noted that once the filters are removed or altered (within the matrix), that both the chart and the line graphs will reflect the changes as may be seen below.
Demographic Consumption
Now what would be interesting is to view the sales relative to geography.
To do so we shall utilize “Power Map”. Before we can do this though we must add these tables to our data model within our Excel Workbook.
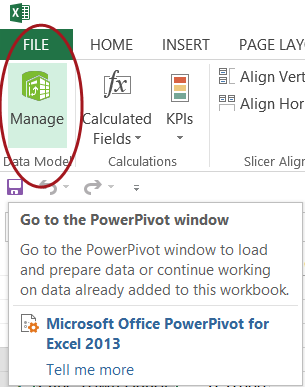
We click upon the PowerPivot tab and select “Manage Data Model” as may be seen below:
The blank “Manage Model” worksheet appears (see below).
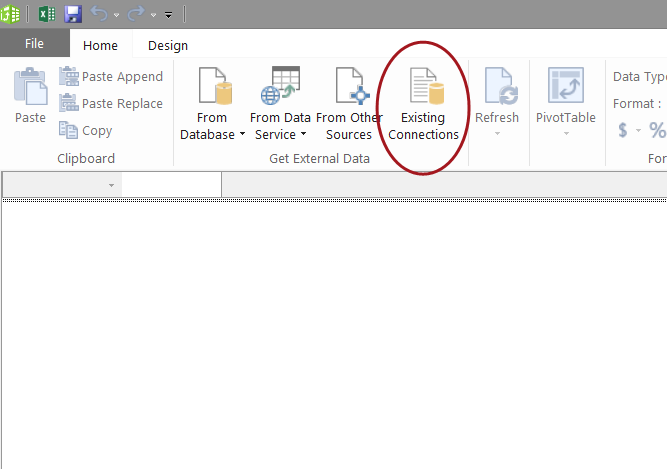
We click the existing connection to create a “View” from the tables in the Tabular Model that we created (see below).
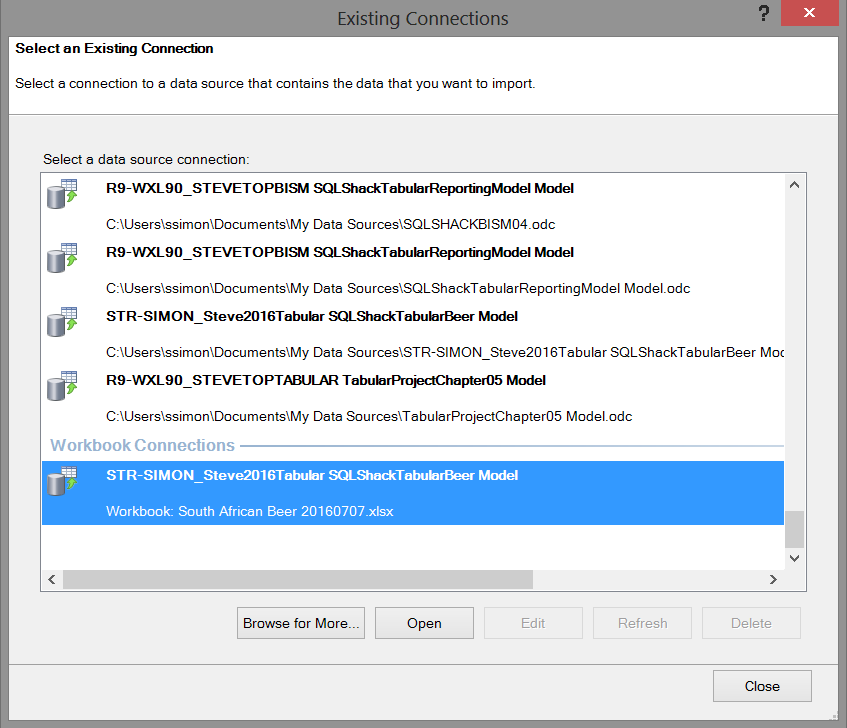
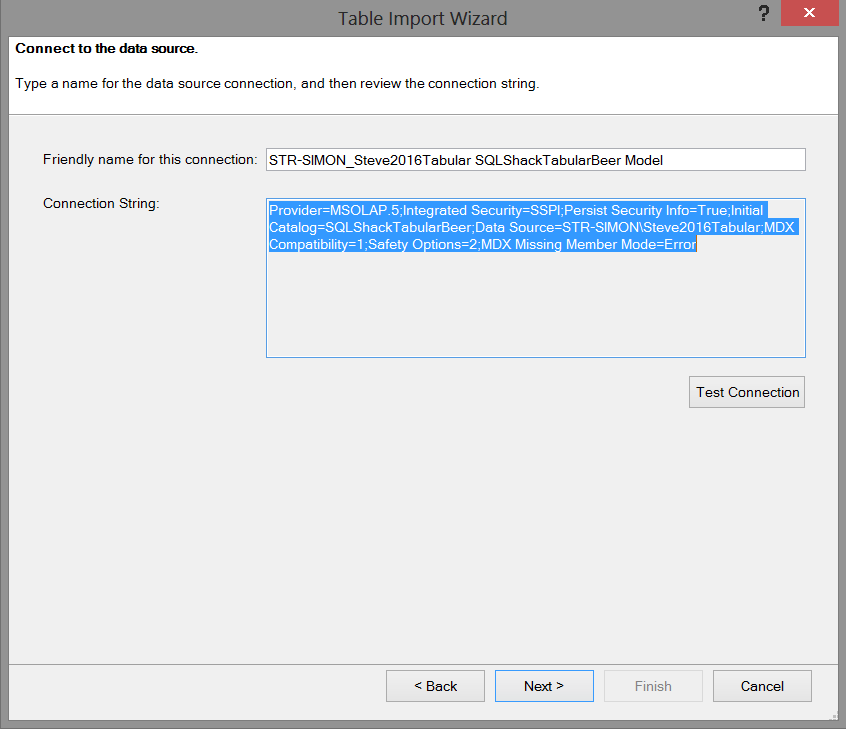
We click “Open” and note that Excel shows us the necessary connection string which will enable us to “communicate” with our Analysis Services database.
The next step in the process is a real GOTCHA and the author has been caught on this one numerous times. The following screen appears asking for a MDX expression with which to work. “What the heck!!!”
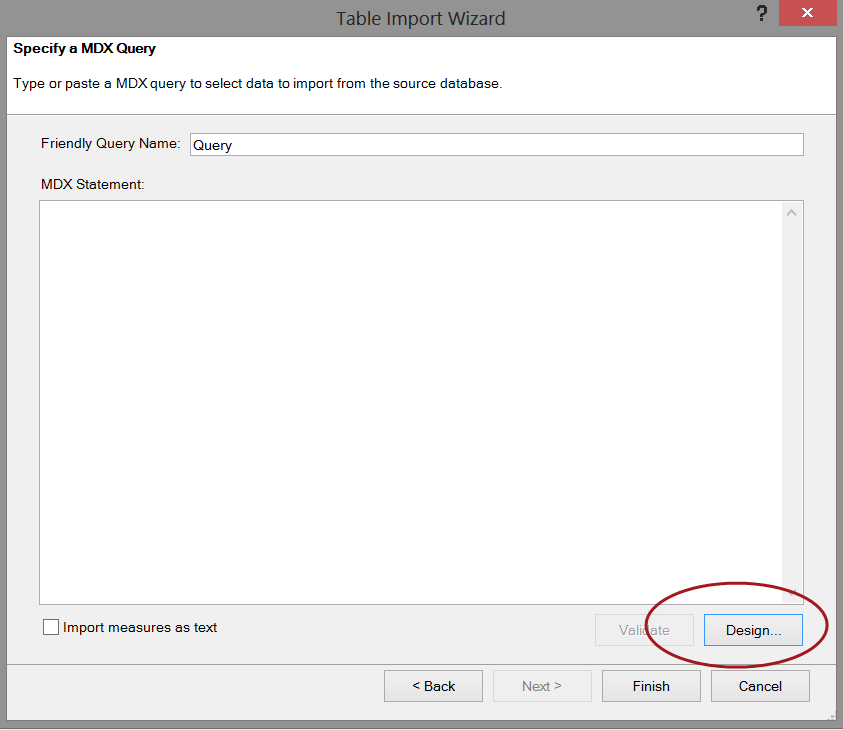
We simply click the design button and the contents of our cube automatically appear (see below).
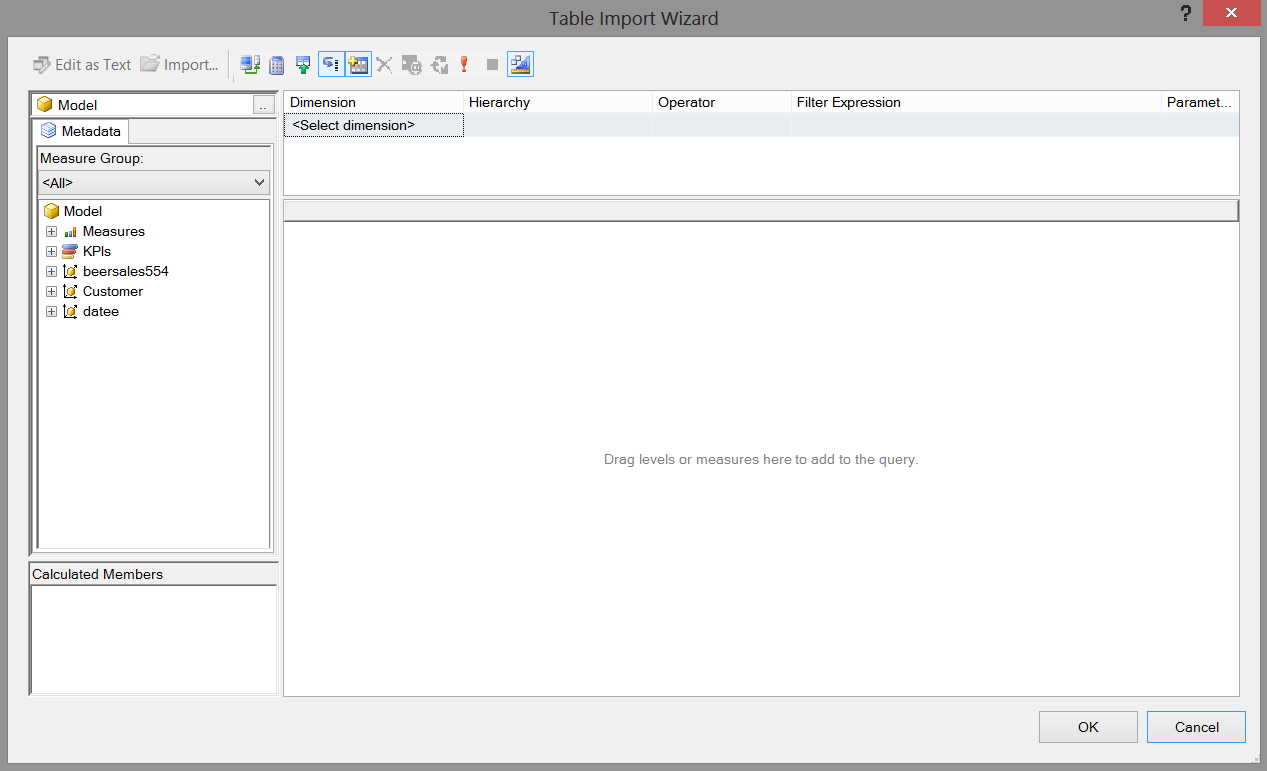
Dragging our “Grand Total” field, the province, the city, the quarter onto our work surface we now have the following view.
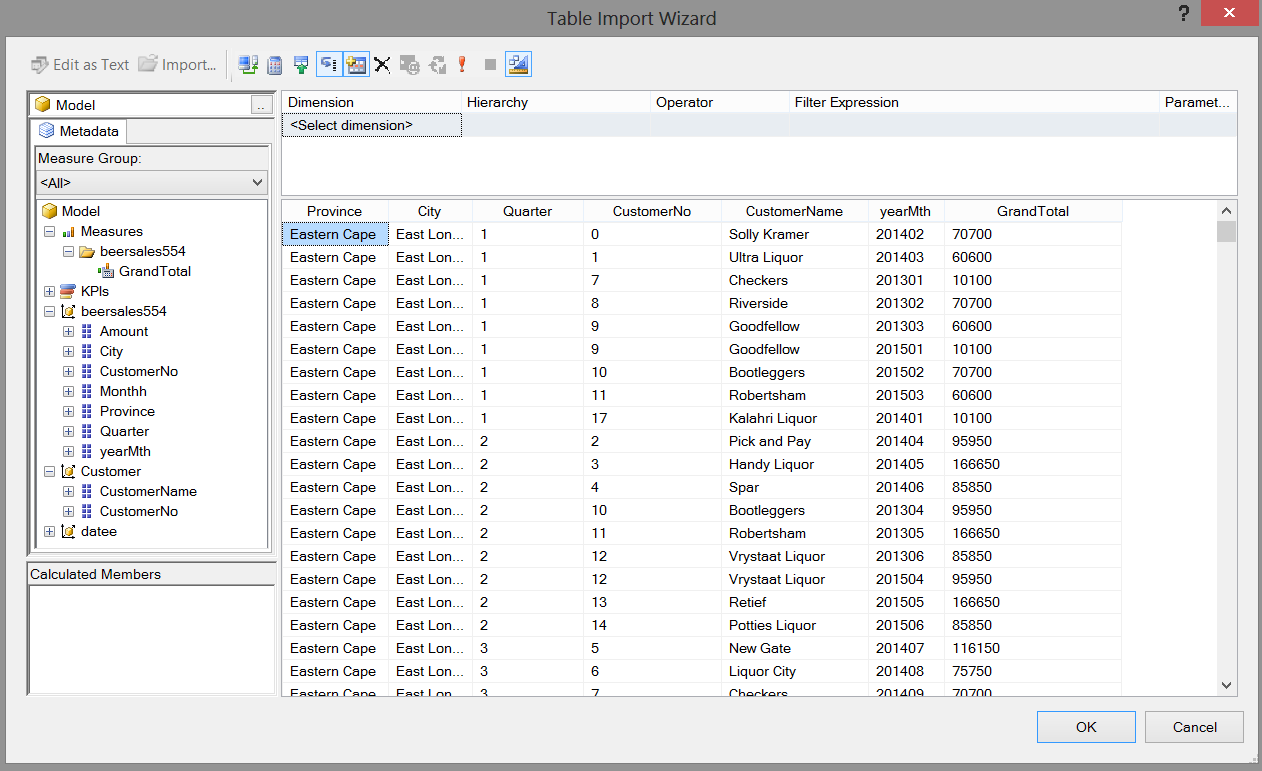
We click OK to accept our data choices whose data originates from the BeerSales554 and customer tables. The wonderful thing is that the MDX expression from our field selection is now displayed in that blank MDX expression box, as may be seen below:
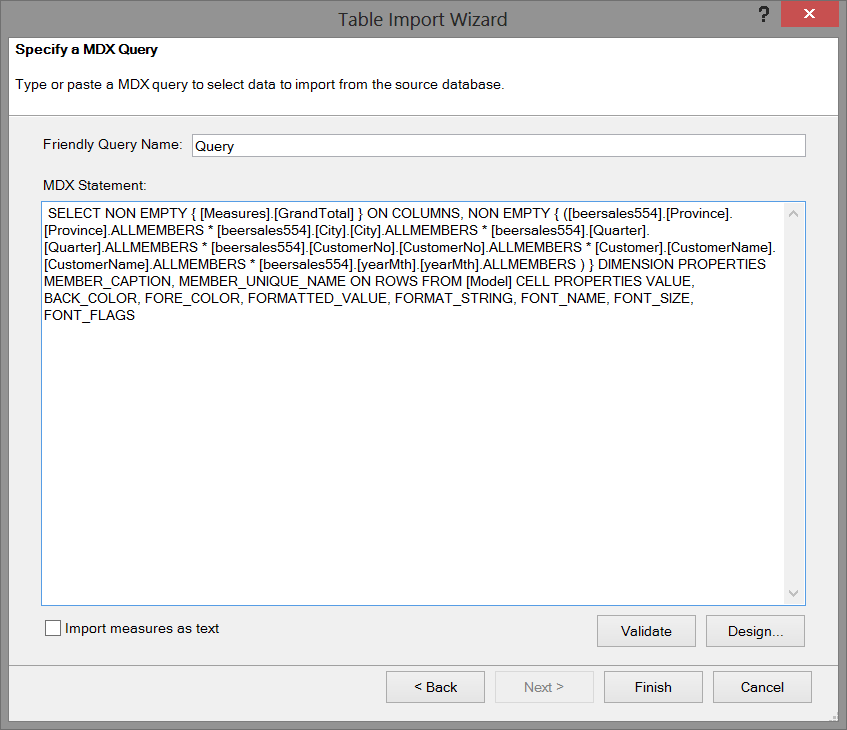
The MDX expression is also shown below.
|
SELECT NON EMPTY { [Measures].[GrandTotal] } ON COLUMNS, NON EMPTY { ([beersales554].[Province].[Province].ALLMEMBERS * [beersales554].[City].[City].ALLMEMBERS * [beersales554].[Quarter].[Quarter].ALLMEMBERS * [beersales554].[CustomerNo].[CustomerNo].ALLMEMBERS * [Customer].[CustomerName].[CustomerName].ALLMEMBERS * [beersales554].[yearMth].[yearMth].ALLMEMBERS ) } DIMENSION PROPERTIES MEMBER_CAPTION, MEMBER_UNIQUE_NAME ON ROWS FROM [Model] CELL PROPERTIES VALUE, BACK_COLOR, FORE_COLOR, FORMATTED_VALUE, FORMAT_STRING, FONT_NAME, FONT_SIZE, FONT_FLAGS |
We click “Finish” and the system imports the necessary raw data (see below).
We close the “Table Import Wizard” and ascertain that our data has been imported as may be seen below:
We “Save”, “Close” and “Exit” (see below).
We are now in a position to create our “Power Map”!
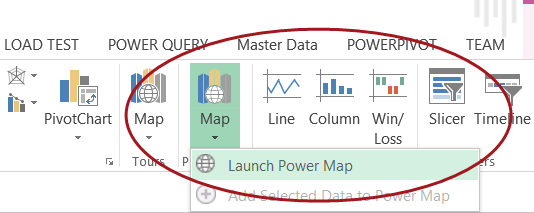
We select “Insert” from the main menu ribbon and click “Map” and “Launch Power Map”.
Opening Power Map we are greeted with our drawing surface (see below).
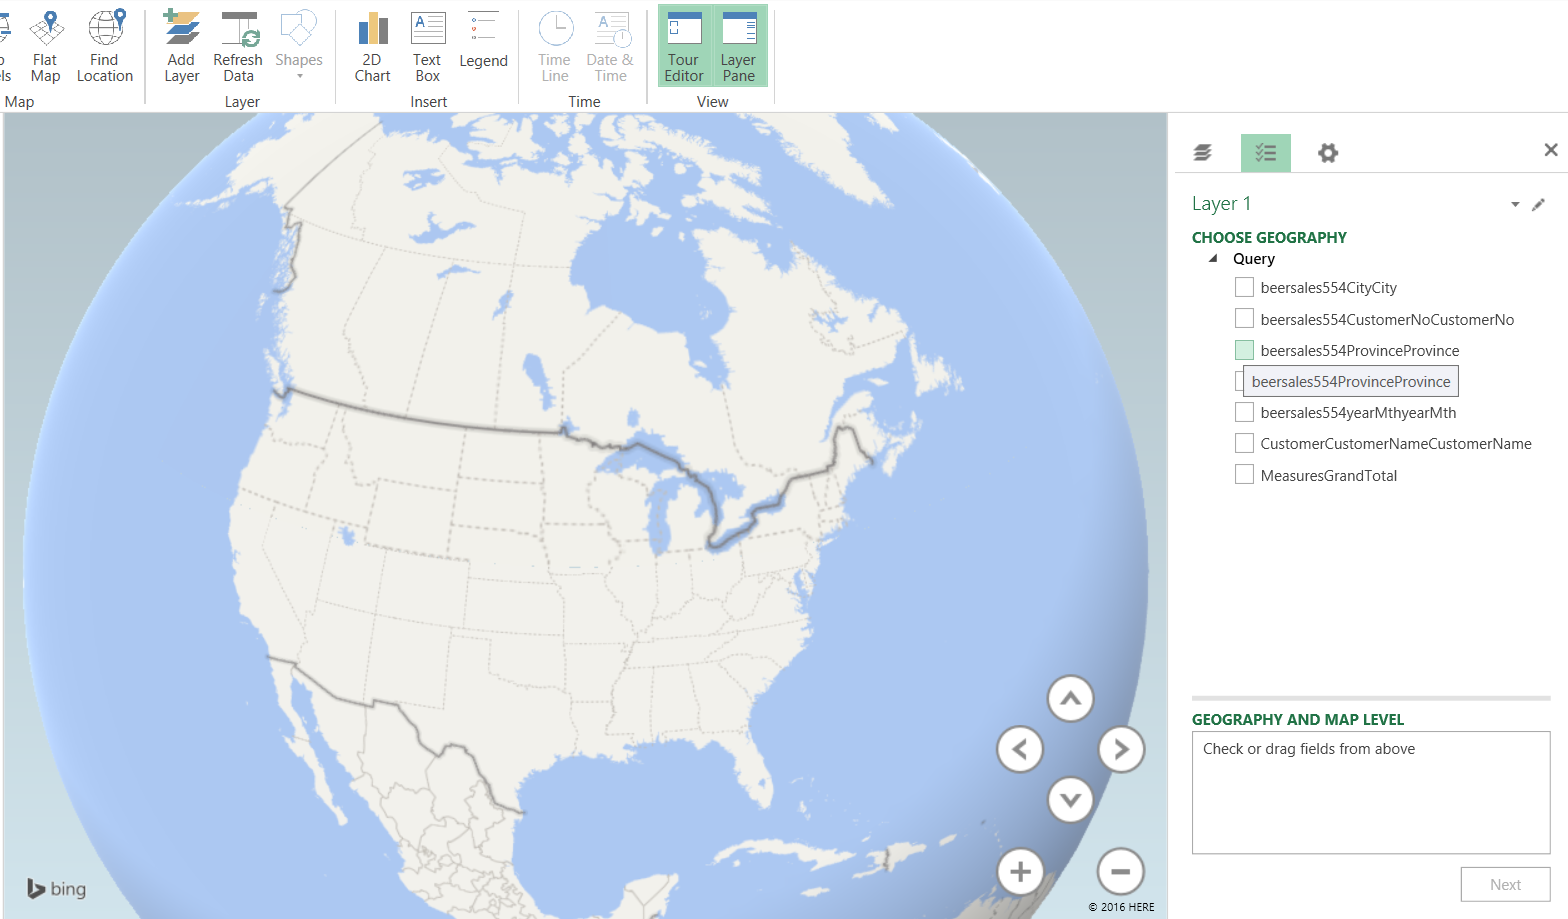
We now set the “Geography” by clicking on the City field within the “Choose Geography” box (see above).
We note that upon doing so that the map changes to show southern Africa.
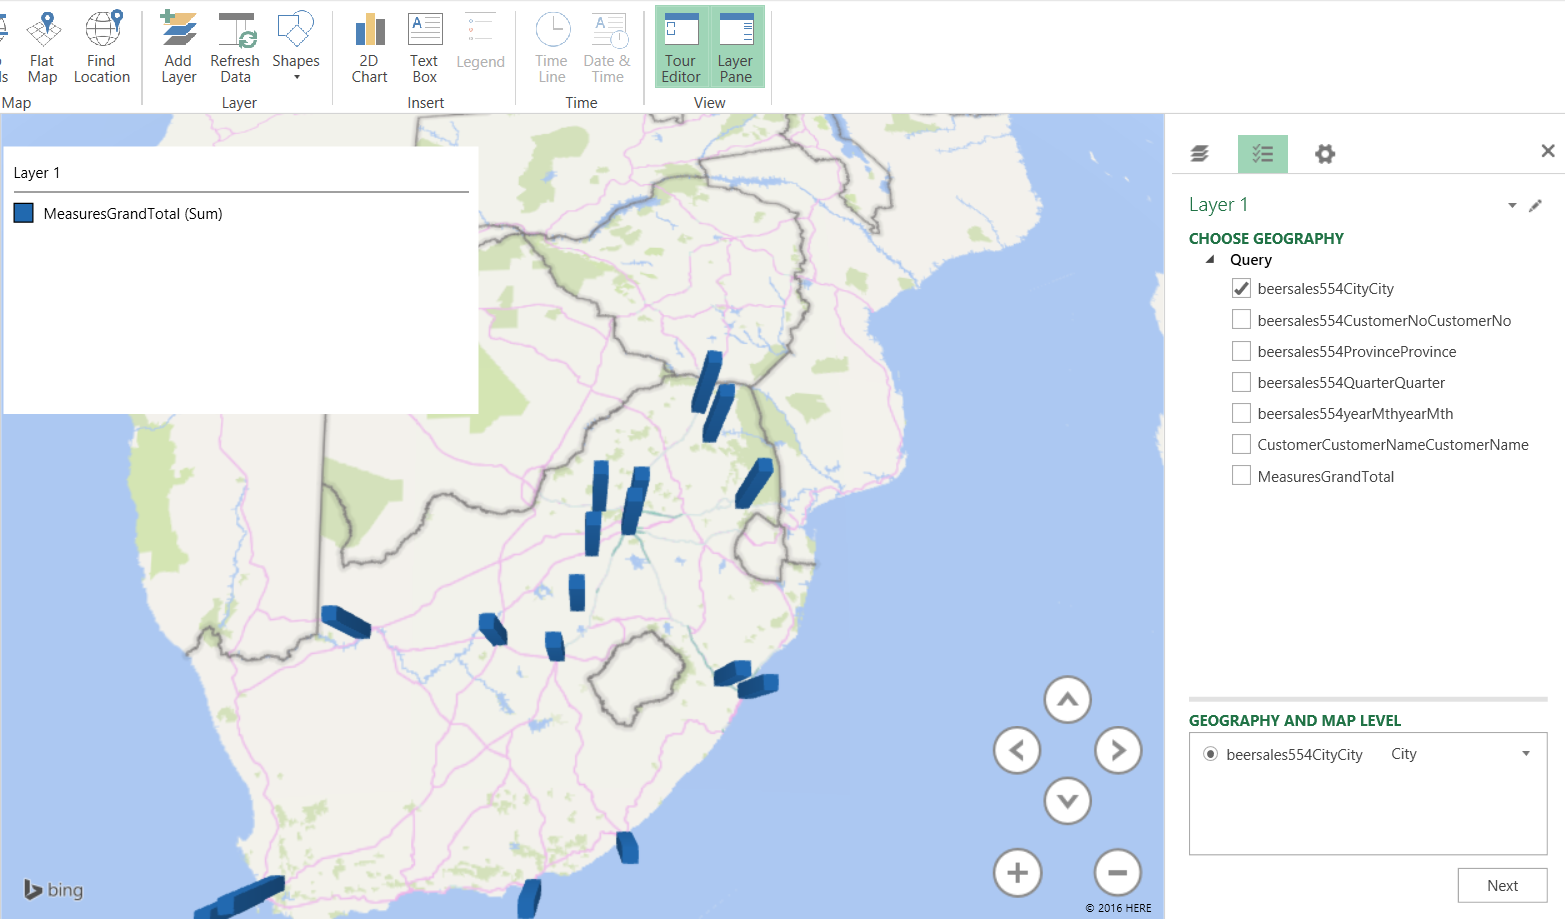
We click the “Beersales554CityCity check box and the cities for which we have data are now visible on the map.
Our next task is to plot the amount of sales that were recorded. We click “Next”.
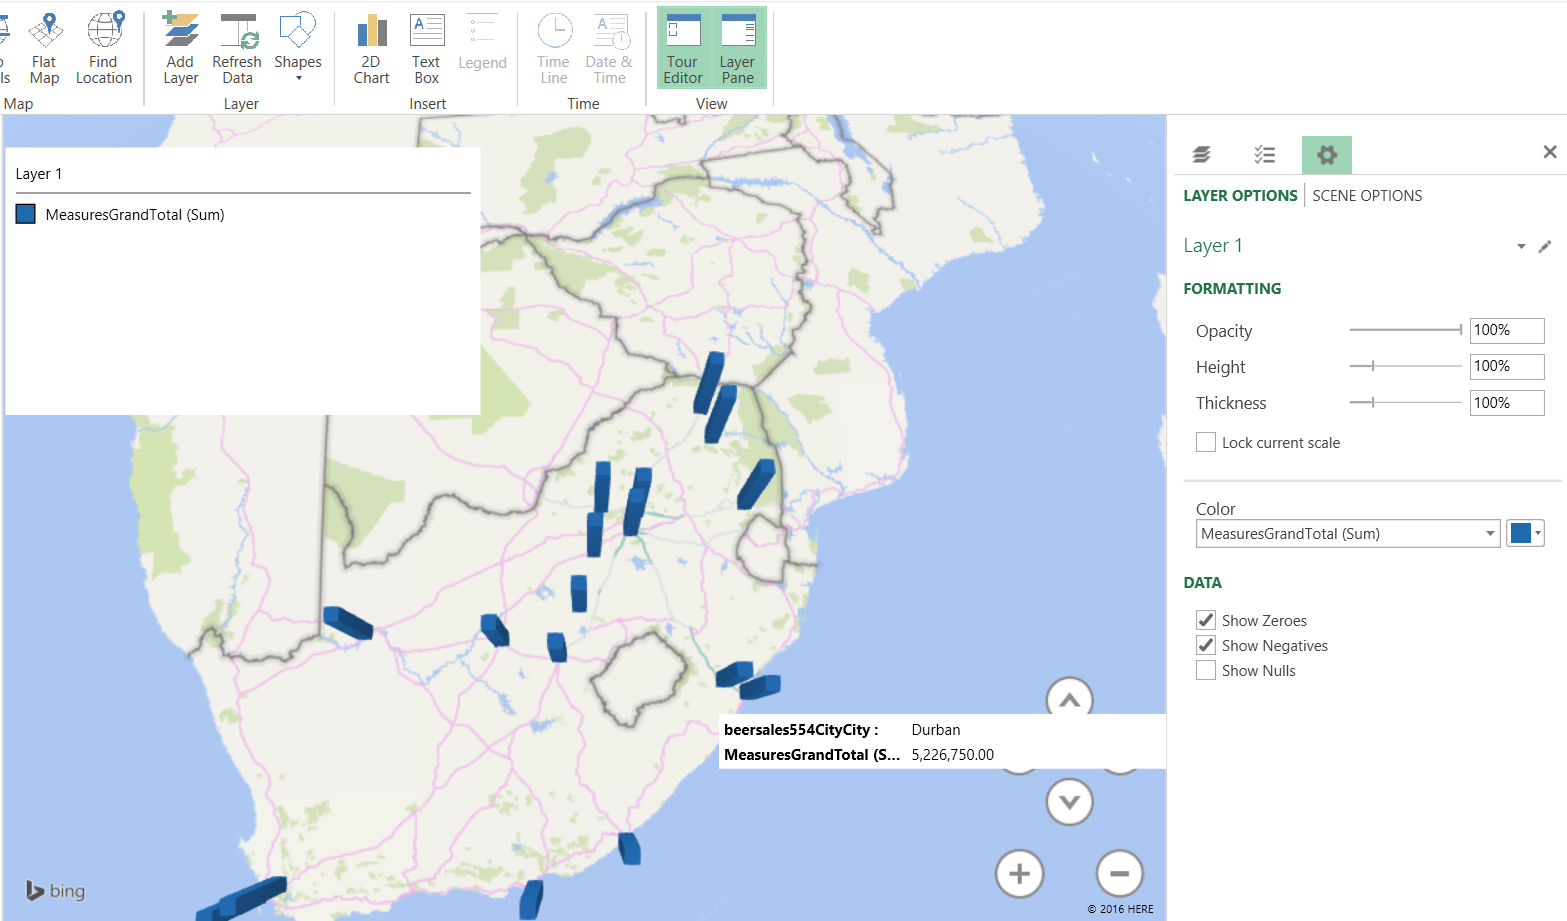
By checking the “MeasureGrandTotal” box we see the value of the total sales (see above) and by adding a time dimension, we can gage beer sales for the period of time under consideration (see below).
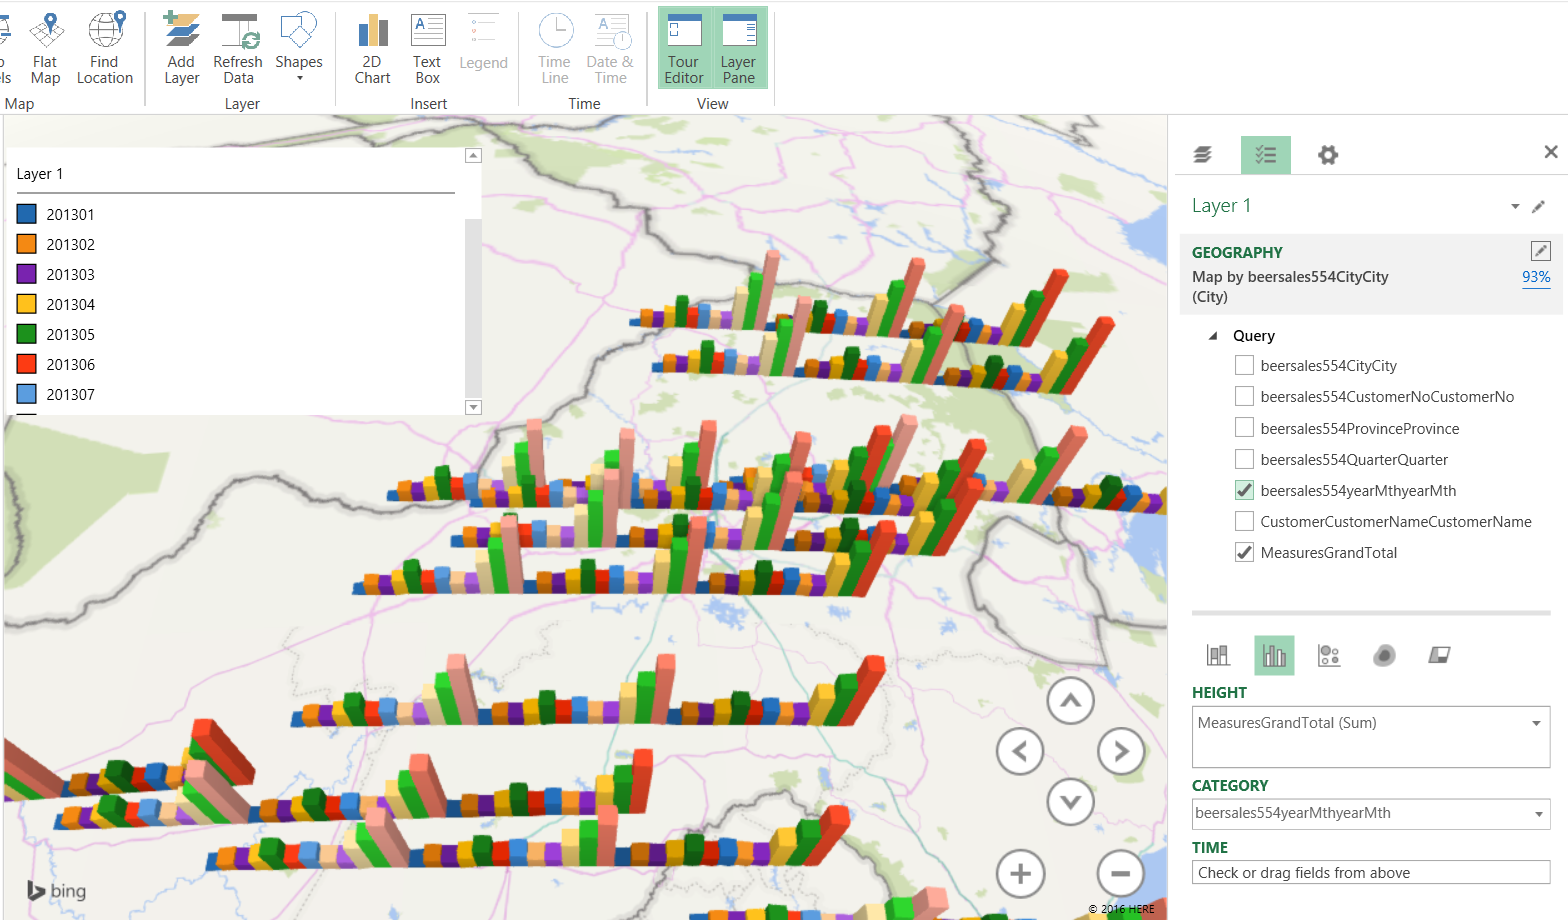
These types of charts are extremely useful to the decision maker who really wants to understand seasonal fluctuations and their effect on the bottom line.
Once again we have come to the end of our “get together” and I sincerely hope that this project has stimulated you, the reader, to try some topics that we have discussed. I honestly believe that you will be surprised.
Conclusions
Decision makers oft times are faced with difficult decisions with regards to corporate strategy and the direction and correction that must be made in order for the enterprise to achieve its mission and objectives. Many of today’s decision-makers have had extensive experience utilizing Microsoft Excel and it often gives them a “feeling of comfort”. The SQL Server Tabular project projects the “spreadsheet” image and often installs confidence in those that take advantage of its capabilities. While Excel is merely one manner in which data may be turned into information, SQL Reporting Services may achieve the same results, and in the second and last part of this series, we shall be utilizing this same project however our reporting will come from our Reporting Server.
In the interim, happy programming.
See more
For SQL Server and BI documentation, consider ApexSQL Doc, a tool that documents reports (*.rdl), shared datasets (*.rsd), shared data sources (*.rds) and projects (*.rptproj) from the file system and web services (native and SharePoint) in different output formats.
References:
- Microsoft Power BI Blog
- Automated administration across Multi-server environment
- Event forwarding between target and master servers
- Author
- Recent Posts

Steve Simon is a SQL Server MVP and a senior BI Development Engineer with Atrion Networking. He has been involved with database design and analysis for over 29 years.
Steve has presented papers at 8 PASS Summits and one at PASS Europe 2009 and 2010. He has recently presented a Master Data Services presentation at the PASS Amsterdam Rally.
Steve has presented 5 papers at the Information Builders’ Summits. He is a PASS regional mentor.
View all posts by Steve Simon
By Ryan Lambert — Published April 03, 2015
Let’s imagine that you have a database that contains some data in it that you want to share. Maybe you’ve inherited a SQL Server database and want to provide some basic reports to other users. Does that scenario sounds somewhat familiar?
Add Data to SQL
If you aren’t interested in creating the test database, feel free to skip this section by scrolling down until you see the chart. My feelings won’t be hurt, I promise!
To create a report in Excel using data in SQL, so we need some data to query against, and before we can have data, we need tables. Let’s create an employee and sales table.
CREATE TABLE dbo.employee
(
    employeeID INT IDENTITY NOT NULL PRIMARY KEY,
    name VARCHAR(200) NOT NULL,
    title VARCHAR(100) NOT NULL
);

CREATE TABLE dbo.sales
(
    salesID INT IDENTITY NOT NULL PRIMARY KEY,
    employeeID INT REFERENCES dbo.employee (employeeID),
    amount NUMERIC (6,2) NOT NULL,
    sale_date DATETIME NOT NULL DEFAULT GETDATE(),
);
Now insert some data. The first part is a straightforward INSERT statement to create the employees of this family ran sales business. The second part loops through and inserts 500 sales records to random employees. Change the @loop variable if you want to add more or fewer records, keep in mind more records will take more time.
INSERT INTO dbo.employee (name, title)
    VALUES
    ('Bob Smith','Sales Manger'),
    ('Jane Smith','Sales Associate'),
    ('Susan Doe','Sales Associate'),
    ('Suzy Salamander','Sales Associate'),
    ('Walker Texas-Ranger','Sales Cowboy'),
    ('John Doe','Sales Associate')
GO

DECLARE @i INT = 0;
DECLARE @loop INT = 500;
DECLARE @employeeID INT;
DECLARE @amount NUMERIC(6,2);

WHILE @i < @loop
BEGIN
    SELECT @employeeID = employeeID FROM dbo.employee ORDER BY NEWID();
    SELECT @amount = (RAND() * 10) + (RAND() * 100) + (RAND() * 150);
    INSERT INTO dbo.sales (employeeID, amount)
        VALUES (@employeeID, @amount);
    SET @i = @i + 1;
END
GO
Query Data
Now we have some data in our sales and employee tables so let’s run a query to get sales by employee.
SELECT e.name, e.title, SUM(s.amount) AS totalSales
    FROM dbo.sales s
    INNER JOIN dbo.employee e
        ON s.employeeID = e.employeeID
    GROUP BY e.name, e.title
    ORDER BY SUM(s.amount) DESC
You should see something like the following results, the totalSales will obviously vary.
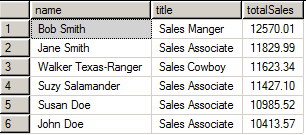
Now you could copy and paste those results in Excel and make a chart off the data manually and you might end up with something that looks like this:
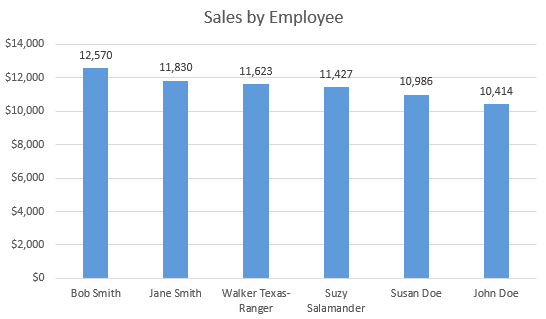
We could do that manually each day, week, or hour that they want the report updated, or we could automate away a lot of that headache.
Manual Processes Suck
I don’t like copying and pasting things. In my opinion, that’s low hanging fruit for automation! Below I include some VBA to help automate reports from SQL. You don’t have to “know” VBA to get this to work, the changes you have to make to the code should be minimal.
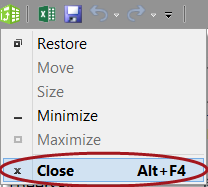
In Excel 2007 you now must save the file as a “Macro Enabled Workbook” that gets the file extensions “.xlsm”. You can find this option when you do “File > Save As”. In older versions of Excel they’re still stored in the same .xls files as regular files. To access the VBA editor in any version of Excel hit “Alt + F11″.
Don’t forget References
Because I know we’re going to be using the ADODB library, we need to add that to VBA’s references. This is done in the VBA editor under “Tools > References”. In the dialog that comes up, find and check the “Microsoft ActiveX Data Objects 2.8 Library” then click “Ok”. Without this, VBA will throw an error on the first line that references ADODB.
On the left hand side of the VBA editor, Right click on the VBA Project that contains your file’s name in it then select “Insert > Module”. Your “project” now has a module named “Module1″. Rename the module to “SQL” in the name field of the properties pane shown at the bottom of the screenshot.
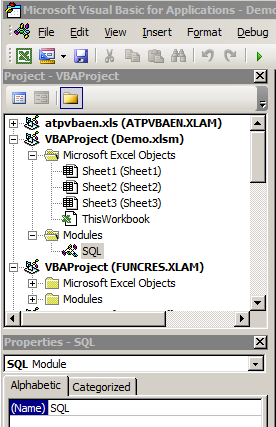
Now copy and paste the VBA code below into the code editor of your SQL module. Update the values for “db” and “srv” to match your environment. If you don’t know what values to put there, ask your database administrator. This assumes you’re using Windows Authentication to control access to MS SQL Server. Check out the code, I’ll explain after.
Option Explicit

Sub RunQry(dest As Range, SQL As String)

    Dim conn As New ADODB.Connection
    Dim cmd As New ADODB.Command
    Dim rs As ADODB.Recordset
    Dim connString  As String
    Dim db As String
    Dim srv As String

    ' Update the values between the double quotes (" ") to match your database server and name.
    db = "YourDatabaseName"
    srv = "YOURSQLSERVER"

    connString = "Provider=SQLOLEDB;Initial Catalog=" & db & ";Data Source =" & srv & ";Integrated Security=SSPI"
    conn.Open connString
    Set cmd.ActiveConnection = conn

    cmd.CommandText = SQL
    cmd.CommandType = adCmdText
    Set rs = cmd.Execute
    dest.CopyFromRecordset rs

    rs.Close
    conn.Close
    Set rs = Nothing
    Set conn = Nothing

End Sub
The RunQry module accepts two parameters, a Range for the returned data to be stored at and arbitrary SQL code to be executed. It creates an ADODB connection and executes the SQL query passed to the method against the server and database defined. The results from the executed SQL are then pasted at the range defined as a starting point.
Warning: This has potential security implications. Queries must be designed
with SQL Injection in mind!
Don’t ever pass raw text from the user in as query
parameters without sanitizing them first! Ideally users have very limited
permissions, and are limited to only executing stored procedures!
Execute our Query from Excel
Now that we have the SQL module with a RunQry, we can call it from other code and simply tell it what query to run, and where to put the data. Create a new module by right clicking on the Modules folder icon and again “Insert > Module” and name this one “main”.
Paste the following VBA code into the main module. Notice that I created a stored procedure in SQL Server to execute the sales by employee query because I hate having multi-line SQL escaped in VBA. This provides a cleaner and more secure approach.
Option Explicit

Sub run_sales_query()
    Dim data_start As Range
    Dim sql_qry As String

    ' Change to clear out the number of rows/columns your data will fill
    Sheet1.Range("A6:C20").Clear

    ' Change to move where data is placed
    Set data_start = Sheet1.Range("A6")

    ' Perfect example of why stored procedures are better for this!
    sql_qry = "EXEC dbo.getSalesByPerson"

    Call SQL.RunQry(data_start, sql_qry)
End Sub
The code pastes the results from our query (without headers) to cell A6 on Sheet1. This will leave room for the Refresh button above the data. I also manually add the headers above the data (row 5) since they don’t come in with the results from SQL.
To test run the report hit “Alt + F8″ and run the run_sales_query macro.
An error that highlights an ADODB line is probably a missing reference!
The sql_qry variable can be set to any regular SELECT or EXEC statement that returns data. I recommend always retrieving data from stored procedures, but hey, that’s just me!
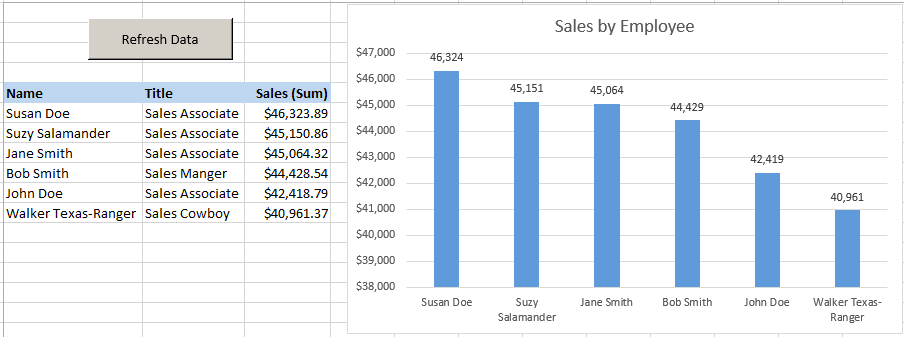
SQL Enabled Report
I added a simple button that triggers the run_sales_query module to refresh the data. I can now add to the sales data by running a couple thousand more sales transactions (see the Loop code above) and see the updated report by simply clicking the “Refresh Data” button. Pretty slick!
Final Thoughts
As your reports grow beyond more than one simple query, I find it’s best to have each distinct query going to its own dedicated worksheet to avoid potential overlap of data. Create your various polished reports for display that have links to the raw data worksheets. When the polished reports are ready, the raw data worksheets can be hidden to clean up the file. You can get fancier by providing drop down menus, but that’s beyond the scope of this post.
By Ryan Lambert
Published April 03, 2015
Last Updated April 17, 2015
Many companies today are using SQL Server to handle data about products, services, and support calls—just about anything you can imagine. Usually companies that have SQL Server have very large and expensive software applications dedicated to entering and retrieving data from the databases. While these applications are useful, and required for getting data into the SQL Server environment in many cases, reporting can sometimes be problematic.
For many users, generating reports from SQL Server is not the first thing they think of as user friendly. With a little work, you can create documents that present SQL Server data in such a way that your end users don’t realize the data they’re playing with lives in a huge database. Instead, you can present such data in a more familiar format such as an Excel spreadsheet. Here’s how it’s done.
Author’s note
The focus of this piece will be on two programs—SQL Server and Excel. This article will help you show your users how to use the two programs seamlessly to view data. The reports and information you’ll be able to provide will help them do their jobs more efficiently and reduce calls to the help desk or the company DBA.
For the purposes of this article, I’ll use SQL Server 2000 Evaluation Edition and Office XP. You’ll need at least the runtime version of Microsoft SQL Server and Microsoft Excel or Office. I’ll be using the Northwind database, an example database included with the Standard and Enterprise versions of SQL Server. This database is also available with Microsoft Access.
Simple prerequisites
Most office environments use Microsoft Office products, making Excel easy to come by. However, SQL Server can be a bit pricey, and if your organization hasn’t already shelled out or isn’t willing to shell out the usage fee (Microsoft licensing fees and other expenses) for the supercharged version of SQL Server, don’t worry. Microsoft has created a desktop edition that is free to download. It will hold data just as well as the bigger versions of the product but doesn’t come with all the helpful tools for designing databases.
Your first step in creating useful reports in Excel is to poll your user community for things they use everyday. For example, you might take note when users from a certain department come by to ask questions and get help; if they are having problems with a report or getting at some data, then this solution might provide both of you with a quick and easy fix to a potentially ongoing problem. In the following scenario, I’ll create a quick report for Phil, a marketing department employee, that details which customers purchased Sasquatch Ale and the quantities they purchased.
When preparing the customer report, talk to the users who might get additional use from it. Maybe it begins as a report to satisfy a need for Phil in the marketing department, but in the long run, a report created for one user will probably fit the needs of several others, with very few changes, if any.
Obtaining data natively in SQL Server
After you’ve collected some information, begin testing ideas to extract this data. Through my own experience, I’ve found that the best ways to write a report destined for Excel is to create it in Microsoft Query Analyzer or to use the tool included with Office, Microsoft Query, and test it for validity rather than relying on the Query Wizard.
Getting data from SQL Server can be very overwhelming if the report you’re generating looks to several tables and needs piles and piles of data. If you’re accessing multiple tables, then the Query Wizard may be a better choice to create the report. It allows you to include comments in SQL statements so that you can allow someone else to pick up where you left off, or in some cases, continue to build on a query later.
The report to show which customers purchased Sasquatch Ale and how much of this product was purchased per customer should contain only one query and reference four tables: Customers, Orders, Products, and Order Details. This three-table query might sound a bit complex at first, especially if you have yet to create your own SQL statement; but as you’ll see, it really isn’t so bad.
If you look at each element individually and piece it in with the other elements, it will fall into place quickly. To retrieve the customer information, company name, and contact name, you’ll need to select them from the Customers table. This table also contains the customer ID, which will provide access to the orders placed by that customer.
The Orders table, which contains the order ID for each order placed and the customer ID for the customer who placed the order, should be looked at as the gateway to the information you wish to select. While you do not need to display any of the information from the Orders table, you must make a pit stop there to get the order ID. Once this is done through a simple JOIN statement, you can select the quantity ordered for each customer, as well as the order date from the Order Details table using another simple JOIN statement.
One final JOIN statement tosses you into the Products table for the name of the product ordered. The code for this SELECT statement is shown below with comments:
— Query to select the Customers who ordered Sasquatch Ale, the quantity they purchased and the date the order
— was placed
— tell SQL Server which Database it should use for your query. By default the Master database is selected.
use northwind
— create a query selecting the columns needed from their respective tables
select cust.companyname, cust.contactname, orddet.quantity, ord.orderdate, prod.productname
from customers cust inner join orders ord on cust.customerid = ord.customerid inner join [order details] orddet on ord.orderid = orddet.orderid inner join products prod on orddet.productid = prod.productid
where prod.productname = ‘Sasquatch Ale’
The code sample above will create the output shown in Figure A.
| Figure A |
 |
| The result set from the above query, shown in Query Analyzer’s grid format, shows 19 customers who ordered Sasquatch Ale. |
The tables are joined on a common column. For example, Customers and Orders are joined where the customer IDs for both tables are equal using the command:
inner join orders ord on cust.customerid = ord.customerid
The tables also have additional syntax following their name. This is called an alias. It allows you to reference joined tables in shorthand format to simplify code. I used the cust alias for customers and the ord alias for orders. This allows me to use the syntax cust.contactname and ord.orderdate when referring to the contactname column in the Customers table and the orderdate column in the Orders table. Doing so makes the size of the query a little smaller. When you’re creating large queries, fewer keystrokes might be very helpful.
This query is not the simplest query to write using only transactional SQL. It involves joining four tables to retrieve the desired information. Also, in the above statement following the Where clause, I could have added order by ord.orderdate to put the results in order by the date the order was placed, but that is not necessary to make the statement work.
How to do it in Excel
Now I’ll look at the same query through the eyes of Excel. In Excel, go to Data | Import External Data | Select New Database Query. When you select the New Database Query menu option, you’ll be presented with the screen shown in Figure B, which asks you to choose a DSN.
| Figure B |
 |
| The data source name selection window with new data source highlighted: This is the default. |
What if there is no SQL Server DSN created? Simply click the OK button on the right-hand side of the window, with the default selection highlighted.
DSN, DNS, ODBC: What are all these acronyms?
When you connect to SQL Server using Excel, you’re creating an Open Database Connectivity (ODBC) connection to the database. These connections are referred to as Data Source Names (DSNs), which sometimes gets mistyped as DNS, the domain name system used on the Internet. I have often made this typo, which passes the spell checker in Word and can easily be overlooked.
Click the OK button at the right of the window. You’ll then see the Create New Data Source Wizard begin, as shown in Figure C.
| Figure C |
 |
| The first screen of the Create New Data Source Wizard |
You can specify a custom name for the DSN and then select the type of data source you’re connecting to. In this case, click the drop-down box, scroll to the last type of data source (SQL Server), and then click the Connect button.
On the SQL Server Login box, you’ll need to specify the server name of your SQL Server 2000 computer, along with the login credentials allowing your DSN to connect to the SQL Server successfully. If your database server uses Windows authentication, select the Use Trusted Connection box and click OK. This method of connection is shown in Figure D.
| Figure D |
 |
| Enter the login credentials required for the database. |
If your SQL Server uses SQL logins, or user accounts created within SQL Server, you should consider creating a read-only SQL login account for use by all reporting applications. If you have an account created already, enter the login name and password for that account on this page and click OK.
If you want to ensure that your data source always connects to the right database on the login box shown in Figure D, you can click the Options button and select the default database. In this case, that database would be Northwind. Then click OK and proceed with the remainder of the wizard. While this step isn’t required, it might make the process a little smoother. The screen to specify a database is shown in Figure E.
| Figure E |
 |
| Choosing a default database for this DSN |
The wizard will then make a connection to the database using the credentials you specified and ask you if you want to specify a table for this DSN, as shown in Figure C. Leave this box blank. Because your query will use more than one table, there isn’t a need for a default table. Saving the username and password as part of the DSN isn’t a bad idea if you have created a SQL login for read-only use; that way, you wouldn’t have to field calls about the username and password for the report.
Once you have everything filled in as desired, click OK. This will return you to the Choose A Data Source box, but this time your newly created DSN will appear in the list. Click on your DSN to select it and click OK.
On the next screen that comes up, you’ll see the Query Wizard shown in Figure F. Here, you can choose the columns within the tables of the default database (if you selected one previously) by expanding a table’s plus sign and highlighting the column you want to choose. Click the single arrow in the middle of the screen to add the column to the list.
| Figure F |
 |
| Choosing columns for use by the wizard |
After you’ve selected all the columns you want to use, click Next. You’ll then be asked to filter the result set. When you apply filters to the result set, you are essentially building the WHERE clause of the query. If you want to see only results where order ID is equal to 3, you would complete this page as shown in Figure G.
| Figure G |
 |
| Choose the order in which you would like the results sorted. |
When you have filtered the data as desired, click Next and tell the Query Wizard the order in which you would like your results sorted. This screen shows the columns you’ve selected in each drop-down box. If you select a column, the results will be sorted by each column that you selected.
On the final screen of the wizard, you can continue to edit your query within Microsoft Query, allowing you to further customize the results you receive, or you can create an OLAP query or return the results to Excel. For this portion of the wizard, I’ll add the query shown above to the wizard and display the results in Microsoft Query and then in Excel (Figures H and I).
| Figure H |
 |
| Results displayed in Microsoft Query |
| Figure I |
 |
| Results displayed in Microsoft Excel |
When you actually do return results to Excel, either from the wizard or from Microsoft Query, you’ll be asked to choose a cell to put the data in. If you plan to include the title of the report, you might want to leave a little extra room and begin the data around row 6. If you choose to view the query and further edit it in Microsoft Query, the icon on the toolbar showing a door with an arrow entering it is the button to return that data to Excel.
A sometimes easier alternative
When you’re using a complex query, as I have in this example, it might be easier to compose the query in Query Analyzer (shown above) or in Microsoft Query rather than using the wizard. To accomplish this, select any column when asked to do so by the wizard. Then click Next three times and select View Data or Edit Query in Microsoft Query. Click Finish, and you’ll see the record you chose in Microsoft Query. Highlight the table shown graphically at the top of the Microsoft Query window. Then click Table | Remove Table. Click the SQL button on the toolbar and manually type your query or paste a pretyped query into this box, and click OK.
Export SQL Data to Excel from Microsoft SQL Server
Let’s go over three ways to export an SQL Query to an Excel File Using MSSQL
Despite the pushback from Database aficionados, sometimes it makes sense to export data from SQL to an Excel file. It really depends on who is the audience of the information. Not everyone is great with SQL Analysis. Few people require access to the database.
And lots of times the boss just needs to see the information in Excel.
So, if Excel is the Output required this article is here to help you Export SQL Queries to Excel.
Here are three ways to Export a SQL query to Excel format. The last one can be kind of tricky. I’ll provide a condensed version followed by a detailed version with screenshots.
Three quick ways to Export SQL Data to Excel:
Choose the Summarized Version and then scroll to further down to use the SQL Export Version to Excel that works best for you.
Method Number 1 – Copy Grid results and Paste into Excel
Under Query, Make sure results to Grid are selected.
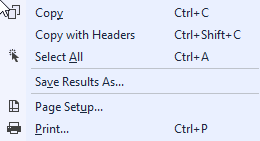
After Running your query, right-click the top right corner of the grid.
Copy With Headers.
Paste into an Excel File
Possible Issues:
I’ve seen formatting issues with this strategy. For Example, there are situations where the spreadsheet drops preceding zeroes after the copy-paste.
I’ve also noticed lengthy fields, (think of a really long free text field) end up running into the next line.
For the reasons above, I prefer this next method for a clean Excel file.
Method Number 2: Export the Query Results as a Task
In the object explorer window, find the database you want to export from.
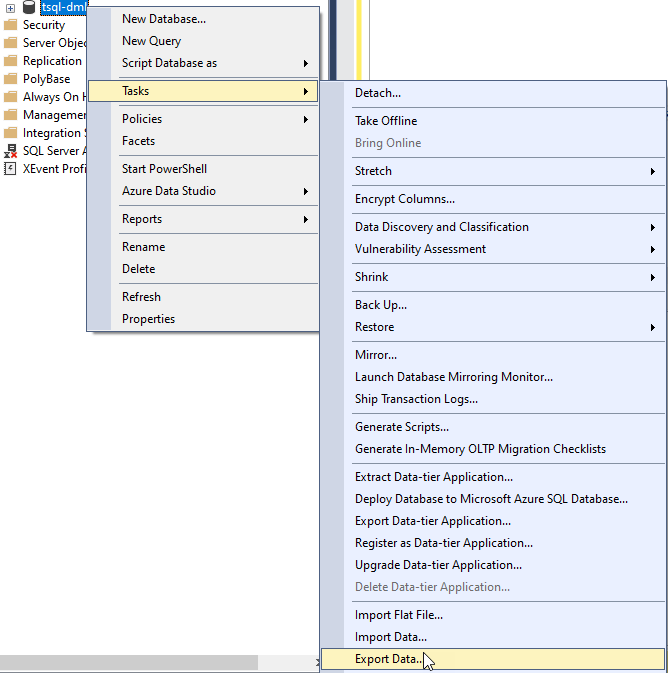
Right Click the Database, Click Tasks, and Export Data
The Wizard walks you through the rest of the steps but I have included screenshots below.
Method Number 3 – Use Good Old fashioned TSQL to send the data to an excel file
For those who value speed above all use the following script format.
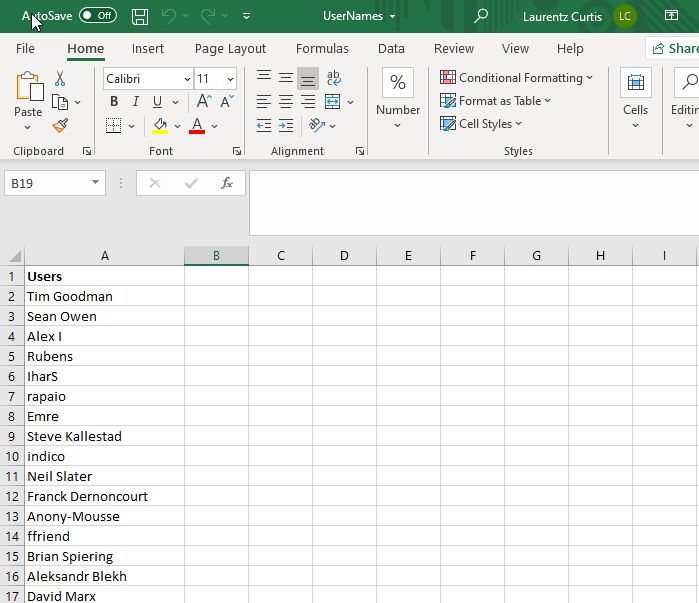
INSERT INTO OPENROWSET(‘Microsoft.ACE.OLEDB.12.0′,’Excel 12.0; Database=C:SQL2019ReportsUsernames.xlsx;’,’SELECT * FROM [Sheet1$]’) SELECT DisplayName FROM dbo.Users Where Reputation > 2000
Possible Issues – Configuring this might not be your type of fun and getting this straight deserves its own article.
Step by Step instructions with screenshots
Method Number 1 – Copy Grid results and paste into Excel
After ensuring results to grid turned on, Execute your query, right-click the top left-hand corner of the results grid.
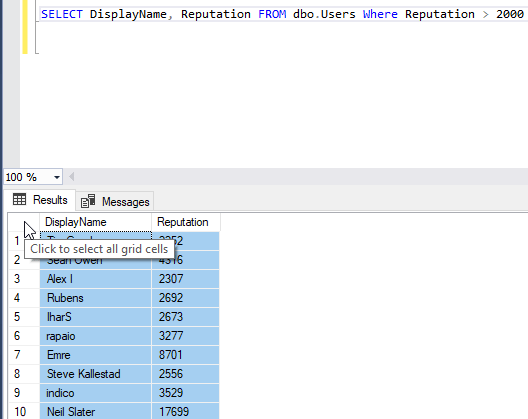
Choose Copy with Headers and then you are ready to paste in Excel with Ctrl + C
Method 2 – Export Via the Export Wizard
Right-click on the database you want to export from. Then Select tasks and “Export Data”.
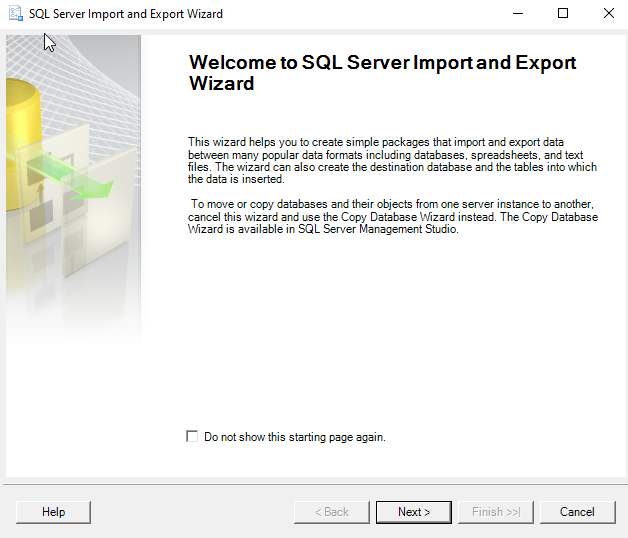
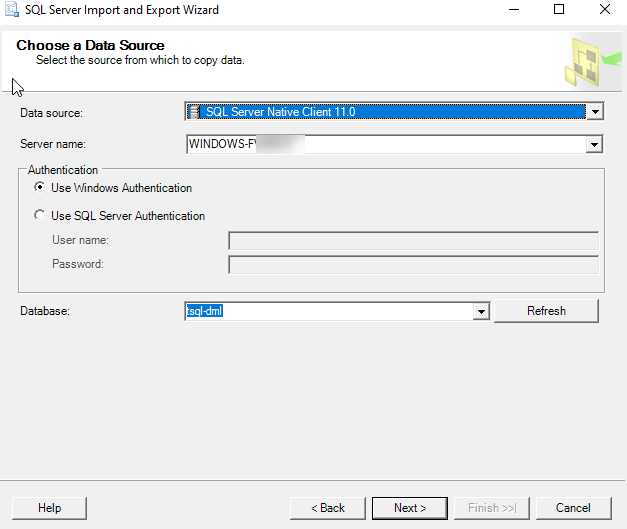
The SQL Server Wizard will startup. Click Next through the prompts.
Select the appropriate Native client, your server name, and database and choose “Next”.
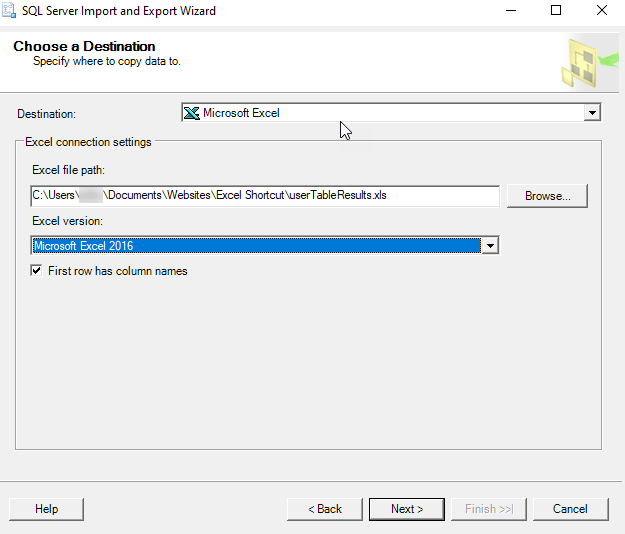
Next, Select Microsoft Excel and the file path where you want to import the data. The .xls file that you name will be created by this process.
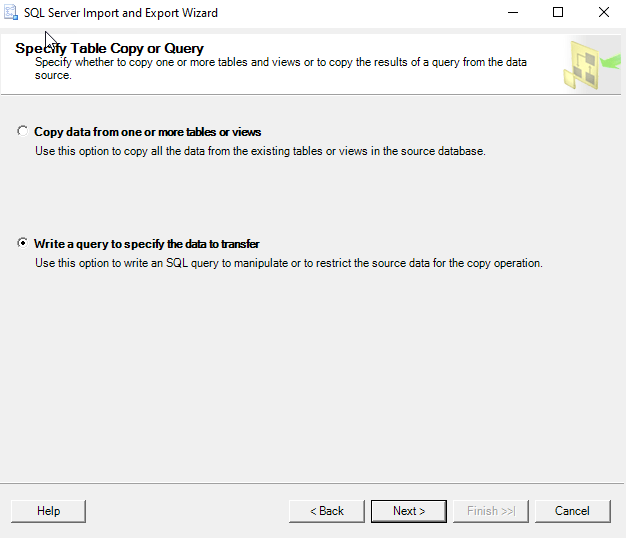
Now you can choose to export a whole table or a query. For the purpose of this exercise, we are creating a query.
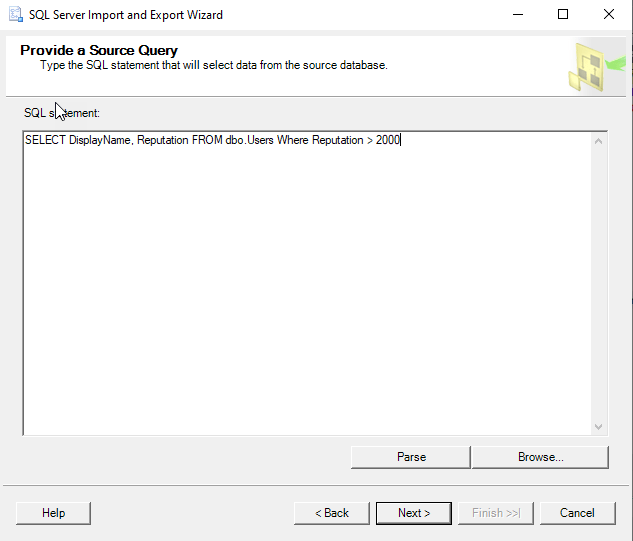
Paste the query into the SQL Statement field. Make sure every output field has a unique name.
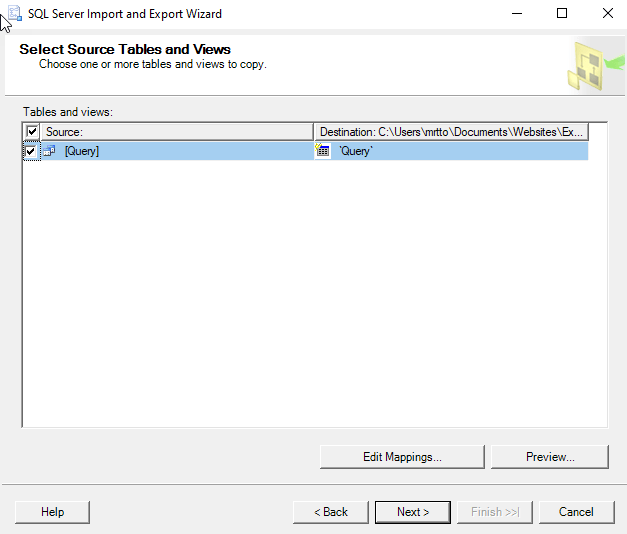
Click Next on the “Select Source Tables and Views” screen.
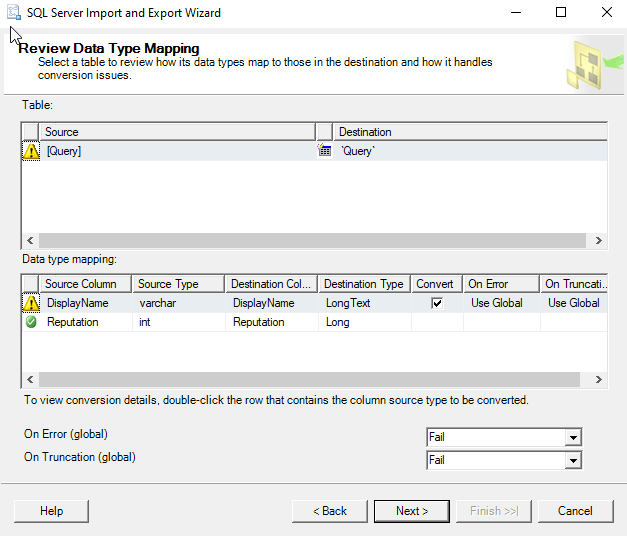
I use the default settings on the “conversion issues and data type mapping screen”
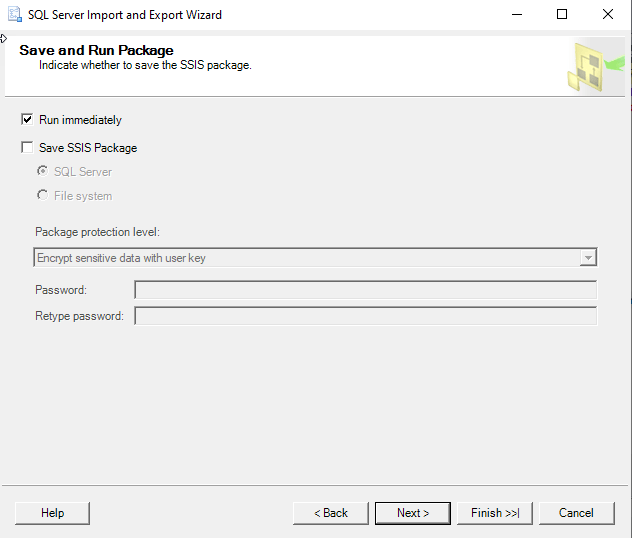
Now you can choose to Run immediately or Save an SSIS Package for later reuse.
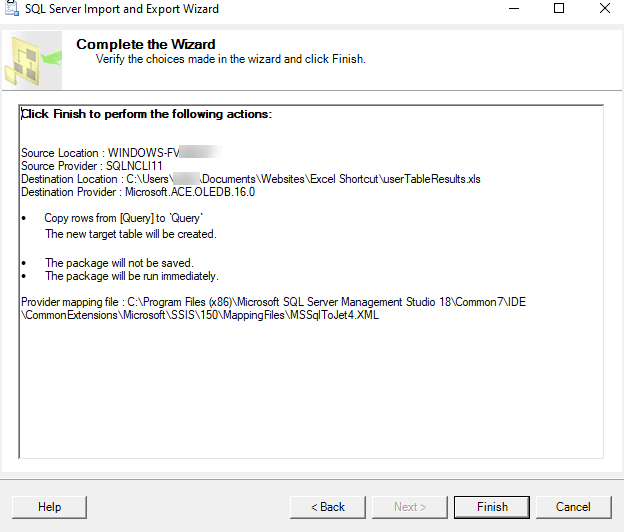
Double Check your settings and click finish.
Make sure there were no errors in the Export.
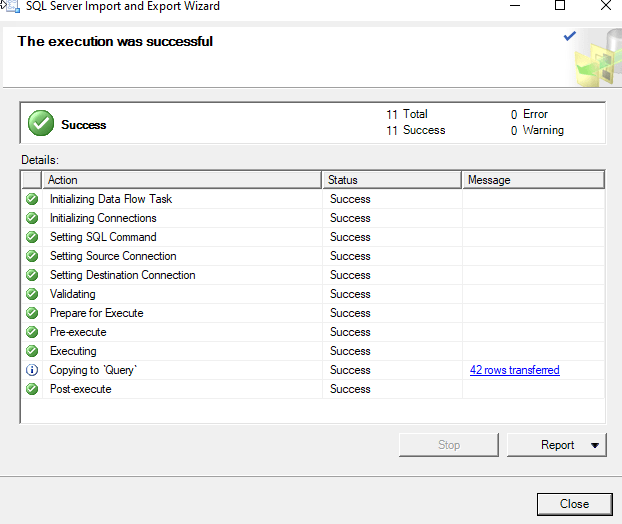
Now Go to the directory you choose earlier and make sure you have a sweet-looking Excel File at that location!
Method Number 3 – Use TSQL to send the data to an excel file
This method is the quickest once you get it set up but the configuration is the tricky part. Permissions can be a limiting factor.
Also with the script below, you have to make sure the file exists before you run the query for it to import properly.
First, create a blank excel file at the directory of your choosing.
C:SQL2019ReportsUsernames.xlsx
Then run this script below.
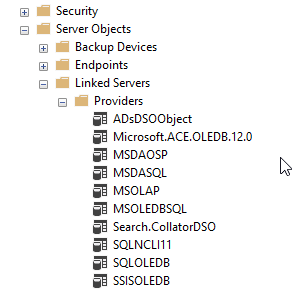
INSERT INTO OPENROWSET(‘Microsoft.ACE.OLEDB.12.0’,’Excel 12.0;
Database=C:SQL2019ReportsUsernames.xlsx;’,’SELECT * FROM [Sheet1$]’)
SELECT DisplayName FROM dbo.Users Where Reputation > 2000

Configuring this can be tricky and dependent on your level of permissions. Make sure you have the correct Linked Server/Provider installed (‘Microsoft.ACE.OLEDB.12.0’) And check your Database user settings to this server .