
Every organization, irrespective of the domain, undergoes certain routine tasks, like planning and managing projects, placing orders, maintaining inventory, and generating invoices. To keep the business flow organized, these tasks require many hours of dedicated work. Organizations are looking for ways to cut this time and automate their processes. This is where bound structured documents (templates) can help.
A template is a pre-defined and formatted workbook that is used to help create the final report. Once you have the template, it just needs only minor tweaks to adjust according to the purpose and can thereafter be used time and again, saving you a lot of wasted effort.
Introducing GcExcel Templates
GrapeCity Documents for Excel (GcExcel) introduces new template support with comprehensive syntax and API to bind Excel documents to data and create Excel reports with advance layouts. With flexible template syntax, easy notations, support for various types of data sources, and need for minimal programming, GcExcel Templates are easy to use to define Excel templates and create Excel reports.
To understand how easy it is to use GcExcel Templates, let’s generate a quarterly products sales report.
Generate Quarterly Products Sales Report using Templates
A sales report gives an overview of the state of the sales activity within a company. It shows different trends happening in the sales volume and alerts management to any potential issues. Taking regular snapshots of the product-wise sales helps to assess whether they’re generating expected revenue.
Let’s say there are several products sold by an organization. To analyze how the sales trend has changed over the years, they wish to generate a sales report. Instead of manually preparing the sales report, the company wants to automate the process of fetching products and their sales information from the database and generate a quarterly sales report as an Excel spreadsheet.
Using GcExcel Templates, the above requirement is straightforward to implement as the developer. Design the template in MS Excel, apply simple code to bind the template with the database, and GcExcel will generate separate Excel spreadsheet w.r.t product sales for each financial year.
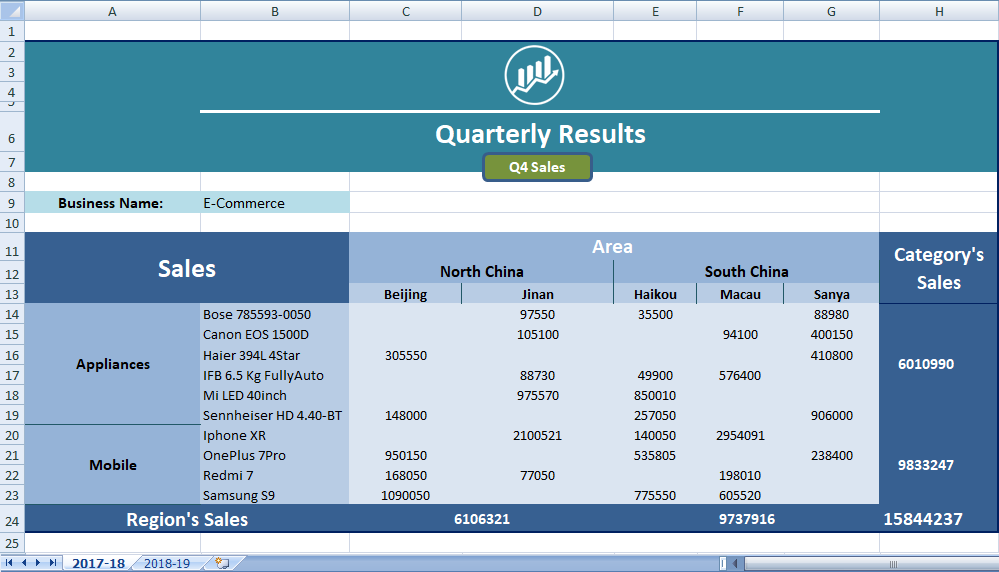
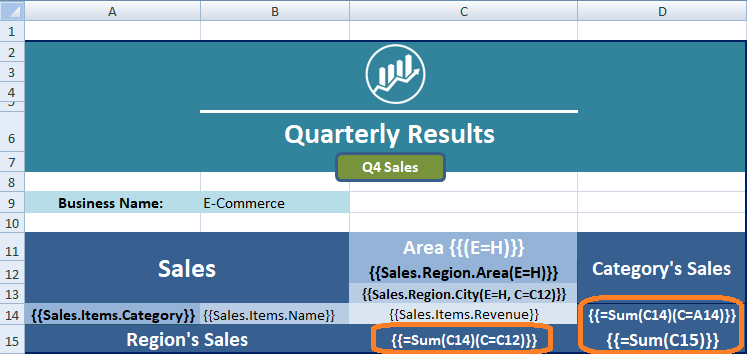
The following image shows how a sales report for a specific quarter looks:
To create this report, first you need to create a template in MS-Excel. How your final report will look depends on this template. Before getting started, let’s first familiarize ourselves with creating templates using GcExcel template syntax.
Generating XLSX Template in .NET Application
Template creation is undoubtedly the most important step in dynamic report generation. While creating a template, you’ll need to follow a certain GcExcel template syntax used to define database fields. Therefore, in the sales template wherever you want to replace the product and sales information, you must define the database fields following the syntax.
Template creation shall broadly be divided into the following steps:
- Define data
- Define data fields
- Set data field template properties
- Use formula functions
1. Define data — (C#)
As you see in the image above, the data fields: area, city and items’ category, name, and sale are present in the final expected report; therefore, they will need to be added.
The following classes: region, item and sale, are created which will act as the blueprint for sales report generation:
Data Field Declaration — (C#)
public class Item
{
    public Int32 ProductID { get; set; }
    public string Name { get; set; }
    public string Category { get; set; }
    public double Revenue { get; set; }
}
public class Region
{
    public string Area { get; set; }
    public string City { get; set; }
}
public class Sale
{
    private Region _region;
    private List<Item> _items;
    public int Year { get; set; }
    public Region Region
    {
        get { return _region; }
        set { region = value; }
    }
    public List<Item> Items
    {
        get { return _item; }
        set { items = value; }
    }
    public Sale()
    {
        Items = new List<Item>();
        Region = new Region();
    }
}
2. Creating Templates in MS-Excel
Once the data definitions are ready, you can start creating a template in Excel and map individual data field cells to their definition in the blueprint.
The following steps guide you through the template creation process.
2.1 Defining Data Fields
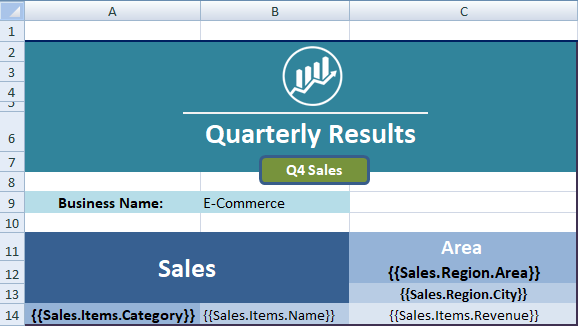
GcExcel Template syntax uses double curly braces »{{ }}’ to define database fields. So in the template cells where you want to show dynamically generated field values like category name, city name, etc., define the database field within curly braces.
To understand exactly how to define data fields in excel cells, we’ll show an item’s category name as displayed in the final report image above.
According to the data, the category’s name is mapped to Category property of Item class and Sale class contains a collection of Item as its member, so you should define the cell A14 as a nested field {{Sales.Items.Category}}, where Sales is the name of the data source. Similarly, the item’s name and revenue cells, B14 and C14 can be defined as {{Sales.Items.Name}} and {{Sales.Items.Revenue}}.
The same understanding shall be applied for showing Area and City. These fields are mapped to Region class’s Area and City properties and the Sale class defines the Region class as its member, so cells C12 and C13 can be defined as {{Sales.Region.Area}} and {{Sales.Region.City}} respectively.
2.2 Set Data Fields Properties
Apart from replacing data fields dynamically, GcExcel also facilitates how they get replaced. This is done by properties like Expansion, Context, Range, Group, Sort and more. GcExcel uses brackets ‘(‘ and ‘)‘ to organize all template properties. A property is set in key-value format and multiple properties get separated through a comma. For developer’s convenience, property names and values are case-insensitive and support shorthand notations.
Now, let’s see how to use some of these properties in the generation of sales reports.
Expansion
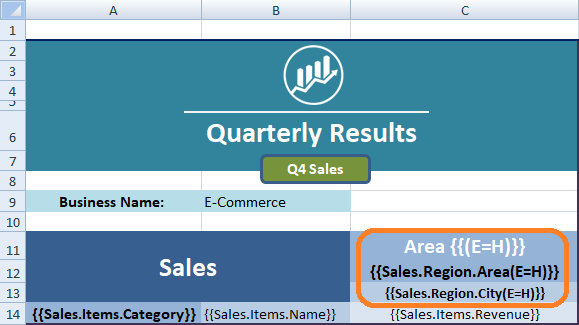
Above, data field cells were defined in a way that they get replaced dynamically by the field value, but when there are multiple values of the same field in data, you’ll want them to expand automatically, either vertically or horizontally. Like in the final sales report, Areas and Cities appear horizontally along with each other whereas Item’s Categories and Names appear vertically.
The template syntax helps you define the direction for data expansion using the Expansion property. Expansion of a field can happen in any of the directions, horizontal or vertical, the default being vertical expansion.
So, to make the areas and cities expand horizontally, you should use E=H inside brackets. Doing this, the definition for cell C12 and C13 should look like {{Sales.Region.Area(E=H)}} and {{Sales.Region.City(E=H)}}. Similarly, for expanding Item’s Category and Name vertically, cell A14 can be defined as {{Sales.Items.Category(E=V)}} and cell B14 as {{Sales.Items.Name(E=V)}} respectively but, since the default setting for expansion is vertical you can skip setting it and still get the same result.
Context
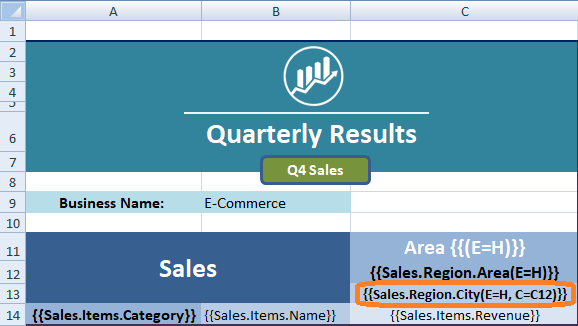
When multiple cells are bound on the same sheet, there can be relationships between them. Sometimes, a data field can filter the values of another field, other times it might group the dependent field cells. In such cases, the former cell is called the context cell of the dependent cell. By defining GcExcel’s Context property, you can direct how the dependent cells expand w.r.t the context cell.
In the final sales report image above, areas and cities expand horizontally, where only the cities belonging to that specific area appear below it, that is the Area field filters the Cities below it. To implement such a relationship, the city cell C13 should have its Context set to the Area cell-like, {{Sales.Region.City(E=H, C=C12)}}.
However, the context cell for vertical expansion (E=V) is the adjacent cell on the left and for horizontal expansion (E=H) adjacent cell on the top is the context cell, by default. Since the city cell is expanding horizontally (E=H), its’ Context is C12 by default. Therefore, you may skip setting the Context explicitly for this cell.
2.3 Using formula functions
Once the data fields are defined, you’d want to analyze the values of these data fields. For this, GcExcel template syntax supports the most common Excel functions like Sum, Count, Average, Min, Max, and more.
In a quarterly sales report, to analyze how much revenue each area has generated, the Revenue field value for all cities in that area needs to be summed. The Sum function can be used on the Revenue data field with Area cell C12 as its Context like {{=Sum(C14)(C=C12)}}. Similarly, to calculate sales for each Category, again use the Sum function for Revenue cell but with Category cell A14 as its Context, like {{=Sum(C14)(C=A14)}}.
Also, to get the total sales you can use Sum function either on cell D14 or on cell C15, as both will return the same total revenue.
Additionally, to compare this year’s quarterly data with previous years, multiple sheets can be generated. For this, just rename the template sheet in Excel to {{Sales.Duration}}, where Duration is a property in Sale class.
Following is an image of how the template with GcExcel template syntax should look:
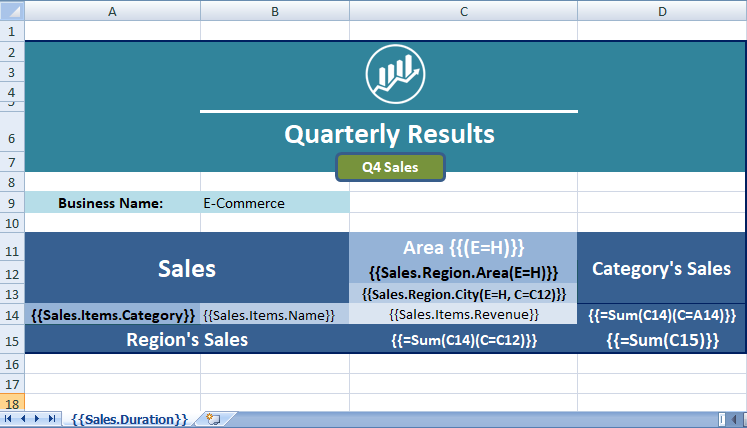
Sales_Template.xlsx
After you know the syntax and have created a template for your sales report, just load this template, add data, process template, and that’s it, your report will be ready.
Steps to use GcExcel Templates
Templates can be incredibly useful in your business and GcExcel Templates helps in automating these processes. Now you’re ready to get started with implementing GcExcel Templates in your application.
Following are the steps guiding you right from loading the GcExcel assembly, to generating the Excel report.
1. Installation
1.1 In your .Net Core Console application, right-click ‘Dependencies’ and select ‘Manage NuGet Packages’.
1.2 Under the ‘Browse’ tab search for GrapeCity.Documents.Excel and click Install.
1.3 While installing, you’ll receive two confirmation dialogs: ‘Preview Changes’ and ‘License Acceptance’, click ‘Ok’ and ‘I Agree’ respectively to continue.
2. Setup your project
2.1 Add namespace
In the Program file, import following namespace:
using GrapeCity.Documents.Excel;
2.2 Create a new workbook
In the main function, add following code to create a new GcExcel workbook.
Workbook book = new Workbook();
2.3 Load Excel Template
Use Open method to load existing Excel Template file (shown in Fig.1) in the GcExcel workbook:
book.Open("Sales_Template.xlsx");
2.4 Initialize data
Prepare data that will fill in the data fields in loaded Excel Template:
var sales = new List<Sale>();
Sale sale1 = new Sale();
Item item1 = new Item()
{
     ProductID = 1140,
     Category = "Mobile",
     Name = "Iphone XR",
     Revenue = 2334091
};
sale1.Items.Add(item1);
sale1.Duration = "2018-19";
sale1.Region = new Region() { Area = "South China", City = "Macau" }; ;
sales.Add(sale1);
NOTE: GcExcel Templates can bind Excel templates directly with data from any of the following objects: DataSet/DataTable, Custom Object, Variable, and Array/List.
2.5 Add datasource
Use the AddDataSource method, to load the data in workbook.
book.AddDataSource("Sales", sales);
2.6 Process Template
Use ProcessTemplate to execute the template. Invoking this method, the data fields will bind automatically to the Excel template loaded in the workbook.
book.ProcessTemplate();
2.7 Save report to XLSX
Finally, export it all to an Excel file so you can see how database fields get bound to the template dynamically, giving you the final report.
book.Save("../../../SalesReport.xlsx");
Be sure that this line of code comes AFTER all your other code, so that all of it processes before it gets saved.
Download the Templates GcExcel.zip
Demos and documentation:
Help .NET | Help Java | Demo .NET | Demo Java
If you have a question about this tutorial, leave it for us in the comment thread below!
Introduction
Excel is a very powerful tool for data analysis and reporting. People who work in the financial industry know that one way or the other Excel spreadsheets are used heavily. The focus of this article is on exposing a few techniques and concepts when dealing with ASP.NET and MS Excel.
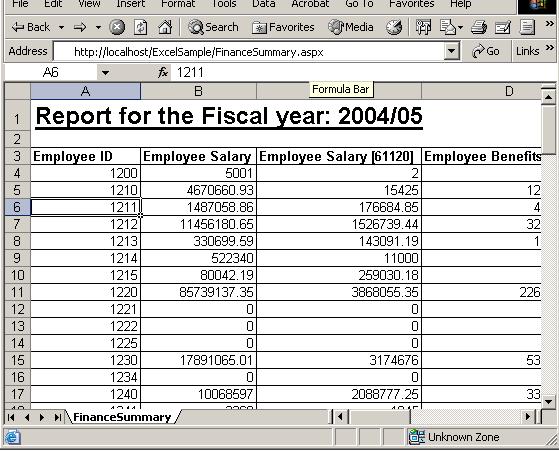
Report Generation:
The following sample code explains about Excel report generation from a DataGrid, and also how to add HTML code in that report:
private void btnExcelReport_Click(object sender, System.EventArgs e) { DataSet dsExport = GetData(); System.IO.StringWriter tw = new System.IO.StringWriter(); System.Web.UI.HtmlTextWriter hw = new System.Web.UI.HtmlTextWriter(tw); DataGrid dgGrid = new DataGrid(); dgGrid.DataSource = dsExport; hw.WriteLine("<b><u><font size='5'>" + "Report for the Fiscal year: " + txtFY.Text + "</font></u></b>"); hw.WriteLine("<br>∓nbsp;"); dgGrid.HeaderStyle.Font.Bold = true; dgGrid.DataBind(); dgGrid.RenderControl(hw); Response.ContentType = "application/vnd.ms-excel"; this.EnableViewState = false; Response.Write(tw.ToString()); Response.End(); }
Amalorpavanathan Yagulasamy (AMAL) is a Software Engineer for Protech Solution Inc. and has designed and implemented projects for Arkansas Child Support, Arkansas Budgetting, Michigan Child Support , Massachusetts Child Support, National Informatics Center-India and Indian Oil Corporation. His background is in developing relational databases and n-tier applications on Windows platforms in CMM Level Standards. He can be reached at amal_forum@hotmail.com
Introduction
Excel is such a powerful tool that almost all companies make extensive use of it for analyzing data.
Moreover, the internet is not as it was 10 years ago. Almost all pages that are out there on the internet are dynamic ones,
that is, interacts with a database in backend to produce results.
Sometimes, data that are displayed, if made available on in an Excel file, proper analysis of the data often helps in making more
accurate decisions by using Excel features. In this tutorial, we will learn how to interact with Excel files, both reading and writing.
You can download
Excel Reports Example ASP.NET Project associated with this tutorial.
Excel — ASP.NET Scenarios
For the purpose of this tutorial, an Excel sheet had been prepared that holds record of students
and their respective marks in subjects. Please note that these records are fictitious and had been input randomly.
|
|
|
|
10001 |
John |
|
10002 |
Terry Lane |
|
10003 |
Anne Marie |
|
10004 |
Tom Sawyer |
|
10005 |
Derek Ince |
|
10006 |
Emerson |
|
10007 |
Thommas |
|
10008 |
Edison |
|
10009 |
Teddy |
|
10010 |
Williams |
Fig 1. Table holding information for students
|
|
|
|
10001 |
50 |
|
10002 |
60 |
|
10003 |
75 |
|
10004 |
80 |
|
10005 |
90 |
|
10006 |
95 |
|
10007 |
100 |
|
10008 |
20 |
|
10009 |
48 |
|
10010 |
66 |
Fig 2. Table holding student marks in Mathematics subject
|
|
|
|
10001 |
30 |
|
10002 |
25 |
|
10003 |
65 |
|
10004 |
78 |
|
10005 |
95 |
|
10006 |
64 |
|
10007 |
32 |
|
10008 |
88 |
|
10009 |
95 |
|
10010 |
99 |
Fig 3. Table holding student marks in Geography subject
Interacting with Excel
Fortunately, there are COM objects that are available to interact with the Excel file.
Also, we can make use of the OleDB class to treat the Excel file as a simple table.
In this way, we can fire SQL queries to the Excel file so that we can retrieve data from the sheets.
An analogy can be made to a database. The Excel Workbook is considered as the Database while the Sheets are considered as tables.
Microsoft Excel 11.0 Object Library should be added as Reference to get the features for interacting with Excel.
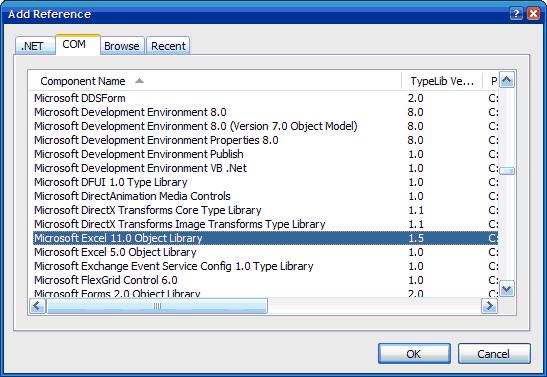
Fig 4. Adding Microsoft Excel 11.0 Object Library as Reference
The Excel file is then added to the DataSource folder in ASAP.NET to be interacted with.
To connect to a certain database, a connection string is needed. The same thing applies for Excel.
The following is a key added in the Web.Config file for future reference.
<add
name=«ExcelConnection«
connectionString=«Provider=Microsoft.Jet.Oledb.4.0;Data
Source=|DataDirectory|SchoolMgt.xls;Extended Properties=Excel 8.0«/>
Note that our Excel file which contains the necessary data will be SchoolMgt.xls,
as written in the connection string.
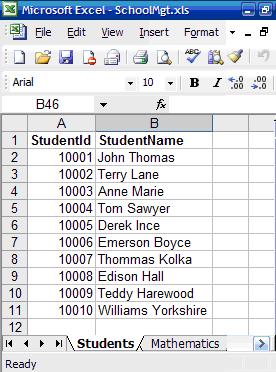
Fig 5. Excel file illustrating Excel Book containing data sheets with data
Reading data from Excel sheets
Let us build an interface for getting data from the Excel file.
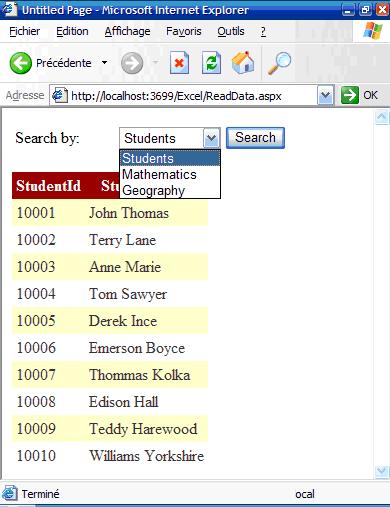
Fig 6. Interface to search records per table selected.
It is important to import the following:
Imports
System.Data.OleDb
Imports
System.Data
The following code creates the connection and builds the query based on the selected table.
Protected
Sub btnSearch_Click(ByVal
sender As Object,
ByVal e As
System.EventArgs) Handles btnSearch.Click
Try
Dim strExcelConn
As String =
System.Configuration.ConfigurationManager.ConnectionStrings.Item(«ExcelConnection»).ToString()
Dim dbConn
As New OleDbConnection(strExcelConn)
Dim strSQL
As String
strSQL = «SELECT * FROM [« &
cmbSheets.SelectedItem.ToString() & «$]»
dbConn.Open()
Dim cmd As
New OleDbCommand(strSQL, dbConn)
Dim dsExcel
As New DataSet
Dim daExcel
As New OleDbDataAdapter(cmd)
daExcel.Fill(dsExcel)
dgResults.DataSource = dsExcel
dgResults.DataBind()
Catch ex As
Exception
Throw ex
End Try
End
Sub
Please note that the table name in the SELECT query should be in the format [TableName$],
which the square brackets and the dollar sign at the end.
Playing with SELECT statements
As you have guessed, the Excel file has turned out to be a normal database.
The transparency that the OleDB connection had made is exceptional.
Also, note that the first row is taken to contain field names for the columns.
Now, let us get the marks of the students in Mathematics, Geography and Total,
sorted in Descending order.
Protected
Sub btnGenerateReport_Click(ByVal
sender As Object,
ByVal e As
System.EventArgs) Handles
btnGenerateReport.Click
Try
Dim
strExcelConn As String
= System.Configuration.ConfigurationManager.ConnectionStrings.Item(«ExcelConnection»).ToString()
Dim
dbConn As New
OleDbConnection(strExcelConn)
Dim
strSQL As String
strSQL =
«SELECT S.StudentId, S.StudentName, M.Marks, G.Marks,
(M.Marks+G.Marks) AS Total «& _
«FROM [Students$] S,
[Mathematics$] M, [Geography$] G «& _
«WHERE(S.StudentId = M.StudentId
And S.StudentId = G.StudentId) « & _
«ORDER BY (M.Marks+G.Marks) DESC»
dbConn.Open()
Dim
cmd As New
OleDbCommand(strSQL, dbConn)
Dim
dsExcel As New
DataSet
Dim
daExcel As New
OleDbDataAdapter(cmd)
daExcel.Fill(dsExcel)
dgReports.DataSource = dsExcel
dgReports.DataBind()
Catch
ex As Exception
Throw
ex
End
Try
End
Sub
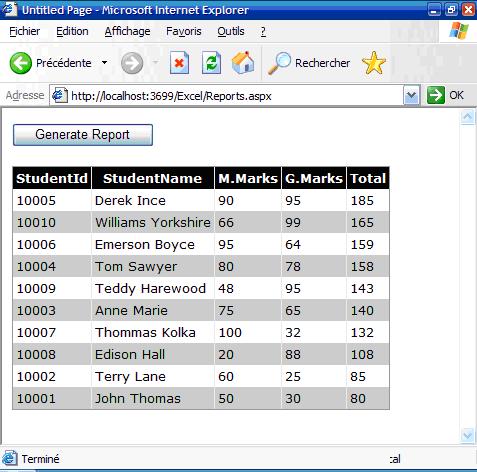
Fig 7. Report generating the students’ marks and total, sorted in descending order.
Generating Excel Reports
Two ways for generating Excel report will be discussed in this tutorial.
The first one is using the «Response» class and the second one by manipulating the Excel objects that
«Microsoft Excel 11.0» Objects provide.
The following piece of code illustrates how this is done
Protected Sub
btnToExcelByResponse_Click(ByVal sender
As Object,
ByVal e As
System.EventArgs) Handles
btnToExcelByResponse.Click
‘ Variables declaration
Dim dsExport As
New DataSet()
Dim tw As
New System.IO.StringWriter()
Dim hw As
New System.Web.UI.HtmlTextWriter(tw)
Dim dgGrid As
New DataGrid()
dgGrid.DataSource = getData()
‘ Report Header
hw.WriteLine(«<b><u><font size=’5′> Student Marking
Report </font></u></b>»)
‘ Get the HTML for the control.
dgGrid.HeaderStyle.Font.Bold = True
dgGrid.DataBind()
dgGrid.RenderControl(hw)
‘ Write the HTML back to the browser.
Response.ContentType = «application/vnd.ms-excel»
Me.EnableViewState =
False
Response.Write(tw.ToString())
Response.End()
End Sub
-
First, we create the dataset that will hold the records.
Then, a StringWriter object (tw) is also created along with an HtmlTextWriter (hw)
which takes as parameter the text writer object. They are important for rendering purposes;
i.e. html tags can be applied like bold, italic etc. to the resulting Excel report. -
Also, a datagrid object which will store the dataset of records.
-
Note that function getData() in the code snippet only
contains the codes in the previous example which returns a dataset of records. -
hw.WriteLine(«<b><u><font
size=’5′> Student Marking Report </font></u></b>») shows that you can also combine HTML codes with the output for proper display.
In our example, the font size will be 5, underlined and bold. -
dgGrid.RenderControl(hw) renders the HTML object with the data that the datagrid contains.
The result is normally formatted in a tabular format. -
Response.ContentType =
«application/vnd.ms-excel» makes the Reponse object output to Excel. -
Response.Write(tw.ToString()) outputs the formatted object to Excel.
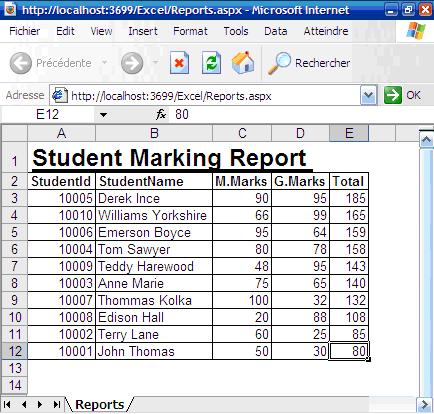
Figure 8. Output result showing the report that is generated in Excel
The second way for generating Excel reports from ASP.NET is to use the Microsoft Excel 11.0 Objects.
This method offers more fallibility in terms of manipulating the features that Excel provides and formatting the report.
The following code snippet makes use of the various Excel objects that Excel provides to generate the report.
Imports
System.Reflection
Imports
Excel = Microsoft.Office.Interop.Excel
Protected Sub
btnToExcelByObjects_Click(ByVal sender As
Object, ByVal e
As System.EventArgs)
Handles btnToExcelByObjects.Click
Try
Dim xlWorkBook
As Excel.Workbook
Dim xlWorkSheet
As Excel.Worksheet
xlWorkBook = New
Excel.Application().Workbooks.Add(Missing.Value)
xlWorkBook.Application.Visible = True
xlWorkSheet = xlWorkBook.ActiveSheet
‘ Gets the dataset containing the data
Dim dsData
As DataSet = getData()
Dim i As
Integer = 2
‘ Outputting the fieldnames in pink bold
color
xlWorkSheet.Cells(1, 1) = «Student ID»
xlWorkSheet.Cells(1, 2) = «Student Name»
xlWorkSheet.Cells(1, 3) = «Mathematics»
xlWorkSheet.Cells(1, 4) = «Geography»
xlWorkSheet.Cells(1, 5) = «Total»
xlWorkSheet.Range(«$A1:$E1»).Font.ColorIndex
= Excel.Constants.xlColor1
xlWorkSheet.Range(«$A1:$E1»).Font.Bold
= True
‘ Outputting the data
For Each
dr As DataRow In
dsData.Tables(0).Rows
xlWorkSheet.Cells(i, 1) = dr(0)
xlWorkSheet.Cells(i, 2) = dr(1)
xlWorkSheet.Cells(i, 3) = dr(2)
xlWorkSheet.Cells(i, 4) = dr(3)
‘ Building the formula for
calculating the sum
xlWorkSheet.Cells(i, 5).Formula =
«=SUM($C{0}:$D{0})».Replace(«{0}»,
i.ToString())
‘ Going to the next row
i = i + 1
Next
‘ Auto fit the columns
xlWorkSheet.Columns.AutoFit()
‘ Generating the graph
Dim chart
As Excel.Chart
chart = xlWorkBook.Charts.Add()
With chart
.ChartType = Excel.XlChartType.xlColumnClustered
.SetSourceData(xlWorkSheet.Range(«A1:E11»),
2)
.HasTitle = True
.ChartTitle.Characters.Text =
«Students’ marks»
.Axes(1, Excel.XlAxisGroup.xlPrimary).HasTitle =
True
.Axes(1, Excel.XlAxisGroup.xlPrimary).AxisTitle.Characters.Text
= «Students»
.Axes(2, Excel.XlAxisGroup.xlPrimary).HasTitle =
True
.Axes(2, Excel.XlAxisGroup.xlPrimary).AxisTitle.Characters.Text
= «Marks»
End With
Catch ex As
Exception
Throw ex
End Try
End Sub
An Excel workbook is first created. Then the active sheet is accessed by xlWorkSheet =
xlWorkBook.ActiveSheet. After that, we get the data into the dataset, ready to be processed.
Using the Font property, the title is displayed in Pink bold colour.
Note how the Formula that Excel provides is properly used to calculate the SUM of the marks for
each student xlWorkSheet.Cells(i, 5).Formula = «=SUM($C{0}:$D{0})».Replace(«{0}», i.ToString()).
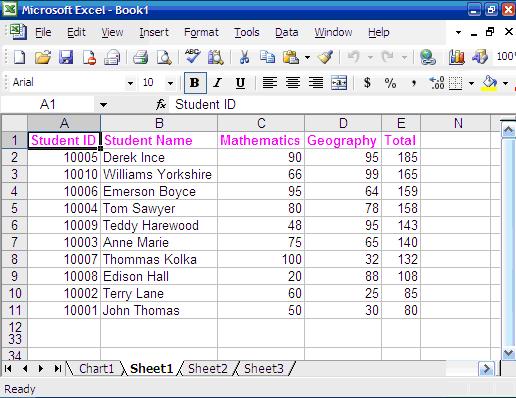
Figure 9. Excel Report having output the list of students and their respective marks.
A chart is also generated using the objects.
The x-axis consists of the names and id of each student. The y-axis, the marks for the different students.
The chart is always handy for analysis of data.
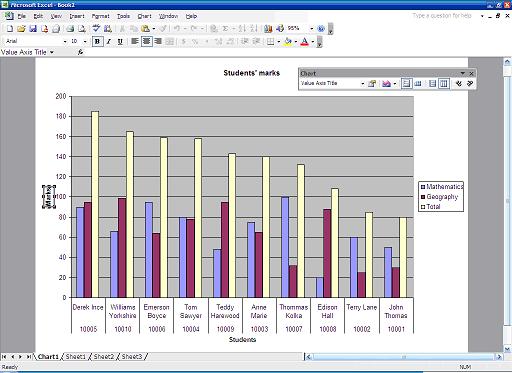
Figure 10. Chart that is generated using Microsoft Excel 11.0 Objects
Summary
In this tutorial, you learned how to read data from Excel,
generate report using the Response objects and to play with the Microsoft Excel 11.0 objects provided.
Indeed, it is impossible to cover all features in this tutorial but many important techniques were covered
to help you down the line. It is up to you to be creative and adapt the techniques to your scenarios.
Going professional with NativeExcel for .NET
Excel is powerful tool, but in real world development you rarely have Microsoft Office installed on your web server. There is no Excel on shared hosting and obtaining Office license for dedicated server is possible, but also pretty expensive. Fortunately, there is pure .NET component named Native Excel for .NET that creates or modifies Excel documents on the fly. For just $120 for single license you can use it on unlimited number of web sites and servers (source code available too). It is easier to distribute application since you work with simple assembly written in C#, instead of COM Excel object. Best of all, you don’t need to learn anything new because objects and properties are identical to Excel’s, so if you understood this tutorial you are already expert for NativeExcel too :).
Tutorial toolbar: Tell A Friend | Add to favorites | Feedback |

Excel Export
Simple classes to generate Excel/CSV Report in ASP.NET Core.
To export/download the IEnumerable<T> data as an excel file, add action method in your controller as shown below. Return the data as ExcelResult<T>/CSVResult<T> by passing filtered/ordered data, sheet name and file name. ExcelResult/CSVResult Action Result that I have added in the Nuget package. This will take care of converting your data as excel/csv file and return it back to browser.
Note: This tutorial contains example for downloading/exporting excel/csv from Asp.Net Core Backend.
Give a Star ⭐️
If you liked ExcelExport project or if it helped you, please give a star ⭐️ for this repository. That will not only help strengthen our .NET community but also improve development skills for .NET developers in around the world. Thank you very much 👍
Columns
Name
Column names in Excel Export can be configured using the below attributes
[Display(Name = "")][DisplayName(“”)]
Report Setup
To customize the Excel Column display in your report, use the following attribute
[IncludeInReport][NestedIncludeInReport]
And here are the options,
| Option | Type | Example | Description |
|---|---|---|---|
| Order | int |
[IncludeInReport(Order = N)] |
To control the order of columns in Excel Report |
Please note: From v.2.0.0, simple properties in your models with [IncludeInReport] attribute will be displayed in excel report. You can add any level of nesting to your models using [NestedIncludeInReport] attribute.
NuGet:
- Fingers10.ExcelExport v3.0.0
Package Manager:
PM> Install-Package Fingers10.ExcelExport
.NET CLI:
> dotnet add package Fingers10.ExcelExport
Root Model
public class DemoExcel
{
    public int Id { get; set; }

    [IncludeInReport(Order = 1)]
    public string Name { get; set; }

    [IncludeInReport(Order = 2)]
    public string Position { get; set; }

    [Display(Name = "Office")]
    [IncludeInReport(Order = 3)]
    public string Offices { get; set; }

    [NestedIncludeInReport]
    public DemoNestedLevelOne DemoNestedLevelOne { get; set; }
}
Nested Level One Model:
public class DemoNestedLevelOne
{
    [IncludeInReport(Order = 4)]
    public short? Experience { get; set; }

    [DisplayName("Extn")]
    [IncludeInReport(Order = 5)]
    public int? Extension { get; set; }

    [NestedIncludeInReport]
    public DemoNestedLevelTwo DemoNestedLevelTwos { get; set; }
}
Nested Level Two Model:
public class DemoNestedLevelTwo
{
    [DisplayName("Start Date")]
    [IncludeInReport(Order = 6)]
    public DateTime? StartDates { get; set; }

    [IncludeInReport(Order = 7)]
    public long? Salary { get; set; }
}
Action Method
public async Task<IActionResult> GetExcel()
{
    // Get you IEnumerable<T> data
    var results = await _demoService.GetDataAsync();
    return new ExcelResult<DemoExcel>(results, "Demo Sheet Name", "Fingers10");
}

public async Task<IActionResult> GetCSV()
{
    // Get you IEnumerable<T> data
    var results = await _demoService.GetDataAsync();
    return new CSVResult<DemoExcel>(results, "Fingers10");
}
Page Handler
public async Task<IActionResult> OnGetExcelAsync()
{
     // Get you IEnumerable<T> data
    var results = await _demoService.GetDataAsync();
    return new ExcelResult<DemoExcel>(results, "Demo Sheet Name", "Fingers10");
}

public async Task<IActionResult> OnGetCSVAsync()
{
     // Get you IEnumerable<T> data
    var results = await _demoService.GetDataAsync();
    return new CSVResult<DemoExcel>(results, "Fingers10");
}
Target Platform
- .Net Standard 2.0
Tools Used
- Visual Studio Community 2019
Other Nuget Packages Used
- ClosedXML (0.95.0) — For Generating Excel Bytes
- Microsoft.AspNetCore.Mvc.Abstractions (2.2.0) — For using IActionResult
- System.ComponentModel.Annotations (4.7.0) — For Reading Column Names from Annotations
Author
- Abdul Rahman — Software Developer — from India. Software Consultant, Architect, Freelance Lecturer/Developer and Web Geek.
Contributions
Feel free to submit a pull request if you can add additional functionality or find any bugs (to see a list of active issues), visit the Issues section. Please make sure all commits are properly documented.
License
ExcelExport is release under the MIT license. You are free to use, modify and distribute this software, as long as the copyright header is left intact.
Enjoy!
Sponsors/Backers
I’m happy to help you with my Nuget Package. Support this project by becoming a sponsor/backer. Your logo will show up here with a link to your website. Sponsor/Back via
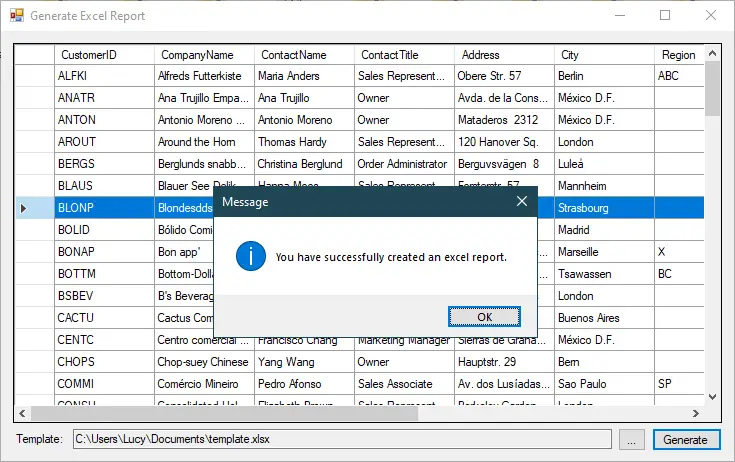
This post shows you How to generate excel report using ClosedXml.Report in C# Windows Forms Application.
Creating a new Windows Forms Application project, then open your form designer.
Next, Drag the Button, TextBox, Label and DataGridView control from the Visual Studio toolbox into your form designer. You can design a simple UI that allows you to select an excel template file, then fill data and generate an excel report from based on the excel template file.
After you finish designing the form, you need to right click on your project, then select Manage Nuget Packages.
c# generate excel report
Next, Search and Install ClosedXml.Report to your project.
ClosedXML.Report is a tool for report generation and data analysis in .NET applications through the use of Microsoft Excel. ClosedXML.Report is a .NET-library for report generation Microsoft Excel without requiring Excel to be installed on the machine that’s running the code.
Right-clicking on your project, then add an ADO.NET Entity Data Model to your project.
We will use the Customer table in the Northwind database to practice this demo

Next, You need to rebuild your project, then add a bindingsource to your DataGridView.
Adding a Form_Load event handler that allows you to retrieve customer data from the Northwind database, then set datasource to the bindingsource.
private void Form1_Load(object sender, EventArgs e)
{
    NorthwindEntities db = new NorthwindEntities();
    customerBindingSource.DataSource = db.Customers.ToList();
}
Adding a click event handler to the Browse button that allows you to get the excel template name.
private void btnBrowse_Click(object sender, EventArgs e)
{
    using (OpenFileDialog ofd = new OpenFileDialog() { Filter = "Excel Workbook|*.xlsx", Multiselect = false })
    {
        if (ofd.ShowDialog() == DialogResult.OK)
            txtFileName.Text = ofd.FileName;
    }
}
Finally, Add a click event handler to the Generate button that allows you to generate excel report based on row you select from DataGridView.
//generate excel report using c#
private void btnGenerate_Click(object sender, EventArgs e)
{
    if (string.IsNullOrEmpty(txtFileName.Text))
    {
        MessageBox.Show("Please select your template file.", "Message", MessageBoxButtons.OK, MessageBoxIcon.Warning);
        return;
    }
    using (SaveFileDialog sfd = new SaveFileDialog() { Filter = "Excel Workbook|*.xlsx", ValidateNames = true })
    {
        if (sfd.ShowDialog() == DialogResult.OK)
        {
            try
            {
                var template = new XLTemplate(txtFileName.Text);
                var customer = customerBindingSource.Current as Customer;
                if (customer != null)
                {
                    template.AddVariable(customer);
                    template.Generate();
                    template.SaveAs(sfd.FileName);
                }
                MessageBox.Show("You have successfully created an excel report.", "Message", MessageBoxButtons.OK, MessageBoxIcon.Information);
            }
            catch (Exception ex)
            {
                MessageBox.Show(ex.Message, "Message", MessageBoxButtons.OK, MessageBoxIcon.Error);
            }
        }
    }
}
Next, Create an excel template report with data fields you want to fill data.
This is a simple c# example help you generate excel reports from the excel template file in c# using ClosedXml.Report library.